2787
Altered topological properties of gray matter structural covariance networks inminimal hepatic encephalopathy1Department of Radiology, Fujian Medical University Union Hospital, Fuzhou, China
Synopsis
Despite the abnormal structural findings in cirrhotic patients with MHE, previous studies have only focused on regional structural changes in cirrhosis and did not consider brain network-level architecture. Recent progress in structural MRI analysis has facilitated the development of a human brain structural network model that is based on statistical correlations of morphological descriptors, including the thickness of the cortex or regional gray matter volume (RGMV). We investigated the topological alterations involving brain structural covariance networks in MHE patients for the first time. Our results suggest that MHE patients exhibit an unoptimizable architecture involving the gray matter structural covariance network and provide structural evidence supporting that MHE is a neurological complication related to disrupted neural networks.
Purpose
Liver cirrhosis commonly induces brain structural impairments that are associated with neurological complications [e.g., minimal hepatic encephalopathy (MHE)], but the topological characteristics of the brain structural network are still less well understood in cirrhotic patients with MHE. This study aimed to conduct the first investigati on on the topological alterations of brain structural covariance networks in MHE.
.
Methods
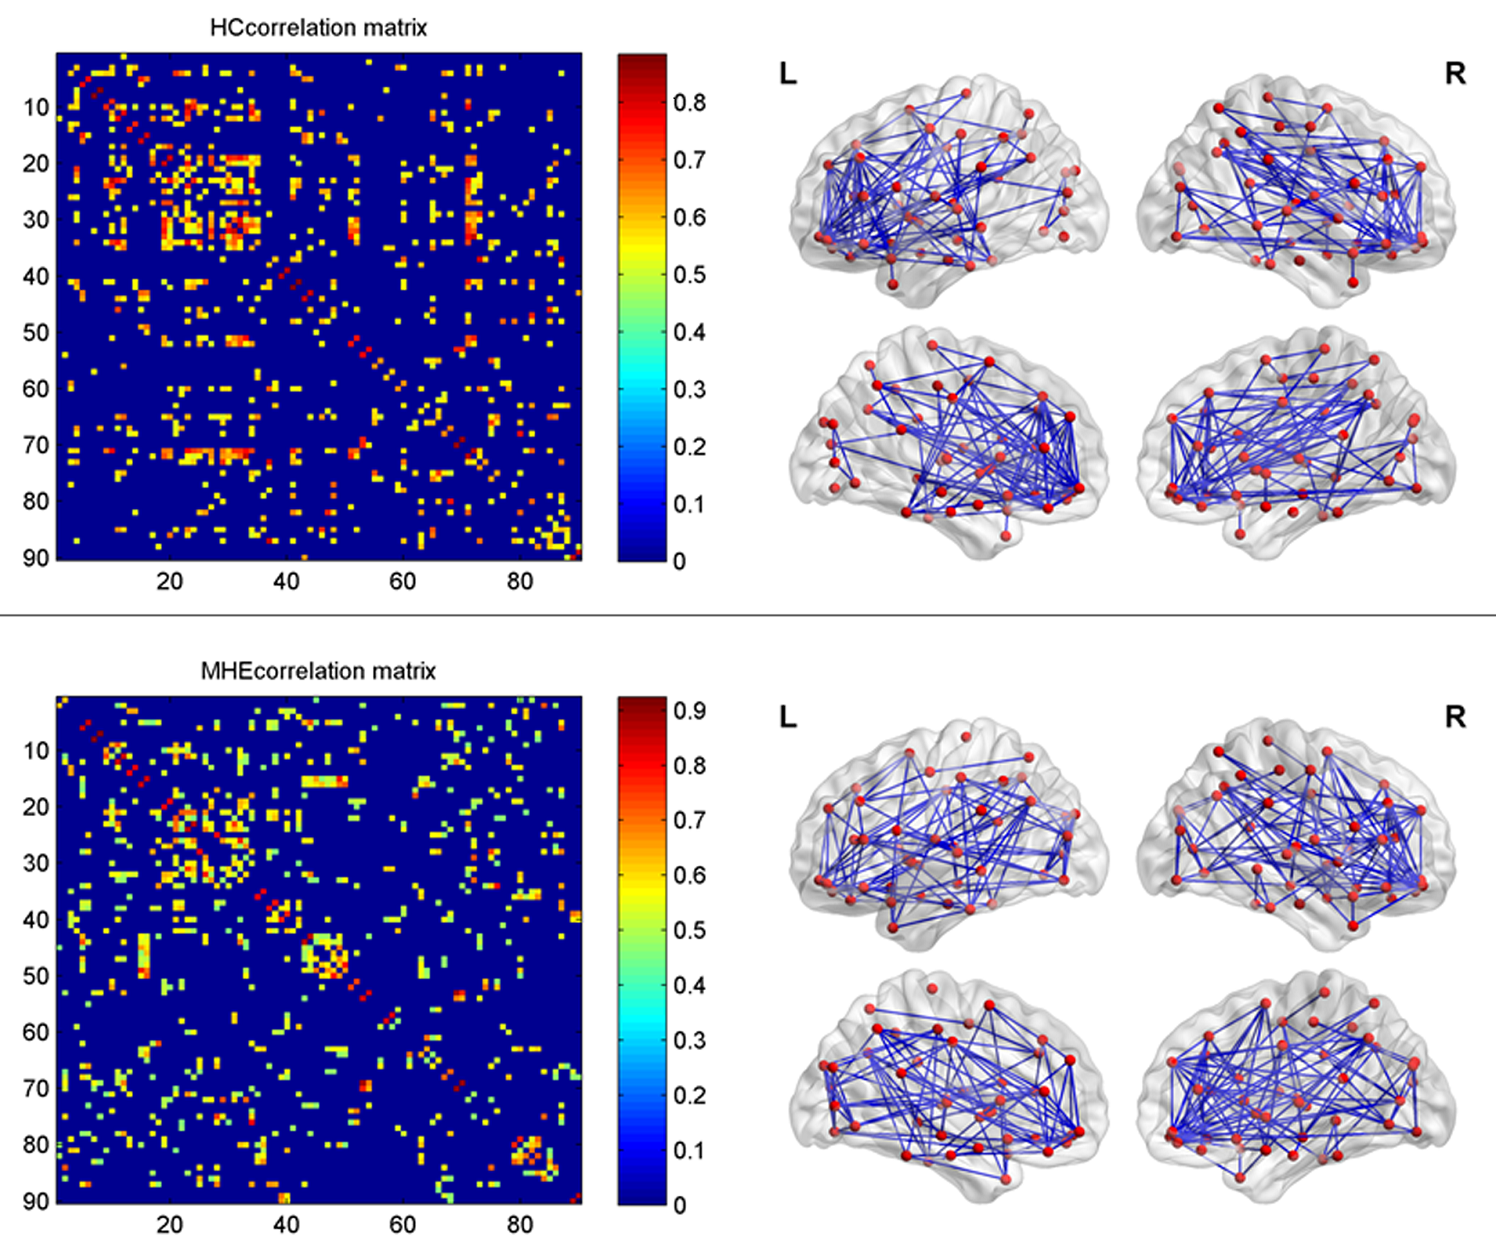
MRI scanning was performed using a MAGNETOM Prisma 3.0T scanner (Siemens Healthcare, Erlangen, Germany) with a 64-channel head coil. Twenty-two cirrhotic patients with MHE and 22 healthy controls (HCs) underwent high-resolution T1-weighted imaging. We calculated the gray matter volume of 90 brain regions using an automated anatomical labeling (AAL) template, followed by construction of gray matter structural covariance networks by thresholding interregional structural correlation matrices as well as graph theoretical analysis.Results
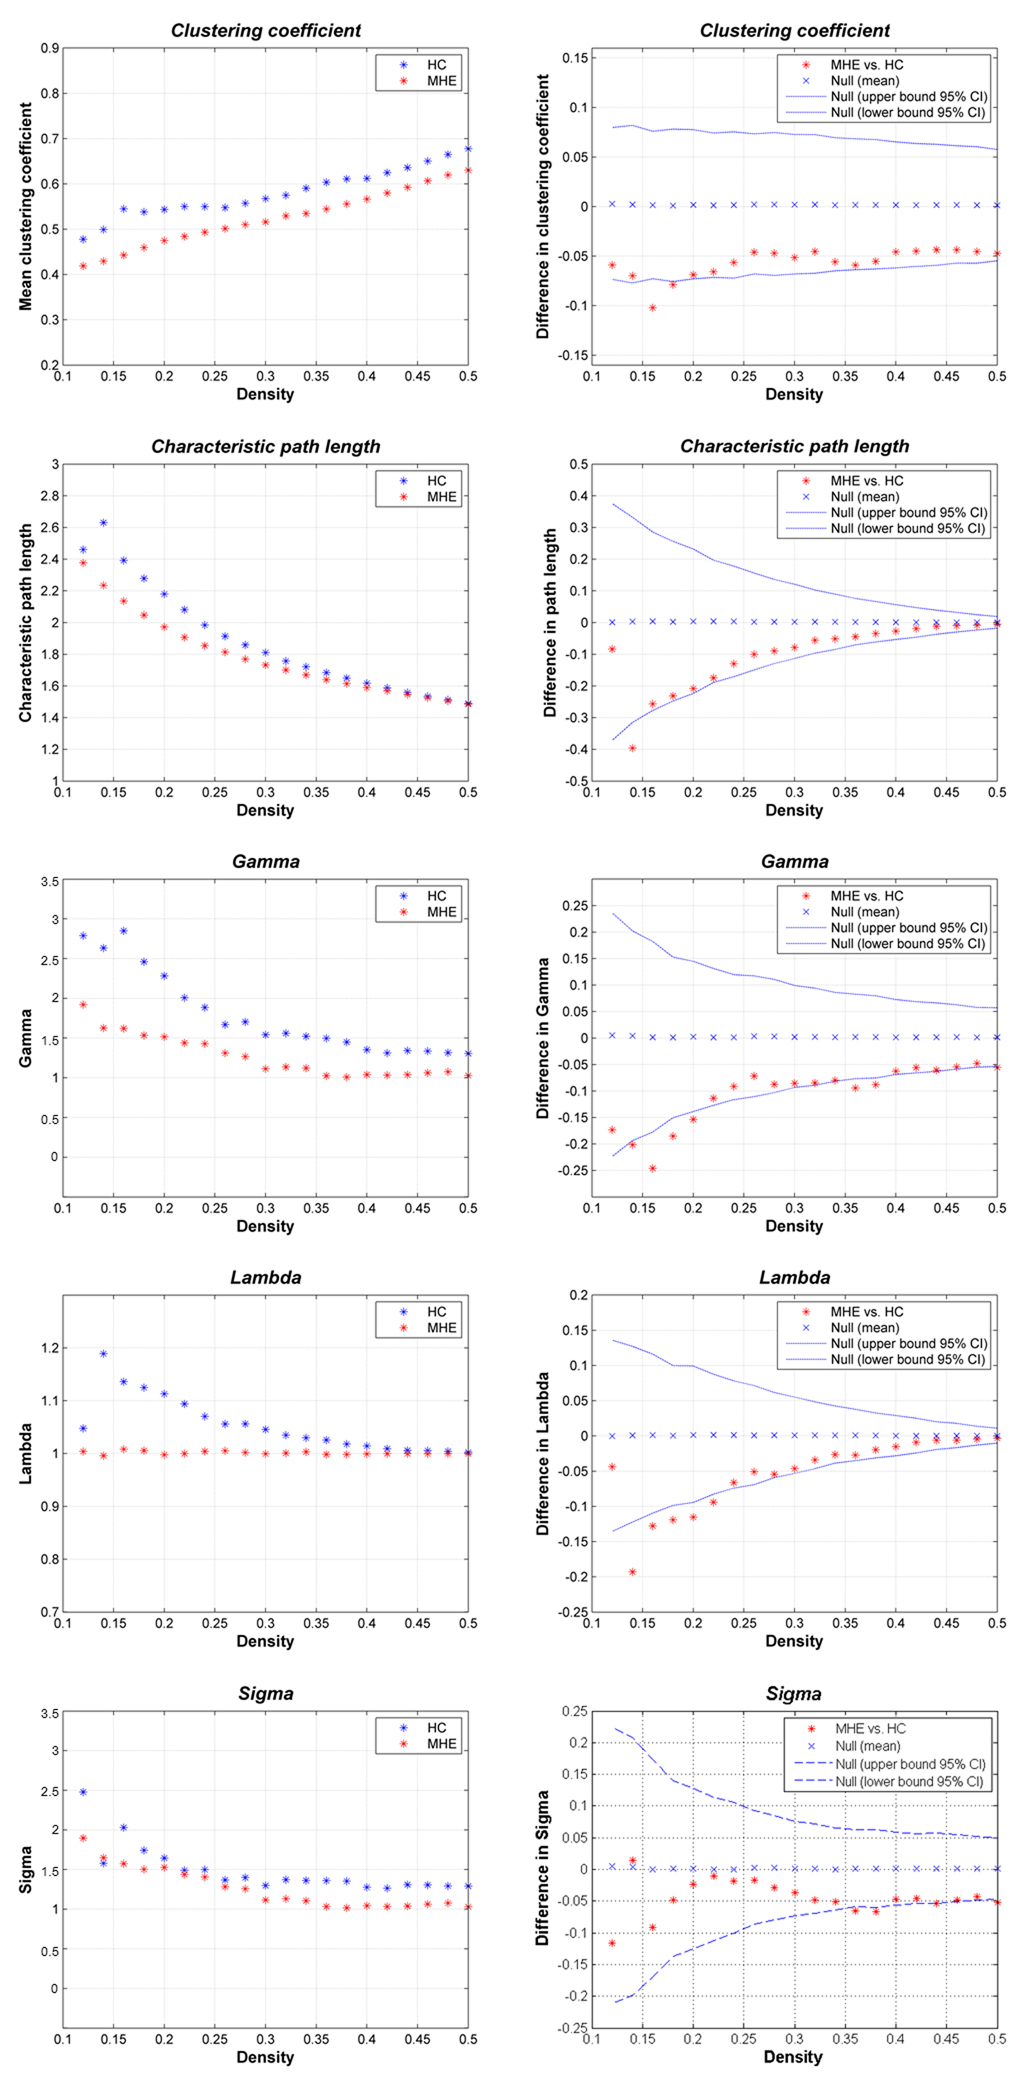
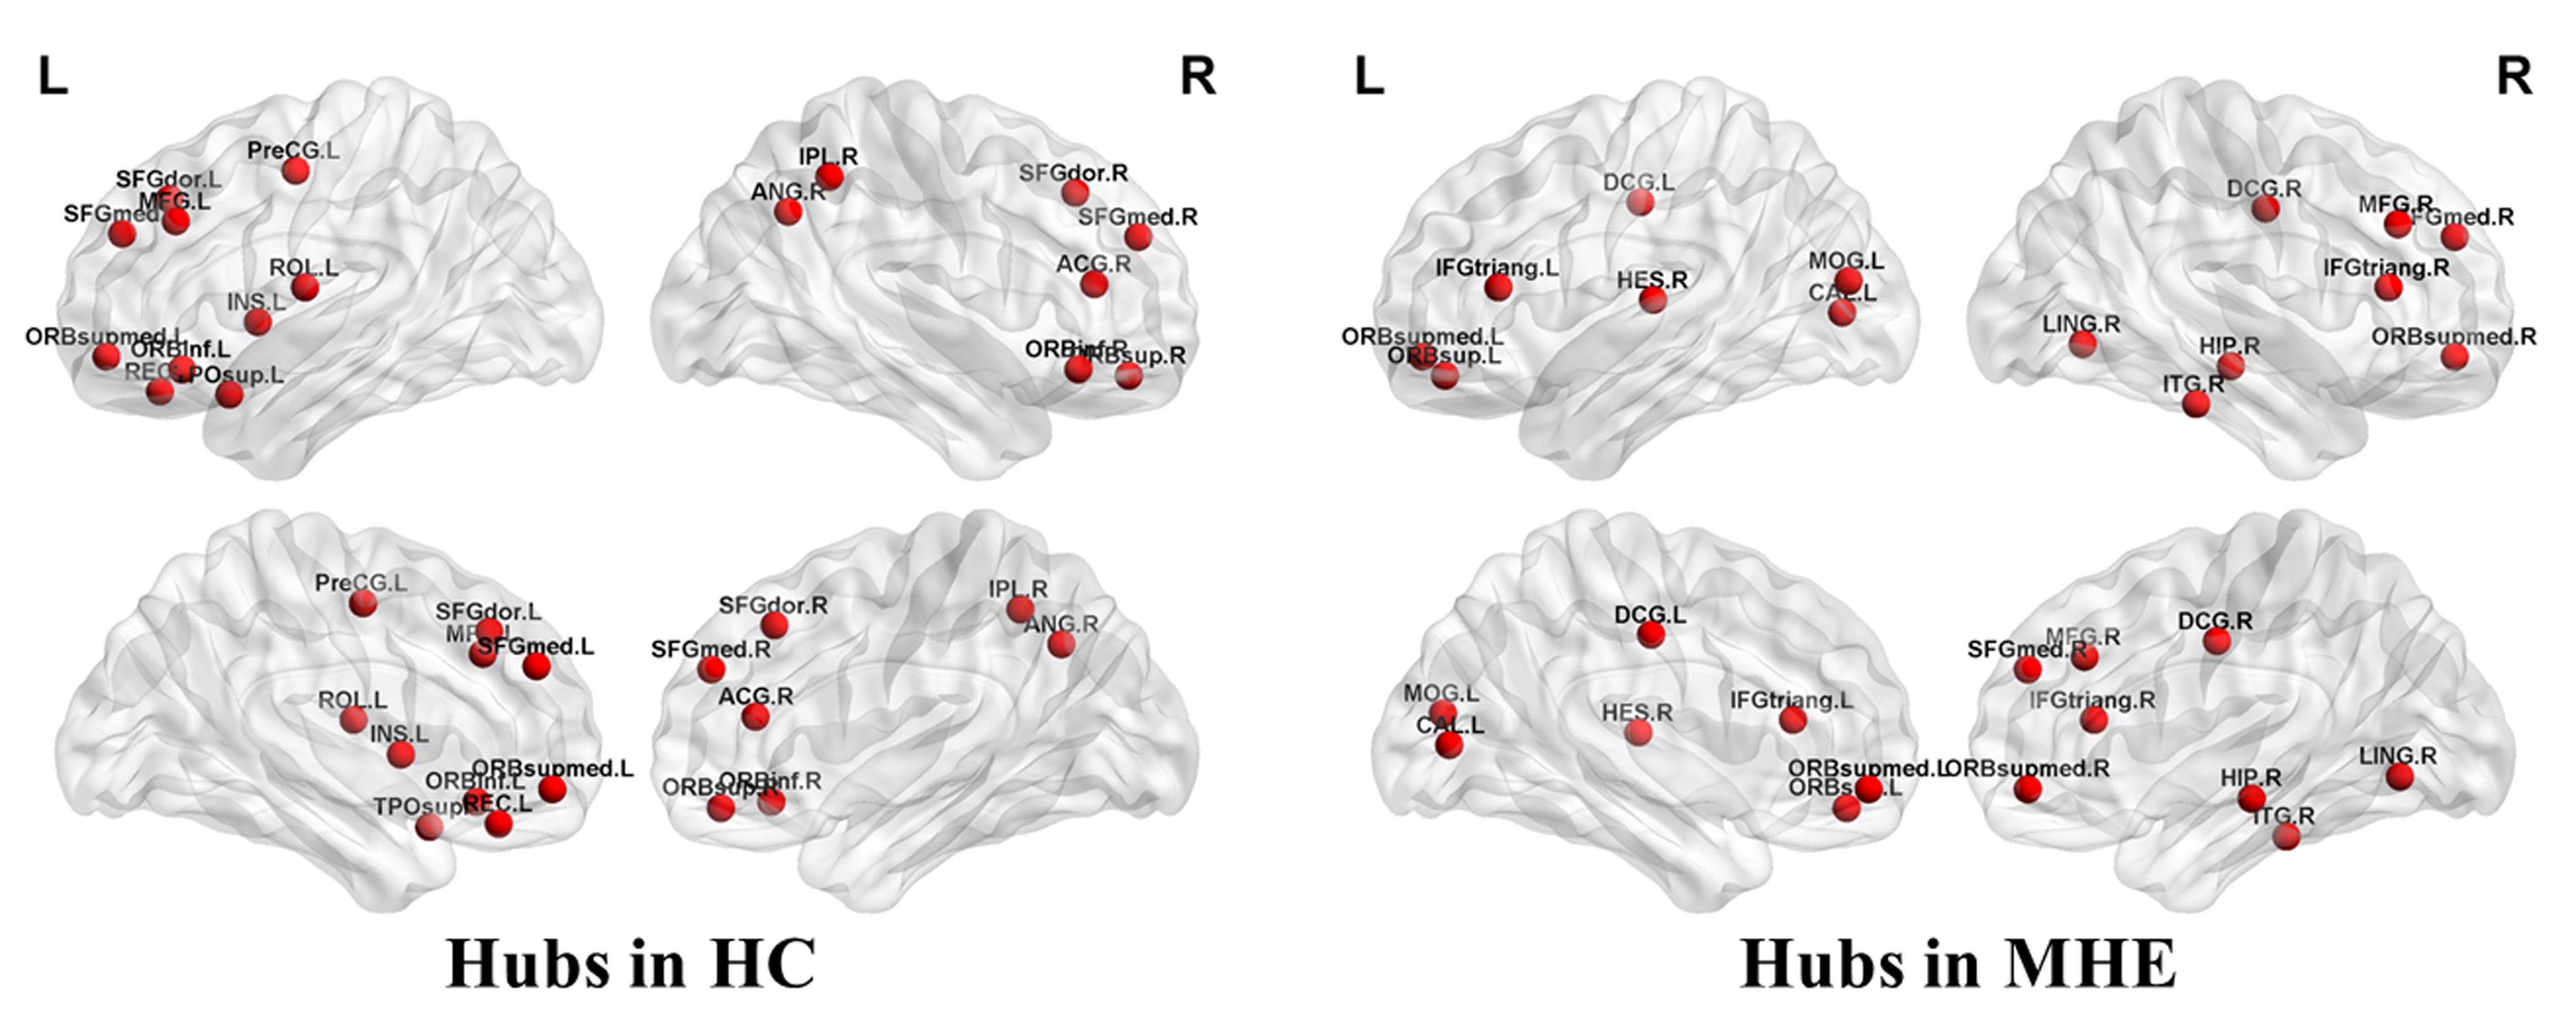
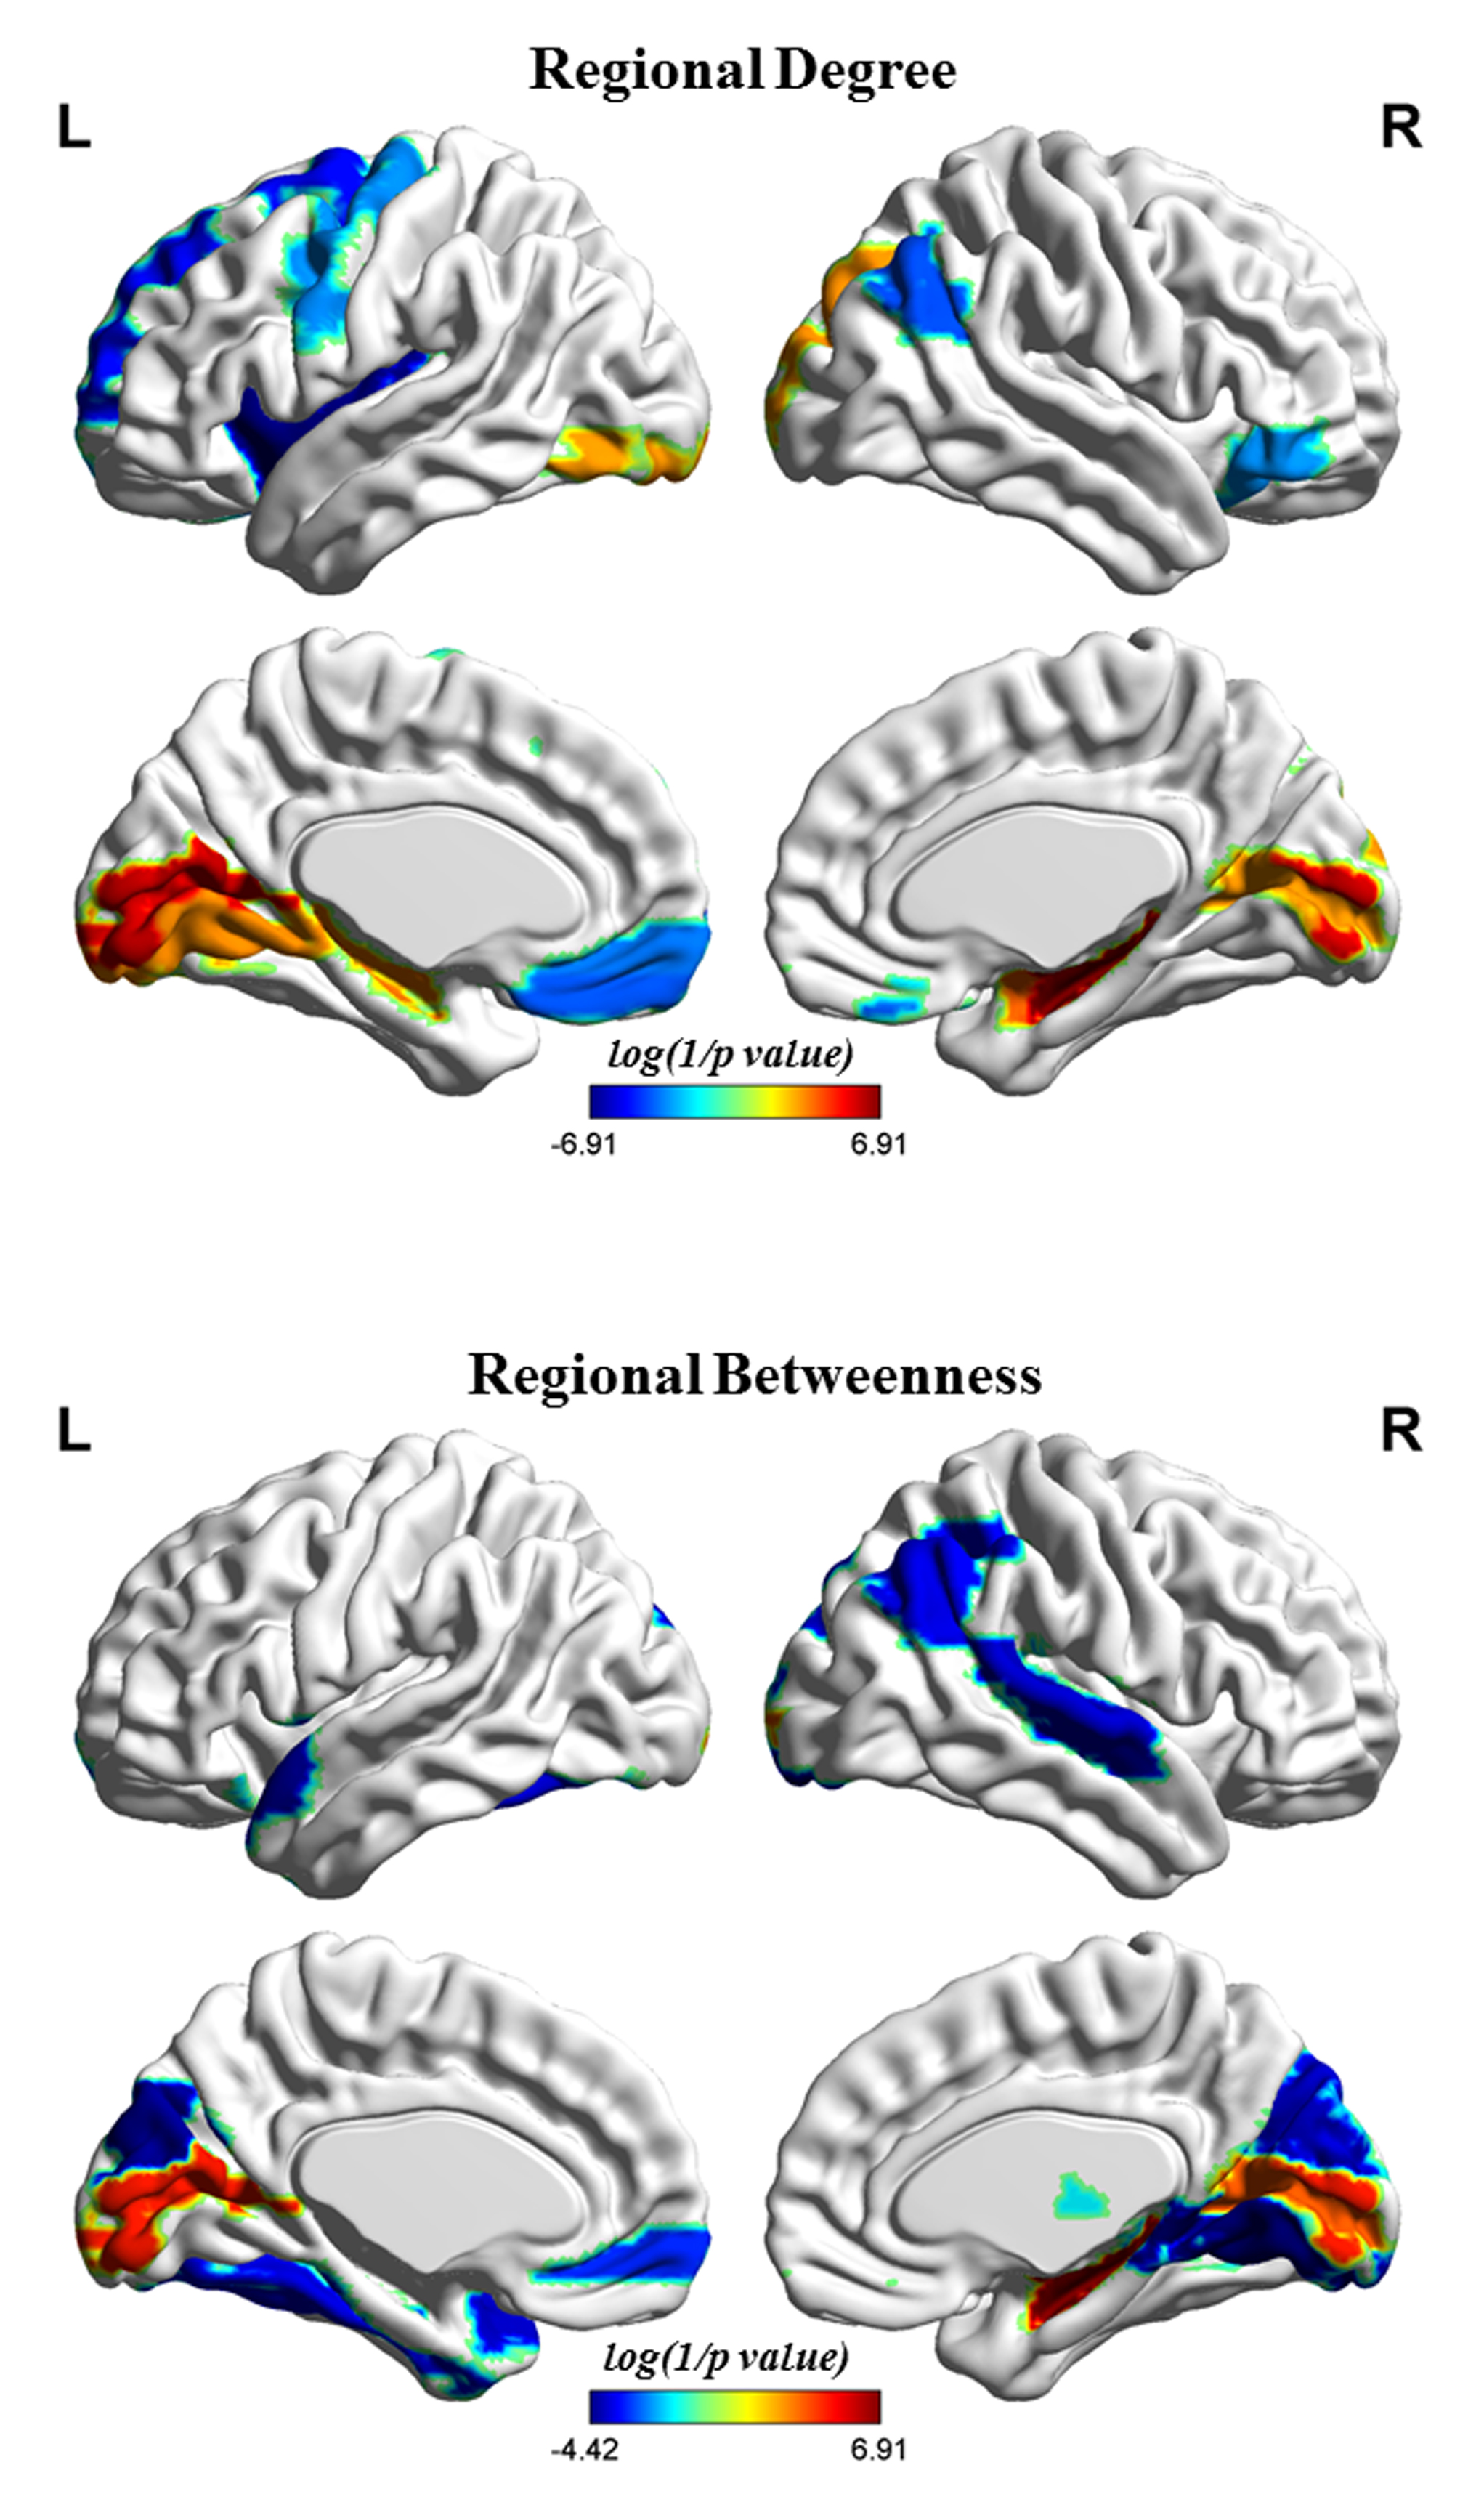
MHE patients showed abnormal small-world properties of the brain structural covariance network, i.e., decreased clustering coefficient and characteristic path length and lower small-worldness parameters, which indicated a tendency toward more random architecture. In addition, MHE patients lost hubs in the prefrontal and parietal regions, although they had new hubs in the temporal and occipital regions. Compared toHC, MHE patients had decreased regional degree/betweenness involving several regions, primarily the prefrontal and parietal lobes, motor region, insula, and thalamus.In addition, the MHE group also showed increased degree/betweenness in the occipital lobe and hippocampus.Conclusion
These results suggest that MHE leads to altered coordination patterns of gray matter morphology and provide structural evidence supporting the idea that MHE is a neurological complication related to disrupted neural networks.Acknowledgements
This study was funded by the grants from the National Natural Science Foundation of China (No.81501450), Fujian Provincial Science Fund for Distinguished Young Scholars (No. 2018J06023), Fujian Provincial Program for Distinguished Young Scholars (No.2017B023), and Fujian Provincial Health Commission Project for Scientific Research Talents (2018-ZQN-28).References
1.Stewart CA, Smith GE. Minimal hepatic encephalopathy. Nat Clin PractGastroenterol Hepatol 2007; 4:677-685
2.He Y, Chen ZJ, Evans AC. Small-world anatomical networks in the human brainrevealed by cortical thickness from MRI. Cereb Cortex 2007; 17:2407-2419
3.Wu K, Taki Y, Sato K, et al. Age-related changes in topological organization ofstructural brain networks in healthy individuals. Hum Brain Mapp 2012; 33:552-568
4.Watts DJ, Strogatz SH. Collective dynamics of 'small-world' networks. Nature1998; 393:440-442
5.Zhu W, Wen W, He Y, et al. Changing topological patterns in normal aging usinglarge-scale structural networks. Neurobiol Aging 2012; 33:899-913
6.Chen HJ, Jiang LF, Sun T, et al. Resting-state functional connectivity abnormalitiescorrelate with psychometric hepatic encephalopathy score in cirrhosis. Eur J Radiol2015
7.Hosseini SM, Hoeft F, Kesler SR. GAT: a graph-theoretical analysis toolbox foranalyzing between-group differences in large-scale structural and functional brainnetworks. PLoS One 2012; 7:e40709
8.van den Heuvel MP, Mandl RC, Kahn RS, et al. Functionally linked resting-statenetworks reflect the underlying structural connectivity architecture of the human brain.Hum Brain Mapp 2009; 30:3127-3141
9.Damoiseaux JS, Greicius MD. Greater than the sum of its parts: a review of studiescombining structural connectivity and resting-state functional connectivity. BrainStruct Funct 2009; 213:525-533
Figures