2783
Detection of accumulated iron and microglia in the striatum of Huntington’s Disease patients: evidence from post-mortem MRI and histology1Radiology, LUMC, Leiden, Netherlands, 2Pathology, LUMC, Leiden, Netherlands, 3Neurology, Ulm University Hospital, Ulm, Germany, 4Human Genetics, LUMC, Leiden, Netherlands
Synopsis
We detected increased iron deposits in the striatum of post-mortem brain tissue of Huntington’s Disease (HD) patients. High-field T2*-weighted MRI of the striatum showed a different imaging phenotype in HD patients compared to controls, and spatially correlated with the iron distribution obtained from histology. Increased iron was observed in the matrix and in cells morphologically resembling glial cells. These findings bridge the gap between neuropathological and clinical imaging findings and point to iron accumulation as a potential imaging biomarker for disease progression in vivo, possibly reflecting neuroinflammation.
Introduction
T2*-weighted MRI and quantitative susceptibility mapping (QSM) in Huntington’s Disease (HD) patients showed iron accumulation in the striatum correlated with disease state1,2. Iron accumulation is a common feature of many neurodegenerative diseases, often as the result of iron uptake by activated microglia, the resident macrophages of the brain3,4. It is thought that cerebral iron-accumulation mapped by MRI reflects the presence of activated microglia.
Although previous studies showed the usefulness of iron-sensitive MRI scans in detecting iron accumulation in HD patients and its potential as a biomarker for disease progression, the underlying pathological substrates have never been investigated.
Here we investigated the correlation between 7T MRI and histopathology in the striatum of HD patients to further investigate the link between iron, microglia and MRI contrast and their association with disease severity.
Methods
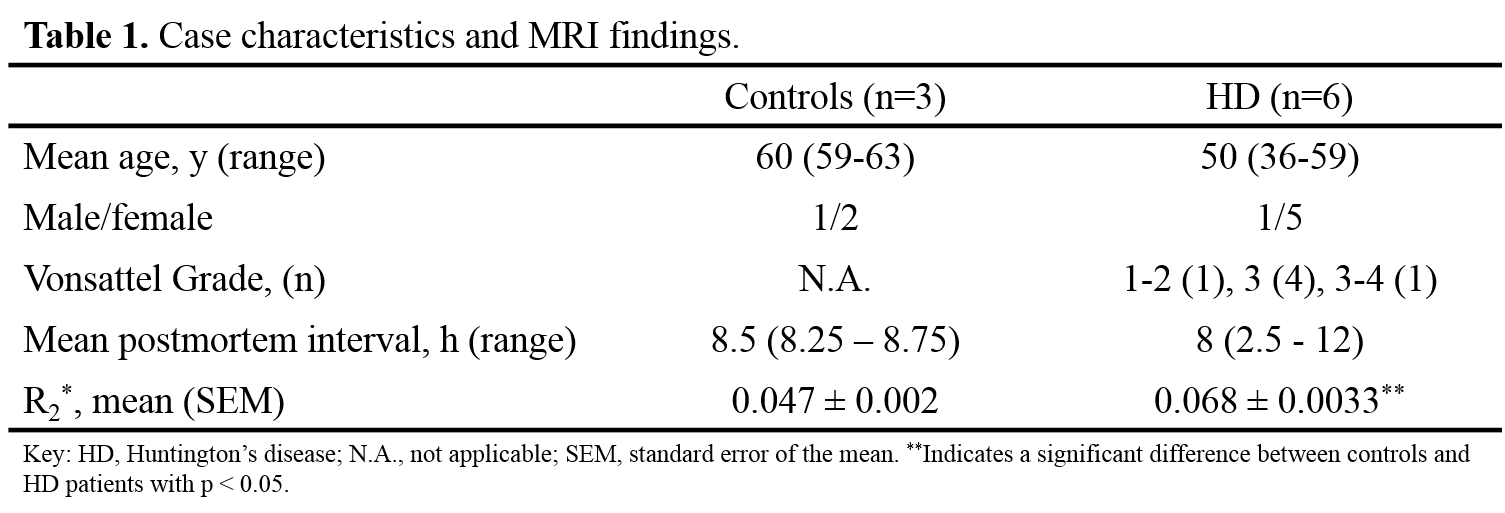
Formalin-fixed brain material, one whole HD brain and coronal brain slabs including the striatum of HD patients (N=6) and controls (N=3), were obtained respectively from Ulm University Hospital, the local neuropathology tissue collection, and the Normal Ageing Brain Collection Amsterdam (Table 1). The whole brain and brain slabs were scanned on a whole body human 7T MR system (Philips Healthcare, the Netherlands) using a quadrature transmit and 32-channel receiver head coil. A multi-echo T2*-weighted MRI scan was acquired using the following parameters: TR=200ms, TE=7,14,21,28ms, 300µm isotropic resolution. Smaller tissue blocks including the caudate nucleus and putamen were resected and scanned at ultra-high resolution on a 7T Bruker system (Bruker Biospin, Germany) using a MGE sequence (TR = 75.0ms, TE = 12.5,16.8,21.2,25.5ms, 100µm isotropic resolution). R2*-maps were calculated using an in-house written Matlab pipeline. The same tissue blocks as used for MRI were used for iron histochemistry (Meguro staining).Results
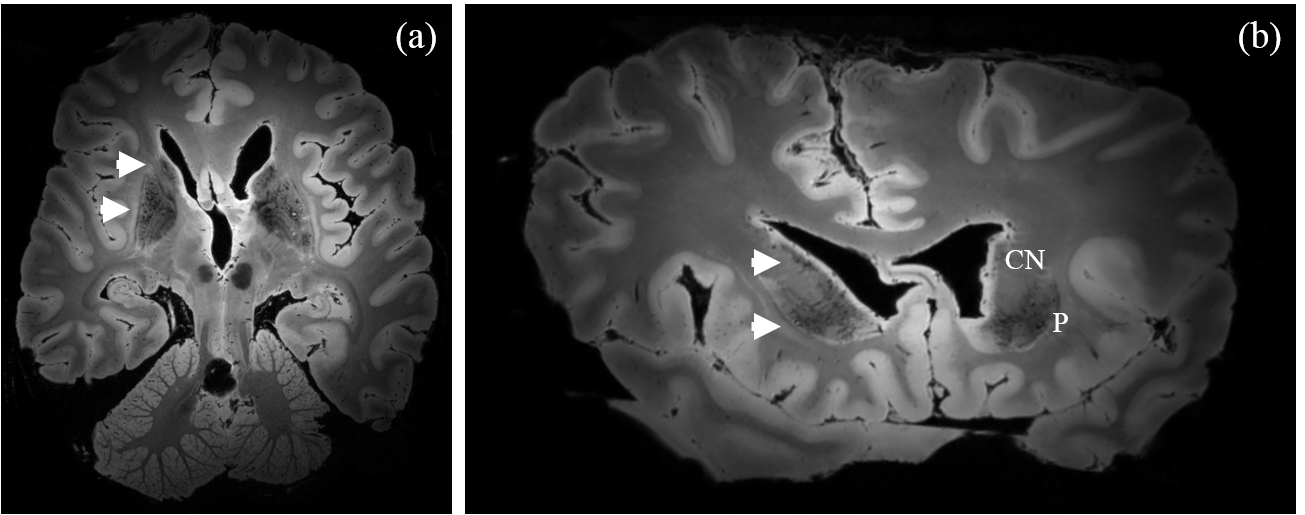
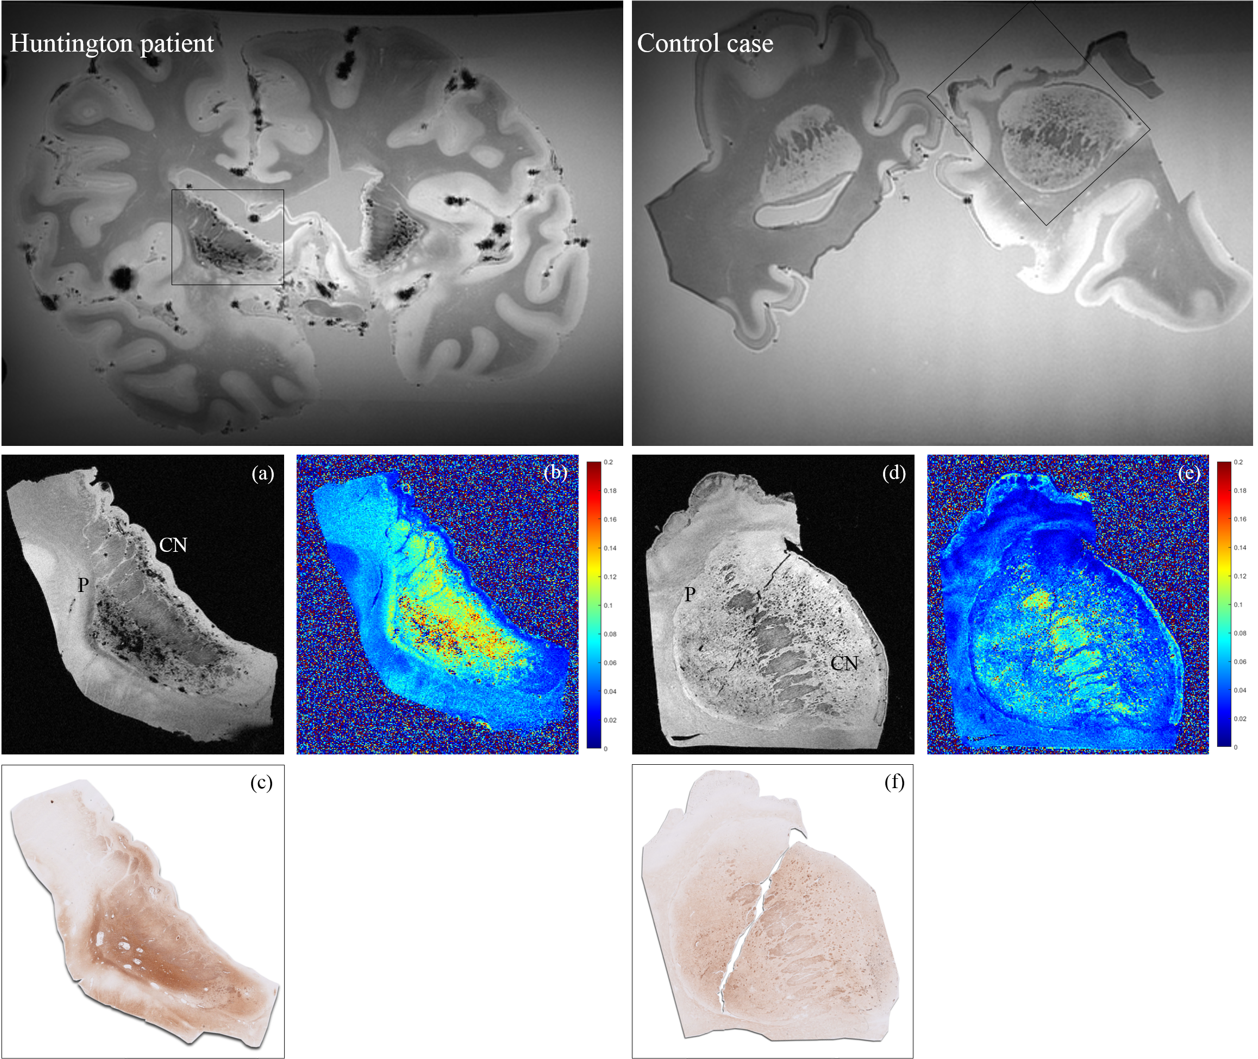
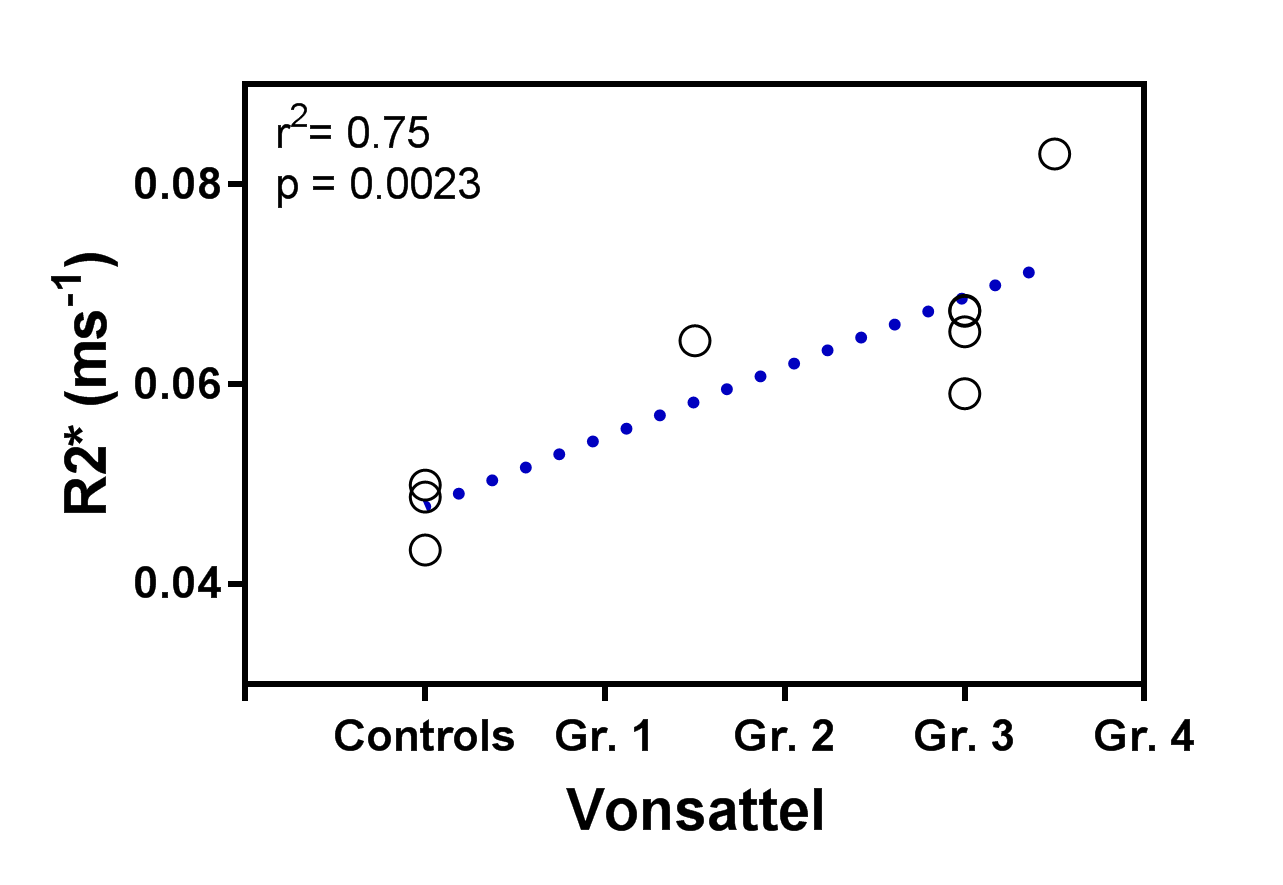
The T2*-weighted images of controls showed lowest signal amplitude in the myelin-rich areas of the white matter, followed by the striatum. Additionally, large focal hypo intensities were observed in the striatum of HD patients (Fig. 1 and 2a), but not in controls (Fig. 2d). R2*-maps of the smaller tissue blocks showed significantly increased R2*-values of the striatum in HD patients compared to controls (Table 1 and Fig. 2b,e). Moreover, R2*-values significantly correlated with neuropathological disease severity as defined by the Vonsattel grade (Fig. 3).
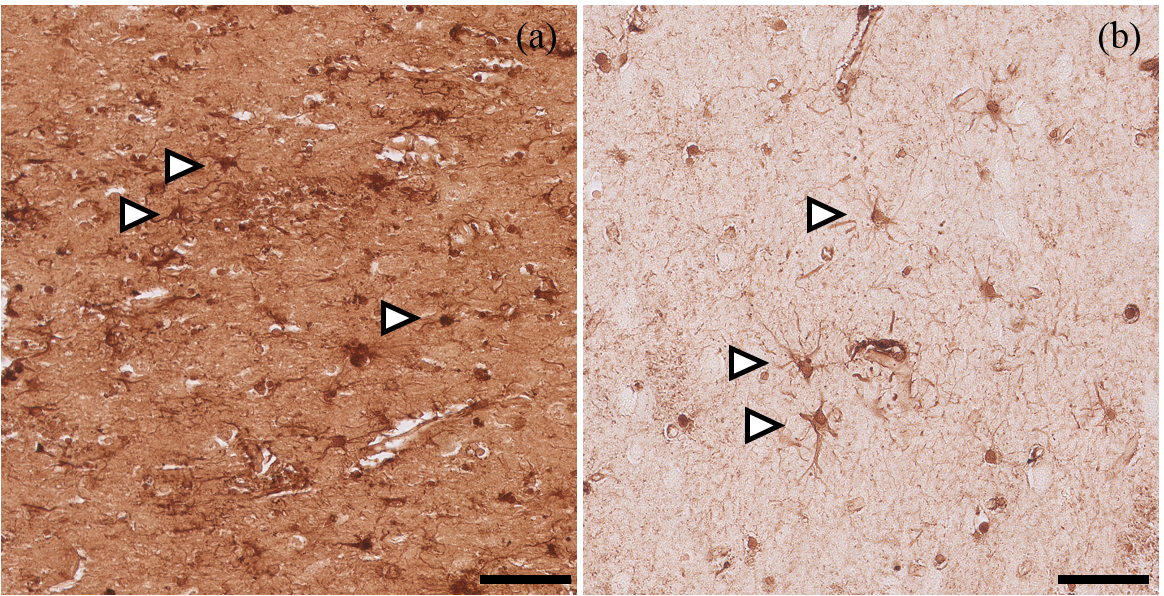
Samples of 4 HD patients and 2 controls were subjected to histopathological analysis. Striatal hypointense regions on MRI colocalized macroscopically with increased iron staining intensity in both controls and HD patients (Fig. 2c,f). Microscopic analysis of these regions showed an increase of iron in regions which most likely represented the matrix component of the striatum and in cells which morphologically closely resemble glial cells (Fig. 4, arrows). Specifically in controls, the microglial-like positive stainings had the appearance of densely packed cells with long, thin processes (Fig. 4b). In contrast, in HD patients these cells have fewer, thicker, more twisted processes (Fig. 4a).
Discussion
This study confirms iron depositions in the striatum of HD patients as the underlying source of the observed 7T MRI contrast changes. Increased iron in the matrix and microglial-like cells most likely explains the abnormal striatal contrast on T2*-weighted MRI, as well as increased R2*-values. Currently, we are quantifying the susceptibility changes using QSM.
We hypothesized that iron accumulation mapped by MRI is mostly explained by iron-accumulating microglia in the striatum. To confirm iron accumulation in microglia further histological analyses will be done in an extended number of species to which we have access (25 HD patients and 10 controls) including specific markers to discriminate between microglia (TMEM1195), microglia activation states, and astrocytes (GFAP). However, the current data already show that iron is generally increased in the matrix, not just in glial cells. As the two major neurochemical compartments of the striatum, the striosomes and matrix, are known to be involved in HD pathology6,7 we will investigate iron accumulation in these compartments using specific histological markers (enkephalin and calbindin7).
Conclusion
We have shown that by using high-field MRI we can clearly distinguish HD patients from controls. The differences in imaging phenotype are mirrored in the histopathology, mostly in differences in iron. Clinically, the role of iron accumulation is increasingly recognized and shown to be a potential imaging biomarker for disease progression, possibly reflecting neuroinflammation known to be related to disease progression. The advent of new therapeutic strategies for HD highlights the necessity of a sensitive imaging biomarker for disease progression and treatment response. Finally, the results provide insight to the role of iron and neuroinflammation in HD pathogenesis, and susceptibility-based MRI methods could play an important role for further mechanistic studies.Acknowledgements
No acknowledgement found.References
1. van Bergen JM, Hua J, Unschuld PG, Lim IA, Jones CK, Margolis RL, et al. Quantitative susceptibility mapping suggests altered brain iron in premanifest huntington disease. AJNR Am J Neuroradiol. 2016;37:789-796
2. Dominguez JF, Ng AC, Poudel G, Stout JC, Churchyard A, Chua P, et al. Iron accumulation in the basal ganglia in huntington's disease: Cross-sectional data from the image-hd study. J Neurol Neurosurg Psychiatry. 2016;87:545-549
3. Meadowcroft MD, Connor JR, Yang QX. Cortical iron regulation and inflammatory response in alzheimer's disease and appswe/ps1deltae9 mice: A histological perspective. Front Neurosci. 2015;9:255 4. Thomsen MS, Andersen MV, Christoffersen PR, Jensen MD, Lichota J, Moos T. Neurodegeneration with inflammation is accompanied by accumulation of iron and ferritin in microglia and neurons. Neurobiol Dis. 2015;81:108-118
5. Satoh J, Kino Y, Asahina N, Takitani M, Miyoshi J, Ishida T, et al. Tmem119 marks a subset of microglia in the human brain. Neuropathology. 2016;36:39-49
6. Waldvogel HJ, Kim EH, Tippett LJ, Vonsattel JP, Faull RL. The neuropathology of huntington's disease. Curr Top Behav Neurosci. 2015;22:33-80
7. Tippett LJ, Waldvogel HJ, Thomas SJ, Hogg VM, van Roon-Mom W, Synek BJ, et al. Striosomes and mood dysfunction in huntington's disease. Brain. 2007;130:206-221
Figures