2777
T2*-weighted imaging and quantitative susceptibility mapping (QSM) in patients with amyotrophic lateral sclerosis and bulbar impairment1University of Pisa, Pisa, Italy, 2Imago7, Pisa, Italy, 3Azienda Ospadaliero-Universitaria Pisana, Pisa, Italy, 4Imago7 and IRCCS Stella Maris, Pisa, Italy
Synopsis
The T2* hypointensity of the primary motor cortex (M1), associated to an increase in iron deposits related to neuroinflammatory reaction and cortical microgliosis, has been suggested as possible MRI marker of upper motor neuron impairment in patients with amyotrophic lateral sclerosis (ALS). This study investigates the orofacial subregion of M1 (fM1) in 36 patients with ALS. The evaluation of T2* signal hypointensity and quantitative susceptibility mapping (QSM) values in fM1 were related to patients’ bulbar functions (such as speech and swallowing) assessed clinically. Results demonstrate that QSM values were significantly higher in patients with bulbar dysfunction than in those without (p≤0.0001).
Introduction
The T2* hypointensity of the primary motor cortex (M1), associated to an increase in iron deposits related to neuroinflammatory reaction and cortical microgliosis, has been suggested as a possible MRI marker of upper motor neuron (UMN) impairment in patients with amyotrophic lateral sclerosis (ALS). The M1 in ALS patients has largely been studied as a whole, and only a small number of studies have focused on specific M1 subregions representing the limbs. At present no studies have purposely assessed, at a single subject level, the pathological sign of T2* hypointensity in the orofacial subregion of M1 (fM1), where the bulbar functions such as speech and swallowing are represented. Here, with the aim of paving the way for finding an MRI marker of UMN impairment responsible for bulbar dysfunction in ALS patients, we assessed the signal intensity of fM1 using 3D multi-echo T2*-weighted sequences at 3T, and investigated the relationship among fM1 signal hypointensity, quantitative susceptibility mapping (QSM) and clinically-assessed bulbar impairment.Methods
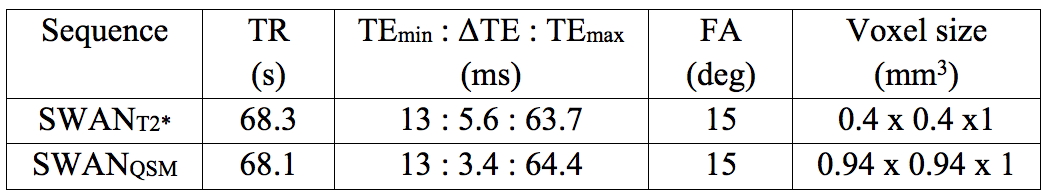
36 patients with ALS were included in this study, that is, all patients who underwent an MR examination between December 2013 and December 2017 at Pisa University Hospital, with a definite diagnosis of ALS1 and no concomitant neurodegenerative or psychiatric disorders, and whose scanning protocol (performed on a GE MR750 3T system) included the following two gradient-multi-echo (SWAN) acquisitions: one optimized for high-resolution T2*-weighted imaging (SWANT2*) and one tailored to produce quantitative susceptibility maps (SWANQSM). Both sequences were prescribed axially. SWANT2* targeted the motor cortex, while SWANQSM covered the brain from the vertex to the ponto-bulbar junction. Acquisition parameters are shown in Figure 1.
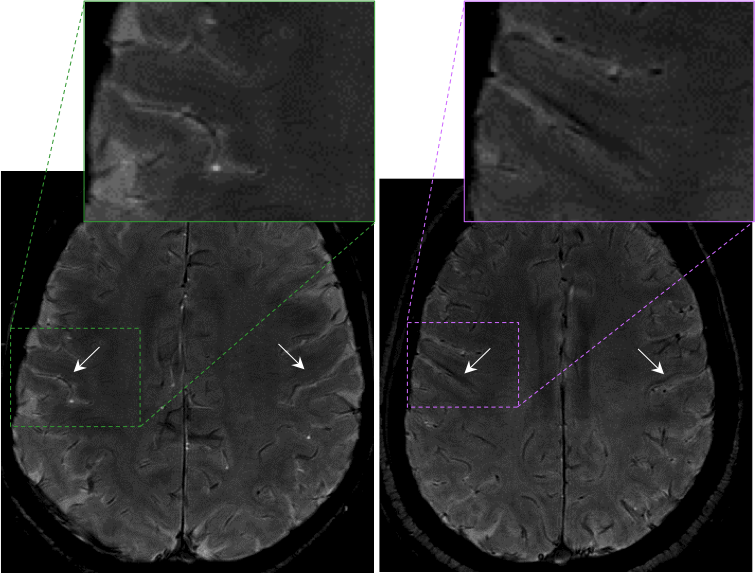
Two neuroradiologists, blinded to the clinical features of patients, evaluated fM1 (defined on the basis of anatomical and radiological landmarks as the region of the primary motor cortex located ventrally to the hand knob, functionally connected with the bulbar muscles2,3. The T2* signal of fM1 in SWANT2*, independently for each hemisphere, was graded=1 if, compared to that of the postcentral cortex, was markedly hypointense, while it was graded=0 otherwise, as shown in the examples in Figure 2.
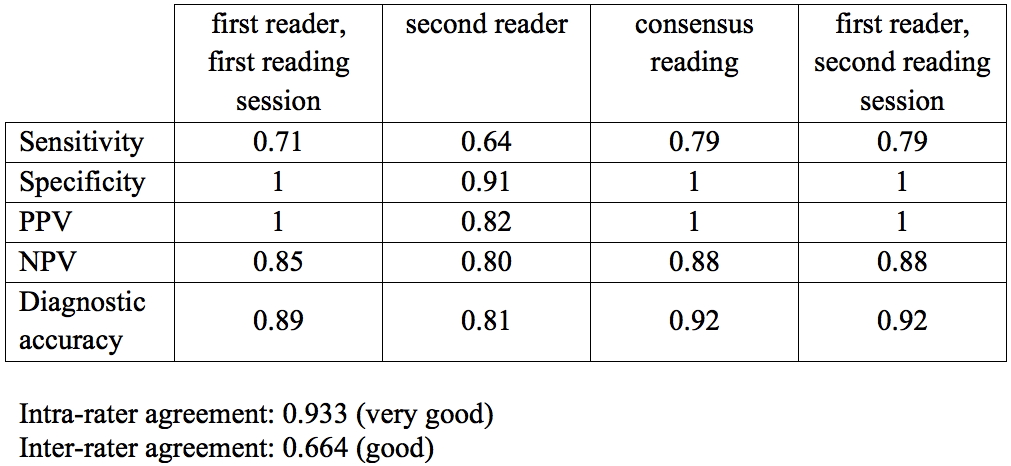
The magnitude and phase of the SWANQSM data underwent a well-established post-processing pipeline that included Laplacian-based phase unwrapping4 and background phase removal5. Values of magnetic susceptibility χ were obtained from the processed phase data6 by using the iLSQR algorithm7. Regions of interest (ROIs) were manually drawn in fM1 to delineate in the χ maps the regions corresponding to either T2* hypointensity (where present) or the deep layers8 of a putative segment of fM1 if no signal changes were visible. The mean magnetic susceptibility in each ROI was recorded. For all patients, signs and symptoms of bulbar impairment were evaluated at the time of the MR exam using the items 1-3 of the ALS Functional Rating Scale regarding speech, salivation and swallowing9 (ALSFRS-R bulbar score, range 0-12, with lower scores reflecting greater disability). The ALSFRS-R bulbar score was used as the gold standard to identify subjects with bulbar functional impairment. Sensitivity, specificity, positive predictive value (PPV), negative predictive value (NPV) and diagnostic accuracy of the MR imaging were computed for each reader and reading session, and for the consensus reading. The inter-observer and intra-observer agreement for the qualitative image analysis were calculated with the Cohen’s kappa coefficient.
Results
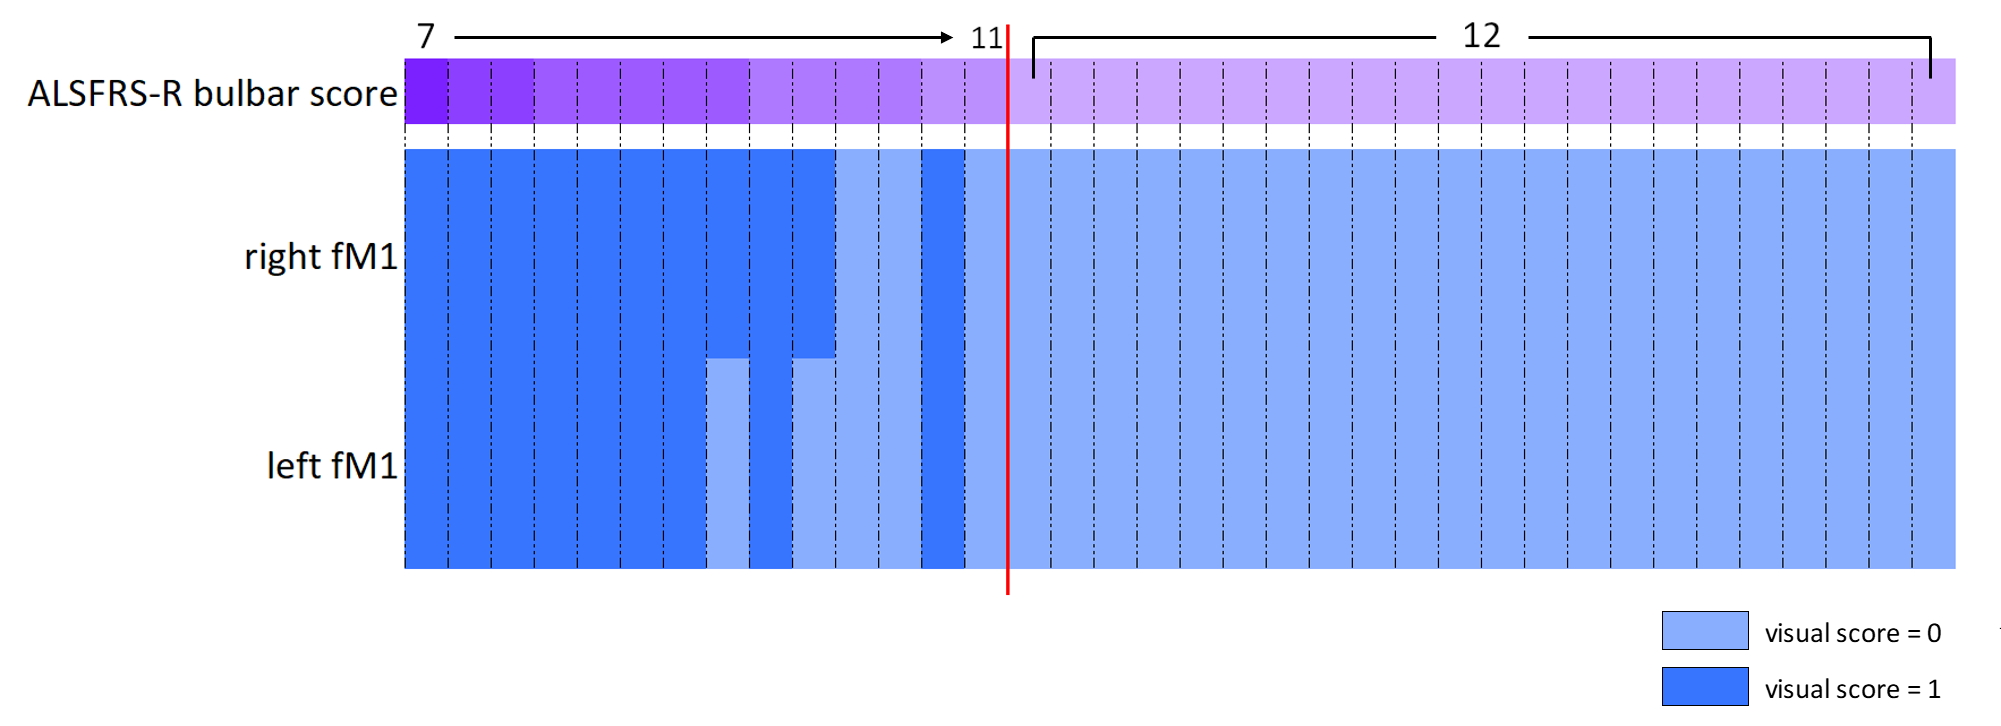
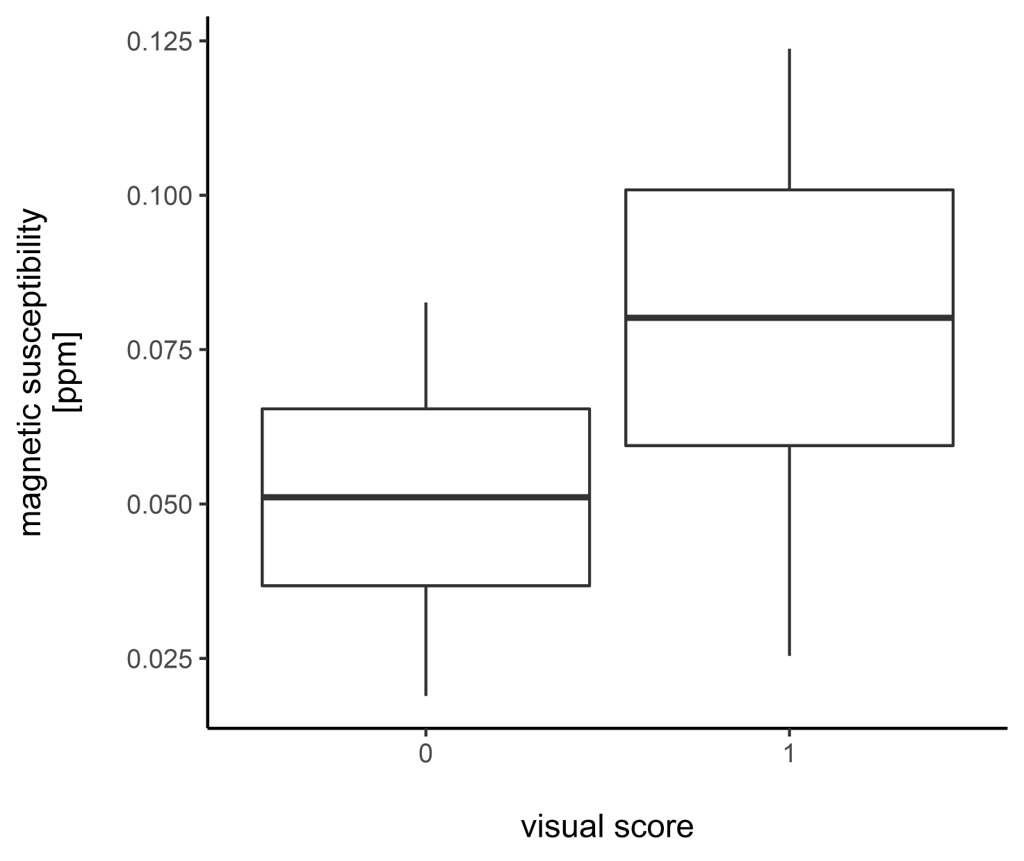
The relationship between bulbar impairment and hypointensity scores for the right and left fM1 of all subjects is shown in Figure 3. The magnetic susceptibility was significantly different (p<0.0001) in the fM1 with different visual scores (Figure 4; χ=0.051±0.014ppm for ROIs with score=0; χ=0.080±0.021ppm for ROIs with score=1). The sensitivity, specificity, PPV, NPV and diagnostic accuracy of the marked fM1 signal hypoinensity in identifying bulbar impairment are shown in Figure 5.
Conclusion
By using 3T MRI, T2* hypointensity can be observed in the orofacial region of the M1 of ALS patients. The relationship between these findings and the patients’ clinical data suggests that such imaging feature, which reflects a statistically significant increase in local magnetic susceptibility, could be a marker of UMN degeneration responsible for the impairment of voluntary bulbar motor functions.Acknowledgements
No acknowledgement found.References
1. Brooks, B. R., Miller, R. G., Swash, M., Munsat, T. L.World Federation of Neurology Research Group on Motor Neuron Diseases. El Escorial revisited: revised criteria for the diagnosis of amyotrophic lateral sclerosis. in 1, 293–299 (2000).
2. Penfield, W., Rasmussen, T. & ERICKSON, T. C. The Cerebral Cortex of Man, a Clinical Study of Localization of Function. American Journal of Physical Medicine & Rehabilitation 33, 126 (1954).
3. Yousry, T. A. et al. Localization of the motor hand area to a knob on the precentral gyrus. A new landmark. Brain 120 ( Pt 1), 141–157 (1997).
4. Schofield, M. A. & Zhu, Y. Fast phase unwrapping algorithm for interferometric applications. Opt Lett 28, 1194–1196 (2003).
5. Schweser, F., Deistung, A., Lehr, B. W. & Reichenbach, J. R. Quantitative imaging of intrinsic magnetic tissue properties using MRI signal phase: An approach to in vivo brain iron metabolism? NeuroImage 54, 2789–2807 (2011).
6. Shmueli, K. et al. Magnetic susceptibility mapping of brain tissue in vivo using MRI phase data. Magn. Reson. Med. 62, 1510–1522 (2009).
7. Li, W. et al. A method for estimating and removing streaking artifacts in quantitative susceptibility mapping. NeuroImage 108, 111–122 (2015).
8. Costagli, M. et al. Magnetic susceptibility in the deep layers of the primary motor cortex in Amyotrophic Lateral Sclerosis. Neuroimage Clin 12, 965–969 (2016).
9. Cedarbaum, J. M. et al. The ALSFRS-R: a revised ALS functional rating scale that incorporates assessments of respiratory function. BDNF ALS Study Group (Phase III). J. Neurol. Sci. 169, 13–21 (1999).
Figures