2773
T1-rho in the aging brain: results from large-scale population imaging1German Center for Neurodegenerative Diseases (DZNE), Bonn, Germany, 2Faculty of Medicine, University of Bonn, Institute for Medical Biometry, Informatics and Epidemiology (IMBIE), Bonn, Germany
Synopsis
Within the Rhineland Study we investigated and report normative brain T1-rho values and their change over age, for a large cohort of 547 participants. Investigated regions were GM, WM, deep gray matter and selected white matter tracts. All investigated regions, except amygdala and accumbens, show a positive trend with age. Total scan time was under six minutes (whole brain), showing the feasibility to provide normative values for a wide range of brain regions in a reasonable amount of time.
INTRODUCTION
T1-rho mapping is sensitive to slow macromolecular interactions. It has the potential to detect pathological changes in neurodegenerative diseases [1] or help with tumor differentiation [2]. So far there is only one study focusing on normative values [3] and to our knowledge no data on a large cohort of a few hundreds participants. Therefore within the Rhineland Study [4,5], we investigated and report normative brain T1-rho values and their changes over age for a large cohort of 547 participants.METHODS
T1-rho (1.3mm isotropic) as well as structural T1 weighted (MPRAGE 0.8mm isotropic) whole brain data was acquired for 547 participants (≥30 years, mean 54±13, 302 women, 245 men) at a 3T Siemens Prisma scanner. A whole brain T1-rho weighted fluid suppressed, three dimensional turbo spin echo sequence was used to generate a decaying time-series (TSL = 10, 30, 50, 70, 90 ms), total scan time of 5.50min, TR= 2600ms [6]. The time-series was denoised [7] and afterwards fitted voxel-wise to an exponential decay, as follows: $$S(t) = S_0·e(−TSL/T1rho)$$ to obtain T1-rho and T1-rho_error maps. For a better numerical stability, fitted voxel values exceeding 150ms were discarded in the later posterior analysis. Structural T1 images were processed using Freesurfer 6.0 [8] and registered to the T1-rho maps in order to extract the T1-rho parameters across a number of different brain regions. The anatomical regions were defined by the aseg Freesurfer atlas. For the white matter tracts, we used the JHU ICBM-DTI-81 atlas thresholded at 50% [9], which was registered to each respective T1-rho map. Average T1-rho values were linear regressed with age for the different anatomical regions.RESULTS
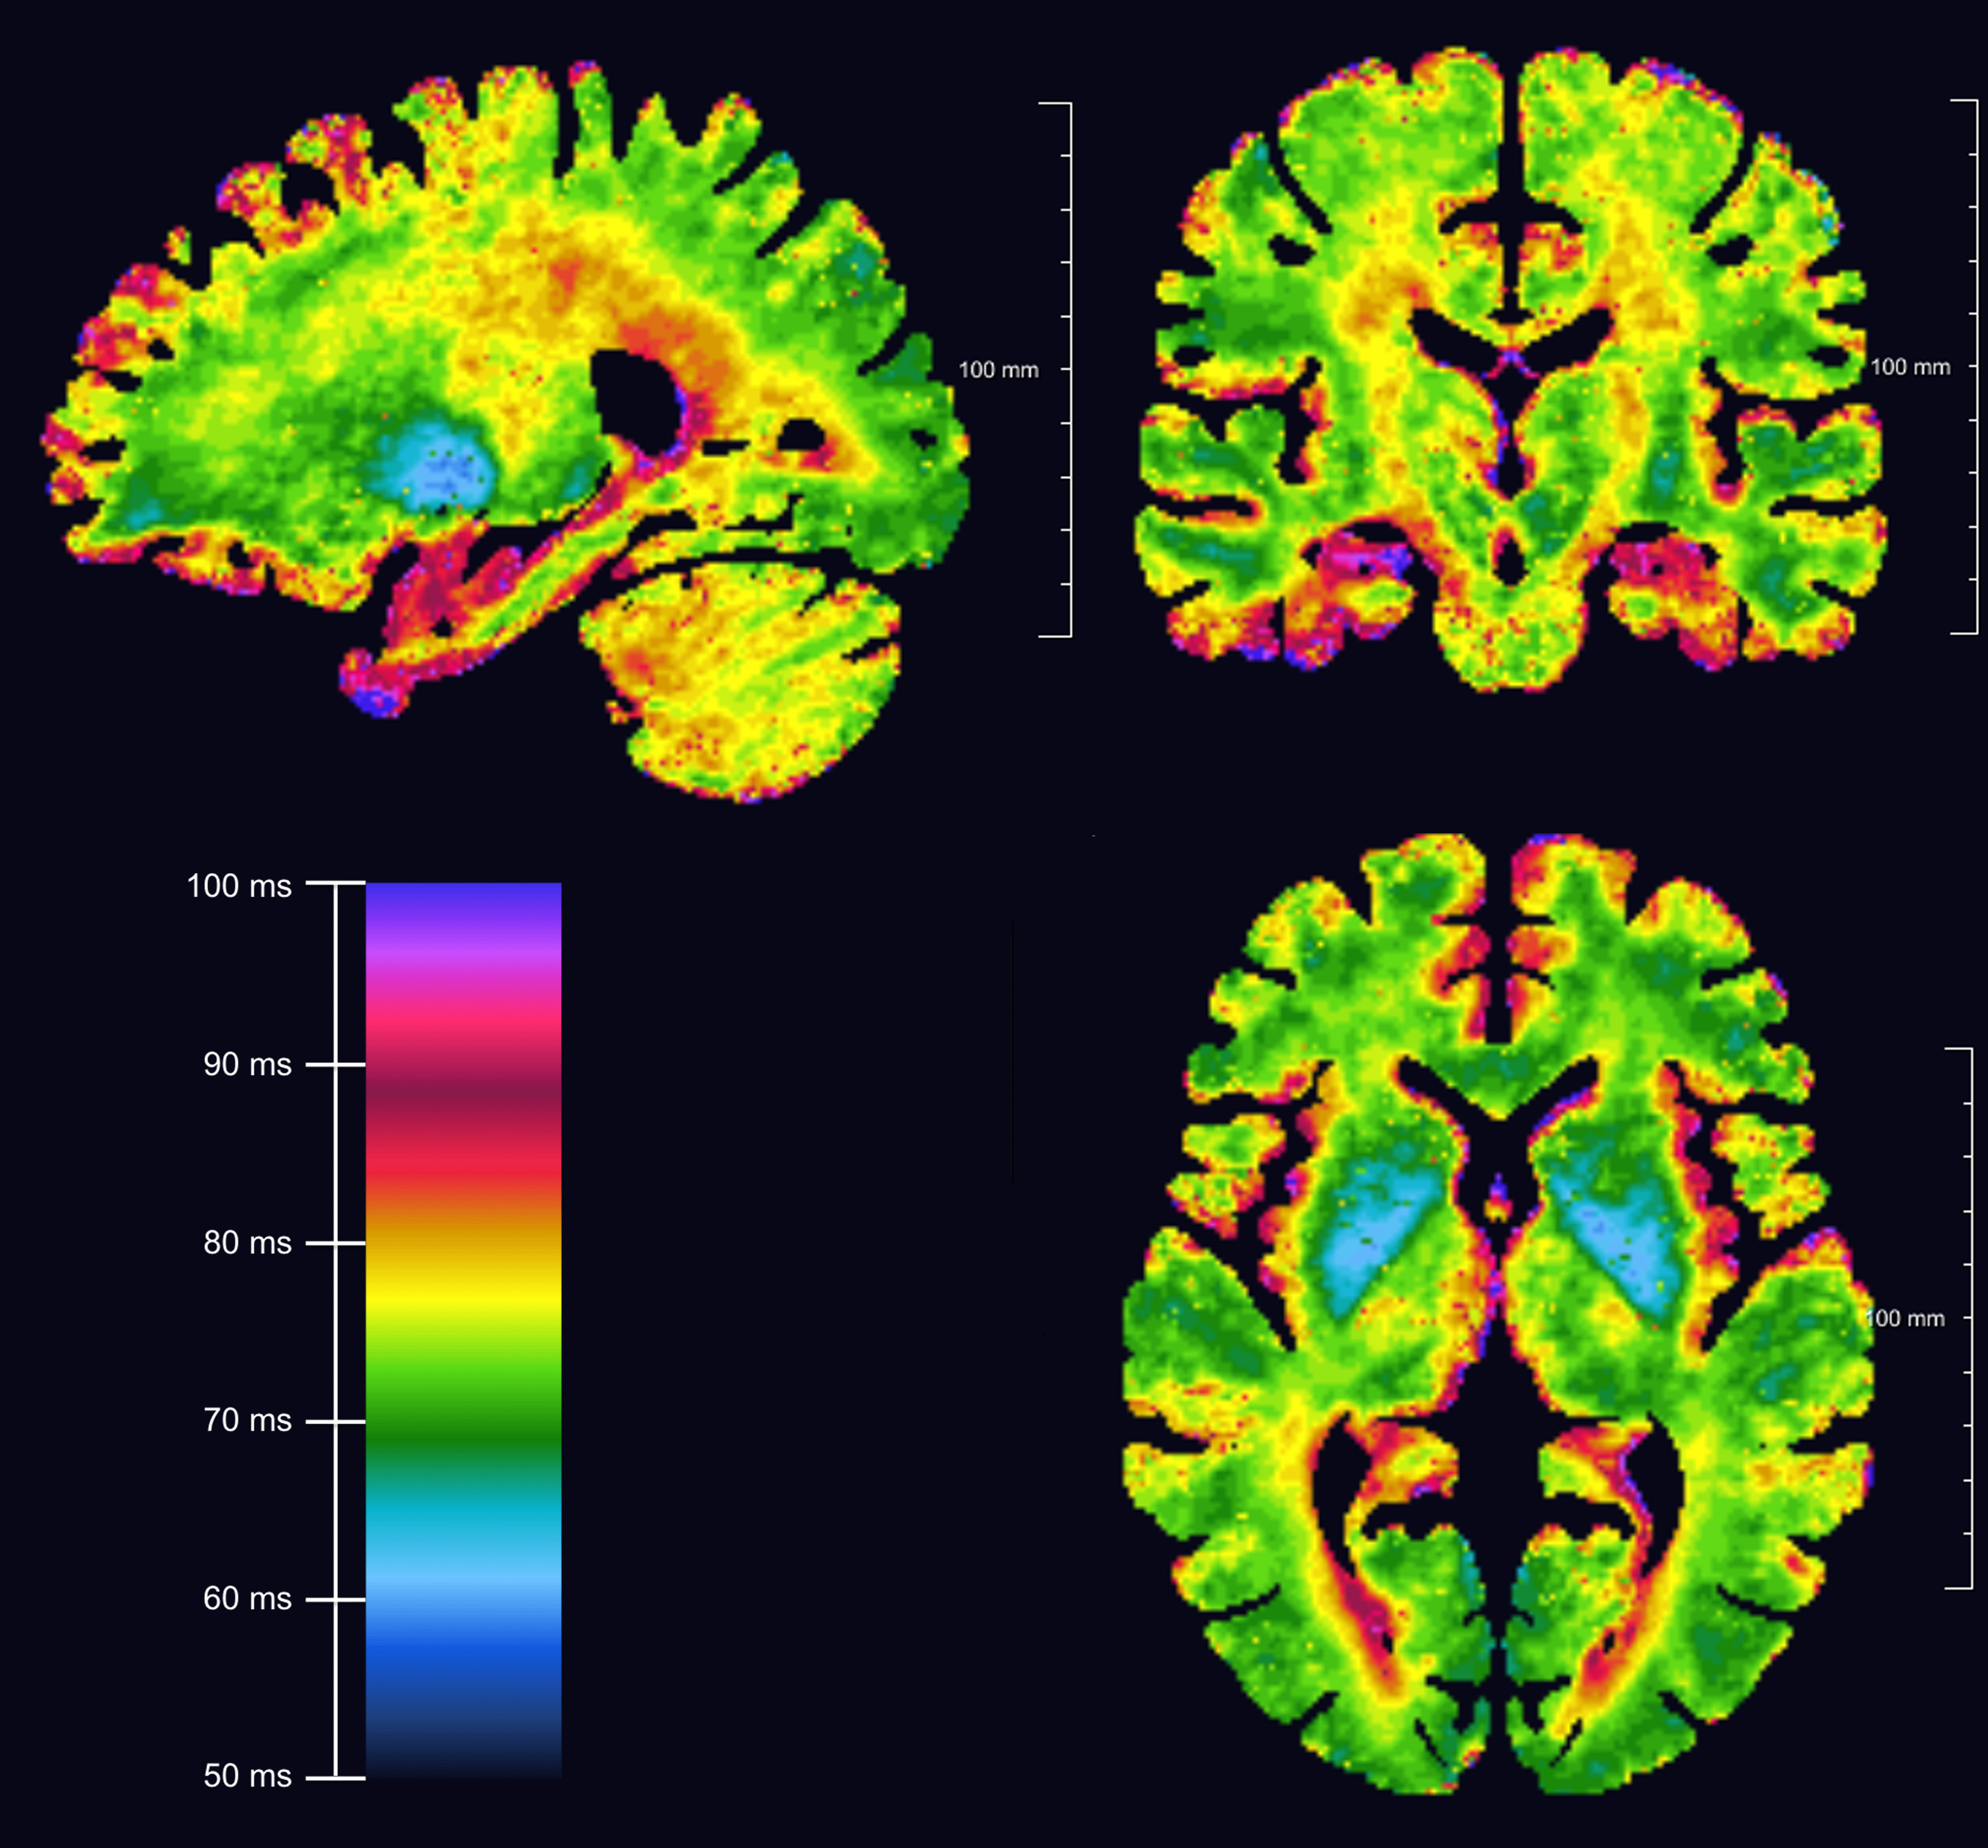
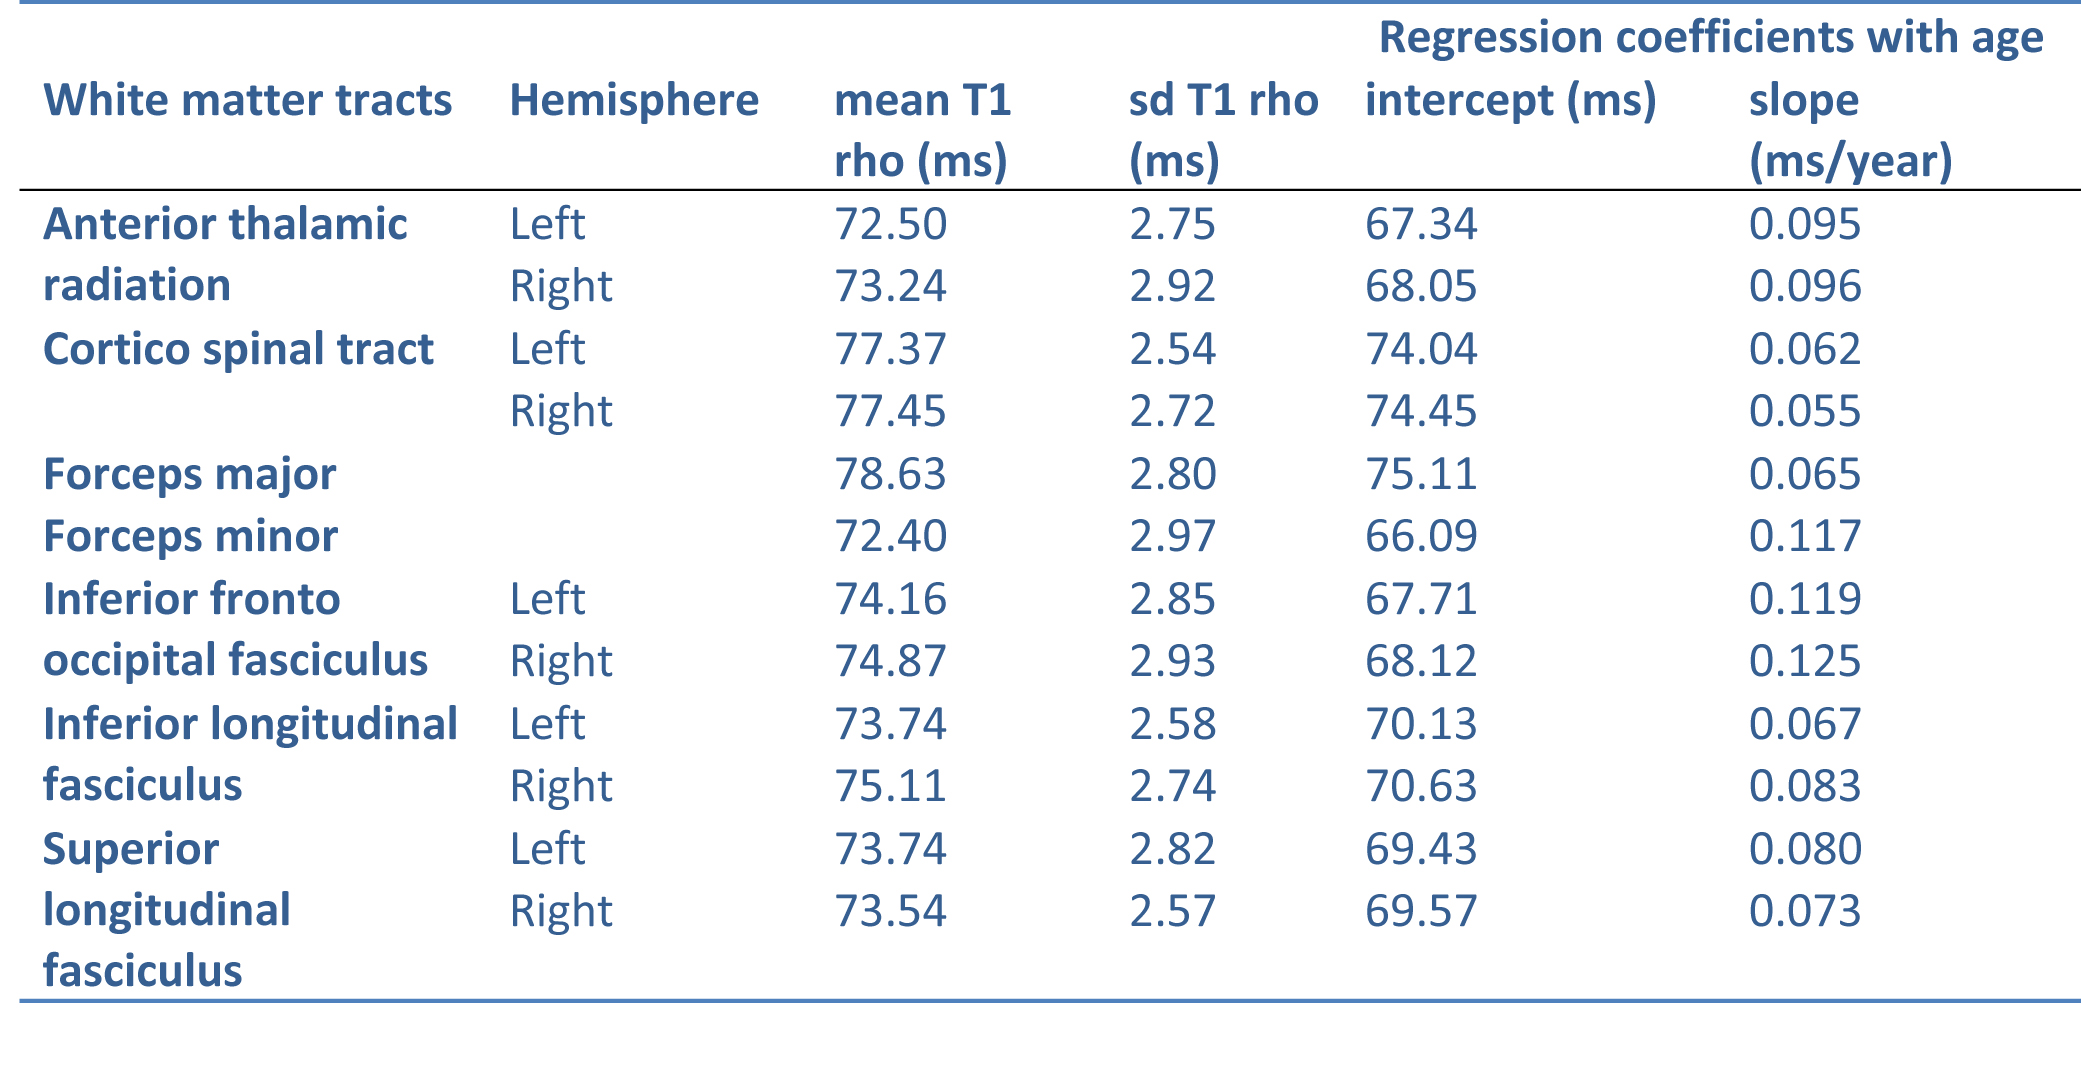
Figure 1 shows a T1-rho map for gray and white matter regions averaged over 10 randomly selected participants. In the coronal image, the cortico-spinal tract can be clearly seen. The blue regions correspond to the pallidum, characterized by small T1-rho values. Table 1 shows mean T1-rho values (and standard deviation) of the different brain regions in the left and right hemisphere, as well as slope and intercept of the regression analysis. Table 2 gives the same information for the selected white matter tracts. Figure 2 shows scatter-plots of average T1-rho values for cerebral cortex and pallidum and figure 3 for cerebral WM and inferior fronto-occipital fasciculus over age. Red points indicate women and blue points men. The lines show the linear regression and two times the standard deviation in positive and negative direction.DISCUSSION
We report normative T1-rho values of different gray and white matter regions in the brain. Cerebral gray matter shows a small decrease in T1-rho across age, while white matter shows an increase. Largest changes are found in the forceps minor and the inferior-fronto-occipital fasciculus. Largest average T1-rho values in WM tracts are found in the cortico-spinal tract and forceps major, both showing only slight changes with age. This supports the hypothesis that both structures are among the earliest to undergo myelination maturation in childhood and therefore have higher T1-rho values at a younger age [3]. The present study shows the same trends as Watts et al. [3], except for the Caudate, Putamen, Pallidum and Hippocampus, where we find opposite trends. Differences might be due to differences in sample size (larger in our study), sequence parameters (our TR is almost half) or age range (Watts et al. includes younger participants, starting at the age of 18). It is worth noting that some structures, such as the juxtacortical WM, show different trends in younger subjects (<30) compared to older ones. The strongest decrease in the cortical GM, seems to be limited to the younger participants. Further improvements of our sequence should focus on cortical gray matter and regions adjacent to CSF, where greater fitting errors occurred due to partial volume effects. As consequence, T1-rho values in these areas tend to be higher, as seen in Figure 1. Improvements in the fluid suppression might improve the results as well as using an increased resolution.CONCLUSION
We showed that it is feasible to obtain whole brain T1-rho values in short scan-times and provided normative T1-rho values for a wide range of brain regions and their changes over age.Acknowledgements
No acknowledgement found.References
[1] Borthakur et al. Neuroimage. 2008;41,1199-105
[2] Villanueva-Meyer J.
et al. Eur J Radiol. 2017 June;91:88-92
[3] Watts R. et al. JMRI 2014; 40:376-382
[4] Breteler et al. Alzheimer's & Dementia. 2014 Jul 01;
10:P92
[5] Stöcker, Big Data: The
Rhineland Study; ISMRM 2016, Singapore #6865
[6] Pracht
and Stöcker ISMRM 2016, Singapore #2831
[7] Manjon
et al. J Magn Reson Imaging. 2010;192-203
[8] Fischl
B. NeuroImage. 2012;62(2):774–814
[9] Hua et
al. NeuroImage, 39(1):336-347 (2008)
Figures