2760
Abnormal Static and Dynamic Functional Network Connectivity Patterns in Patients with Obsessive-compulsive Disorder1Huaxi Magnetic Resonance Research Centre (HMRRC), West China Hospital of Sichuan University, Chengdu, China
Synopsis
Static and dynamic functional network connectivity (FNC) analyses were applied to determine the abnormal connectivity patterns among the large-scale brain networks in obsessive-compulsive disorder patients. We found that static FNC analysis showed more obvious group differences than dynamic FNC. Decreased functional connectivity between visual network and DMN has been shown in both static and dynamic FNC analysis, it could be considered as the most stable connectivity change of functional brain networks in OCD patients. These findings advocate the using of both static and dynamic FNC to help truly understanding the alterations of brain networks.
Purpose
Obsessive-compulsive disorder (OCD), a debilitating and disabling disorder affects approximately 2-3% of the population1, is characterized by disruption among large-scale functional brain networks. Recently, functional network connectivity (FNC) holds the promise to explore the functional integration of brain networks in neuropsychiatric disorders including schizophrenia, Parkinson’s disease2,3. Most FNC studies are mainly based on the assumption that spatial and temporal stationarity throughout the entire scan, however, evidence of dynamic changes over time from many studies supports the idea of temporal dynamic properties of functional connectivity in resting state4. Here, we aimed to explore the abnormal whole-brain functional network dynamics in OCD patients using sliding window analysis and to evaluate whether the static and dynamic connectivity properties of brain functional network are different. Finally, we try to find the stable connectivity changes of brain networks both in static and dynamic states in patients with OCD.Materials and Methods
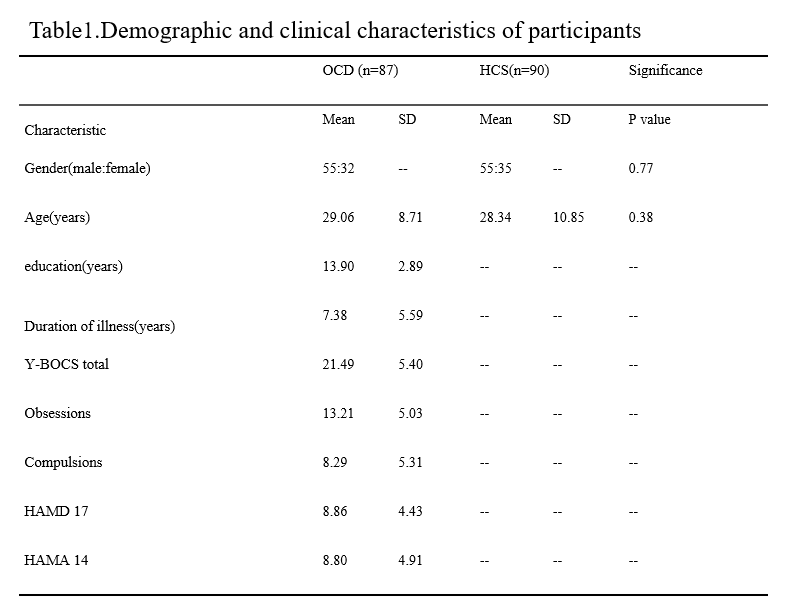
A total of 87 OCD patients and 90 sex and age matched HCs participated in current study (Table 1). Resting-state fMRI was performed via a 3-Telsa GE MRI system. The images were obtained via a gradient-echo EPI sequence with the following parameters: time repetition = 2000ms, time echo = 30 ms, flip angle = 90°, slice thickness = 5mm with no slice gap, field of view = 240 × 240 mm2, 30 axial slices, 200 volumes in each run. The rs-fMRI data was preprocessed using Data Processing Assistant for Resting-State fMRI (DPARSF). The ICA analysis was performed using the GIFT toolbox to automatically estimate 30 functionally independent components. Additional post-processing steps were performed using GIFT toolbox. The static FNC was estimated from the TC matrix, as the C ×C sample covariance matrix. The dynamic FNC analysis was estimated using dynamic FNC toolbox available in the GIFT toolbox package. The sliding window size was 22 TRs (44 seconds); sliding in steps of 1TR. To assess the dynamic FNC states, we applied the k-means clustering, the number of states was determined to be 5. Two sample t-test was used for static FNC and each dynamic FNC states. The p values were corrected using False Discovery Rate(FDR).Results
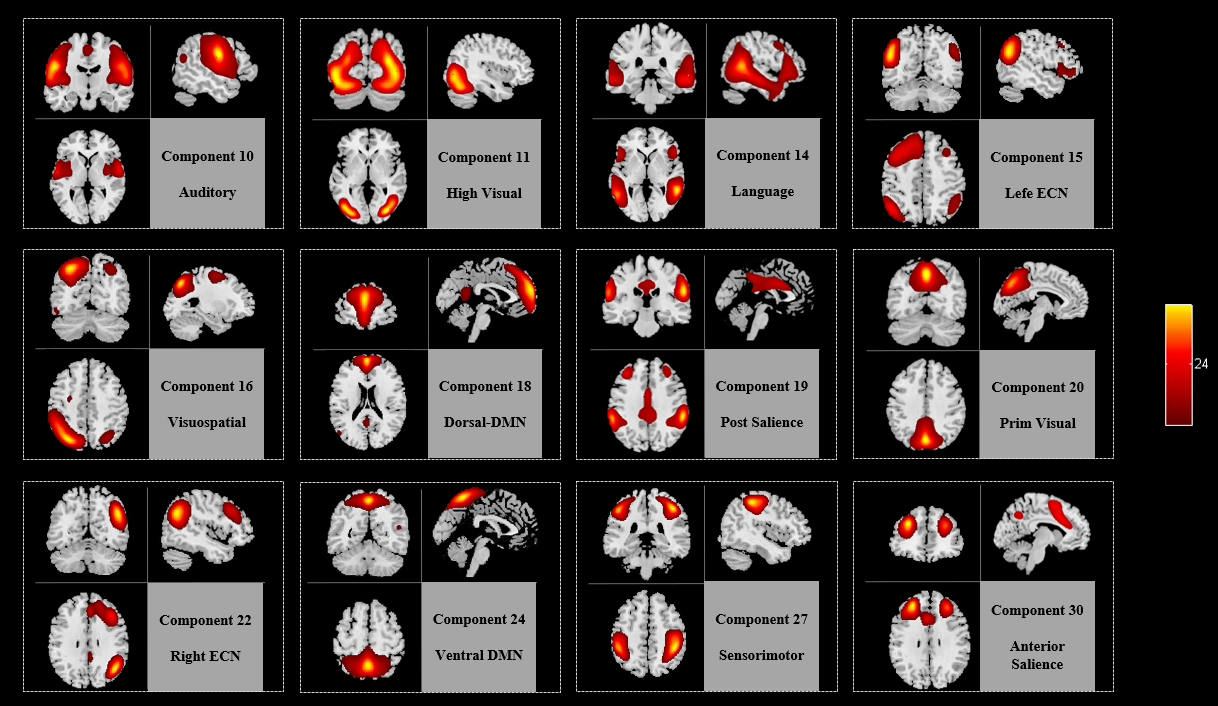
1.Intrinsic connectivity networks: We characterized 12 components as intrinsic connectivity networks (ICNs) among the 30 estimated independent components for two groups, based on the largest spatial correlation with specific resting state network templates5. The spatial maps of these 12 ICNs identified by group ICA are shown in Fig.2. We used the time series of these 12 ICNs to calculate static and dynamic FNC matrices.
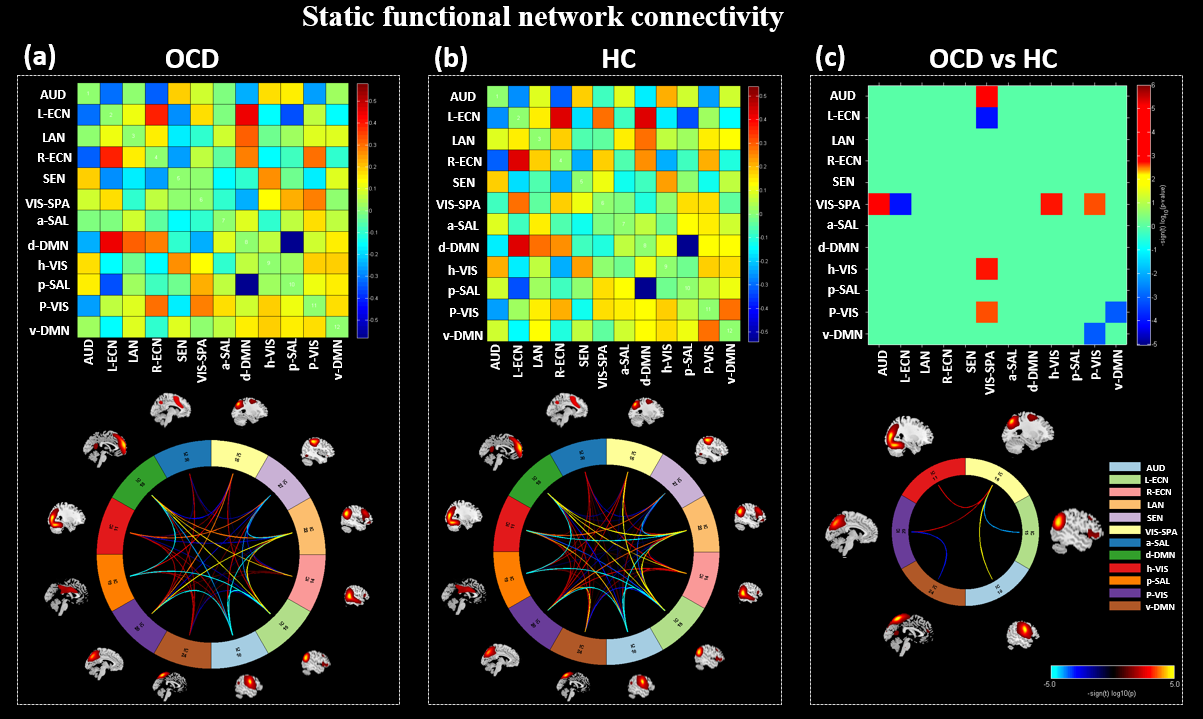
2.Static FNC estimation: As shown in Fig.3, Relative to HC group, OCD patients showed increased static FNCs between auditory and visuospatial network, between visuospatial and primary/high visual network. Decreased static FNCs between left executive control and visuospatial network, between primary visual and dorsal default mode network were exhibited in OCD group.
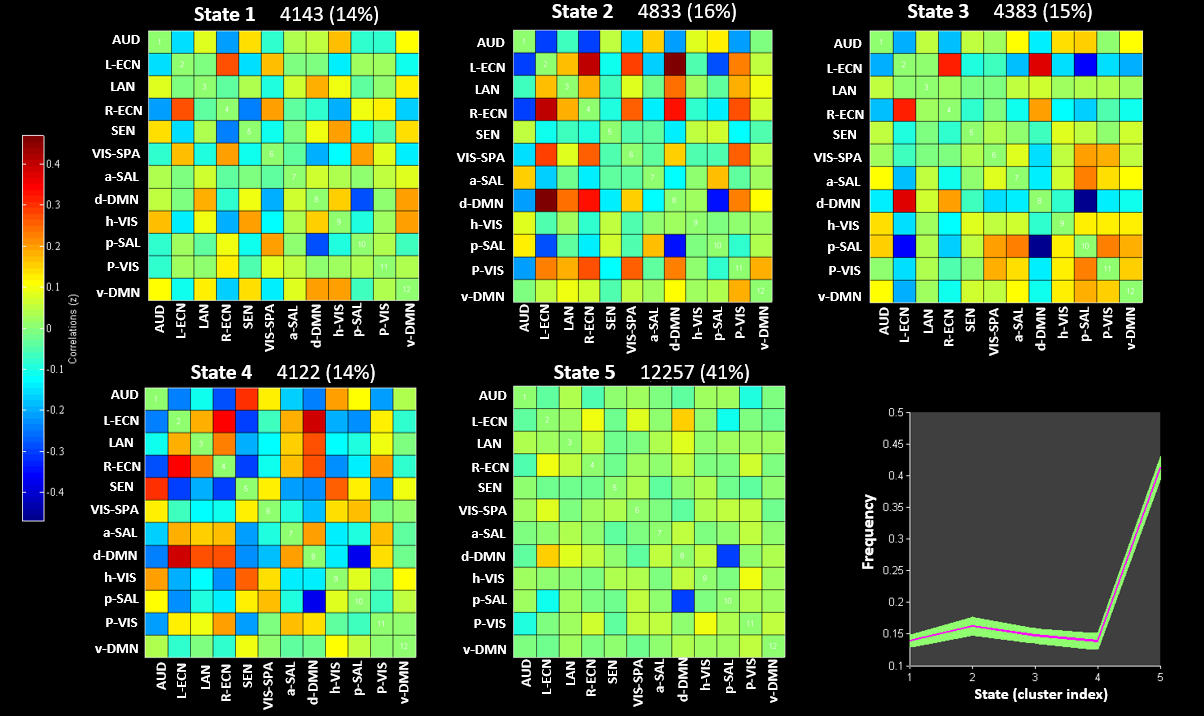
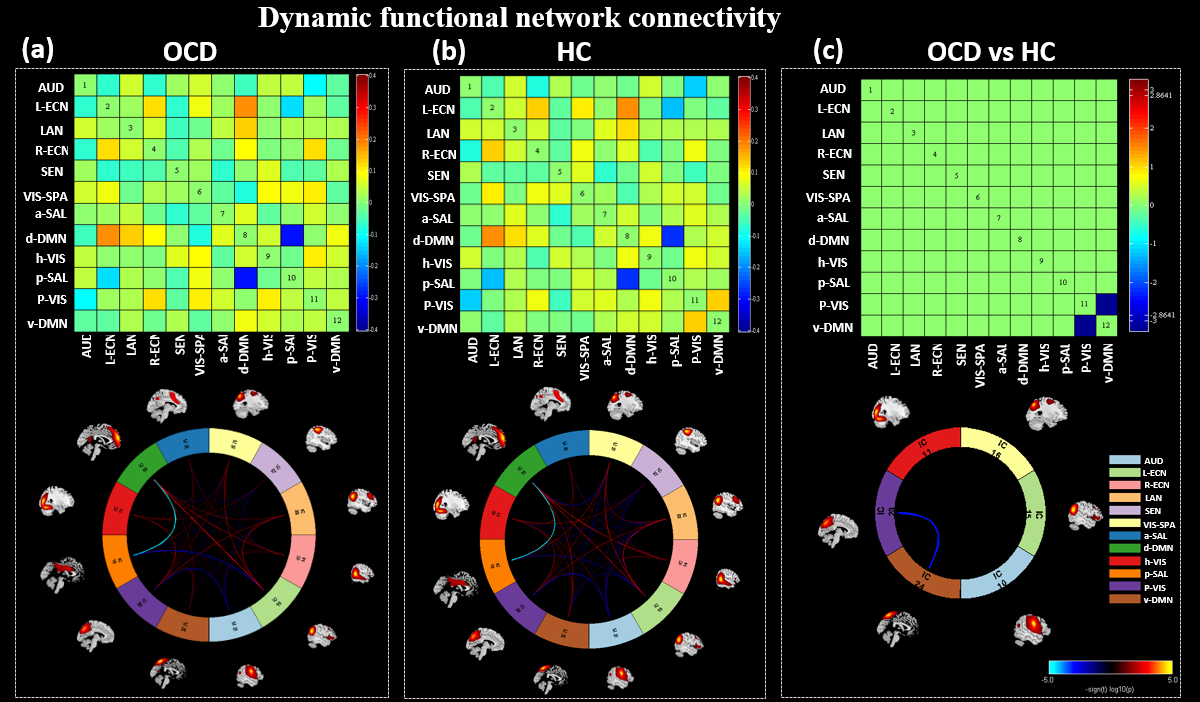
3.Dynamic FNC estimation: We applied k-means clustering to assess the frequency of reoccurring FC patterns based on the gap statistic. The clustering index was calculated to determine the number of states, and the optimal number of states was determined to be 5 (Fig.4). Group differences were found in state 5. The dynamic analysis replicated only decreased dynamic FNC between primary visual and ventral default mode network as formerly found in the static analysis (Fig.5).
Discussion and Conclusion
As the first study to demonstrate the abnormal static and dynamic FNC patterns in OCD patients, current study yielded three main findings. First, OCD patients exhibited decreased dynamic FC between primary visual network and ventral DMN which reflect that the visual processing and internal mental activity would be dynamic changes over time at resting state. Second, static FNC analysis showed more obvious group differences than dynamic FNC. We postulate this is because static FNC summarize the information from all dynamic states and thus can provide more aggregative information. On the contrary, dynamic FNC could be considered as a more specific pattern than static FNC since it characterize the signal for local connectivity changes over each short time slot by decomposing the temporal feathers averaged in static FNC. Third, decreased functional connectivity between visual network and DMN has been shown in both static and dynamic FNC analysis, so it could be considered as the most stable connectivity change of functional brain networks in OCD patients. These findings advocate the using of both static and dynamic FNC to help truly understanding the alterations of brain networks.Acknowledgements
This study was supported by the National Natural Science Foundation (Grant No. 81671669), Science and Technology Project of Sichuan Province (Grant No. 2017JQ0001).References
1. Jonathan S Abramowitz, Steven Taylor, Dean McKay. Obsessive-compulsive disorder. Lancet. 2009; 374: 491–99.
2. Barnaly Rashid, Mohammad R. Arbabshirani, Eswar Damaraju, et al. Classification of schizophrenia and bipolar patients using static and dynamic resting-state fMRI brain connectivity. Neuroimage. 2016 Jul 1;134:645-657.
3. Jinhee Kim, Marion Criaud, Sang Soo Cho, et al. Abnormal intrinsic brain functional network dynamics in Parkinson’s disease. Brain. 2017: 140; 2955–2967.
4. Allen EA, Damaraju E, Plis SM, et al. Tracking whole-brain connectivity dynamics in the resting state. Cereb Cortex. 2014 Mar;24(3):663-76.
5. Shirer W, Ryali S, Rykhlevskaia E, et al. Decoding subject-driven cognitive states with whole-brain connectivity patterns. Cereb Cortex. 2012; 22 (1): 158-65.
Figures