2755
Evaluation of structural brain modifications related to First Episode PsychosisFrancesca Saviola1, Marcella Bellani2, Letizia Squarcina3, Eleonora Maggioni4, Domenico Zacà1, Cinzia Perlini5, Mirella Ruggeri2,6, Paolo Brambilla3,7, and Jorge Jovicich1
1CIMeC, Center for Mind/Brain Sciences, University of Trento, Rovereto (TN), Italy, 2UOC of Psychiatry, Azienda Ospedaliera Universitaria Integrata (AOUI) of Verona, Verona, Italy, 3IRCCS “E. Medea” Scientific Institute, Bosisio Parini, Lecco, Italy, 4Department of Neurosciences and Mental Health, Fondazione IRCCS Ca’ Granda Ospedale Maggiore Policlinico, University of Milan, Milano, Italy, 5Department of Neurosciences, Biomedicine and Movement Sciences, Section of Clinical Psychology, University of Verona, Verona, Italy, 6Department of Neurosciences, Biomedicine and Movement Sciences, Section of Psychiatry, University of Verona, Italy, Verona, Italy, 7Department of Pathophysiology and Transplantation, University of Milan, Milano, Italy
Synopsis
Psychiatric disorders are characterized by a complex range of symptoms. Psychosis, known as one of the most severe mental illness, is still lacking specific neuroimaging markers complementing clinical information for early differential diagnostics, disease progression monitoring and treatment response evaluations. Most previous studies in the field considered psychotic patients undergoing chronic pharmacologic treatment or long duration of illness, which may confound morphometric or functional findings. Here we study a cohort of First Episode Psychosis (FEP) patients to investigated grey matter changes using structural MRI, in FEP relative to healthy controls, with univariate and multivariate analysis.
INTRODUCTION
Psychosis is a disorder that causes partial loss of contact with external reality in daily activities1. Neuroimaging studies have shown grey matter (GM) modifications associated with early manifestations of psychosis2. This motivates the study of neuroimaging markers that may be used as complementary clinical information for more precise differentiated diagnosis in early stages of disease as well as to measure treatment responses. Previous studies assessed brain morphometric changes by means of univariate analysis, hence characterizing single brain structures independently from the rest of the brain. In this study, we evaluated multivariate structural covariance network analyses in First Episode Psychosis (FEP) to focus on the onset of the pathology. In particular, given its functional relevance3,4, we performed a seed-based structural covariance on salience network (SN), a large scale functional network contributing to communication, social behaviour, self-awareness and cognitive integration.MATERIALS AND METHODS
T1 structural MRI data was used to characterize voxel based morphometry (VBM) and structural covariance differences investigated with Partial Least Square between a group of 67 FEP and 67 age and gender matched healthy controls (HC). Seed-based multivariate analysis (Figure 1) was done on the SN, identified in previous studies by bilateral anterior cingulate cortex (ACC) and anterior insula (AI)5.RESULTS
VBM results showed nine clusters of decreased GM in FEP relative to HC, mainly in temporal-frontal regions. In addition, GM density in FEP correlated positively with intelligence scores (Figure 2) in hippocampus (MNI peak coordinates: -27, -16.5, -16.5, peak p-value <0.0001, peak R2 =0.53), insula (MNI peak coordinates: 36, 20, 1, peak p-value=0.001, peak R2 =0.32), and fronto-temporal structures. A similar GM density positive correlation with intelligence scores was found in HC (Figure 2) mainly localized in amygdala (MNI peak coordinates: -21, 0, -15, peak p-value <0.0001, peak R2 =0.60) and limbic regions, thalamus and fronto-temporal regions. Severity of symptoms, measured through Positive and Negative Syndrome Scale (PANSS) was, on the other hand, positively related in FEP to more wide-spread cluster (Figure 3) located in limbic regions (MNI peak coordinates: 9, -24, -15, peak p-value=0.001, peak R2 =0.94). Structural covariance of SN (Figure 4) scores exhibited an opposite trend (Figure 5) in FEP compared to HC (t=-5.8, p <0.01), identifying changes to network’s GM integrity: in FEP ACC is showing a positive covariance pattern and a negative in insular cortex; conversely in HC the pattern is reversed.DISCUSSION
Consistent with previous results6, we found grey matter abnormalities in FEP patients compared to healthy controls with voxel-based morphometry. We also found, both in FEP and HC, positive correlations between grey matter density and IQ (Raven’s intelligence coefficient) mostly in limbic structures. These spatial patterns common to both groups appear therefore to be unrelated to the pathology. On the other hand, in FEP, grey matter density correlated positively with symptoms’ severity and show a very specific but widespread cluster probably due to the presence of a strong symptoms makeup. Furthermore, structural covariance, previously investigated by the means of a whole-brain analysis of large-scale networks7, showed a covariance reduction associated to psychosis risk. These results indicate that cortical atrophy is also reflected as an abnormal structural covariance in salience network and executive control in FEP. Indeed, by using a novel multivariate approach to study structural covariance, we showed distinct and specific structural pattern trends in FEP and HC populations opening the door to the investigation of psychosis as a disorder of lack of structural hubness.CONCLUSIONS
This study provides further supporting evidence of the putative presence of gray matter abnormalities in FEP, effects that correlate with clinical behavioural metrics. We found that network covariance with the salience network differentiated FEP from HC group only at a trend level. Future studies could include grey matter structural covariance changes in the presence of psychosis with neuropsychological assessments. This may help investigating associations between atrophy effects in structural covariance networks and behavioural impairments.Acknowledgements
None.References
- Kahn, R. S., Sommer, I. E., Murray, R. M., Meyer-Lindenberg, A., Weinberger, D. R., Cannon, T. D., … Insel, T. R. (2015). Schizophrenia. Nature Reviews Disease Primers, 1(November). https://doi.org/10.1038/nrdp.2015.67
- Fannon, D., Chitnis, X., Doku, V., Tennakoon, L., O’Ceallaigh, S., Soni, W., … Sharma, T. (2000). Features of structural brain abnormality detected in first-episode psychosis. American Journal of Psychiatry, 157(11), 1829–1834. https://doi.org/10.1176/appi.ajp.157.11.1829
- Seeley, W.W., Menon, V., Schatzberg, A.F., Keller, J., Glover, G.H., Kenna, H., Reiss, A.L., Greicius, M.D., 2007. Dissociable intrinsic connectivity networks for salience pro- cessing and executive control. J. Neurosci. 27, 2349–2356. https://doi.org/10.1523/JNEUROSCI.5587-06.2007
- Palaniyappan, L., & Liddle, P. F. (2012). Does the salience network play a cardinal role in psychosis? An emerging hypothesis of insular dysfunction. Journal of Psychiatry and Neuroscience, 37(1), 17–27. https://doi.org/10.1503/jpn.100176
- DuPre, E., & Spreng, R. N. (2017). Structural covariance networks across the lifespan, from 6-94 years of age. Network Neuroscience, 1–38. https://doi.org/10.1162/NETN_a_00016
- P. Fusar-Poli, S. Borgwardt, A. Crescini, G. Deste, Matthew J. Kempton, S. Lawrie, P. Mc Guire, E. Sacchetti (2011), Neuroanatomy of vulnerability to psychosis: A voxel-based meta-analysis, Neuroscience & Biobehavioral Reviews, 35-5. https://doi.org/10.1016/j.neubiorev.2010.12.005.
- Heinze, K., Reniers, R. L. E. P., Nelson, B., Yung, A. R., Lin, A., Harrison, B. J., … Wood, S. J. (2015). Discrete alterations of brain network structural covariance in individuals at ultra-high risk for psychosis. Biological Psychiatry, 77(11), 989–996. https://doi.org/10.1016/j.biopsych.2014.10.023
Figures
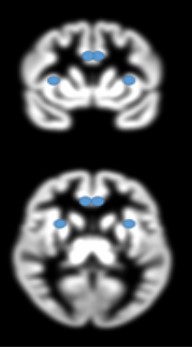
Figure 1. Location of Salience Network seeds:
Anterior
Cingulate Cortex MNI coordinates: x = ±5, y = 15, z = 32; Anterior Insula MNI
coordinates: x = ±31, y = 11, z = 8.
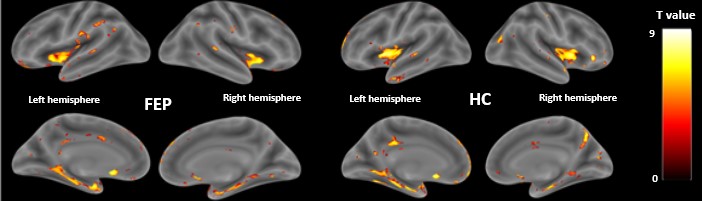
Figure 2. Right side: Positive correlation of IQ index
and grey matter density in FEP (n=66), FWE correction for multiple comparisons
(p <0.05). Left side: Positive correlation of IQ index and grey matter density in HC (n=58), FWE correction
for multiple comparisons (p <0.05).
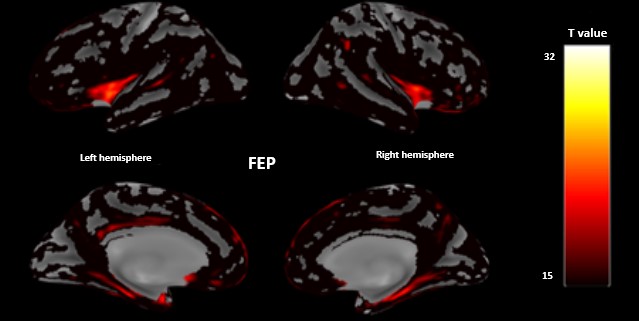
Figure 3.
Correlation of PANSS index and grey matter density in FEP(n=66), threshold is
set at 15 due to widespread dissemination of cluster. FWE correction for
multiple comparisons (p <0.05).
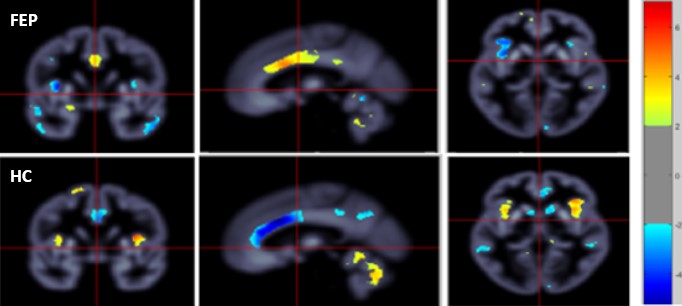
Figure 4. Volumetric orthogonal views of Latent
Variable 2 extracted from Salience network seed based PLS analysis performed in
FEP patients (n=67, p=0.04, upper row) and in HC (n=67, p=0.01, lower row).
Anterior cingulate cortex and insular cortex are showing opposite spatial
patterns among groups.
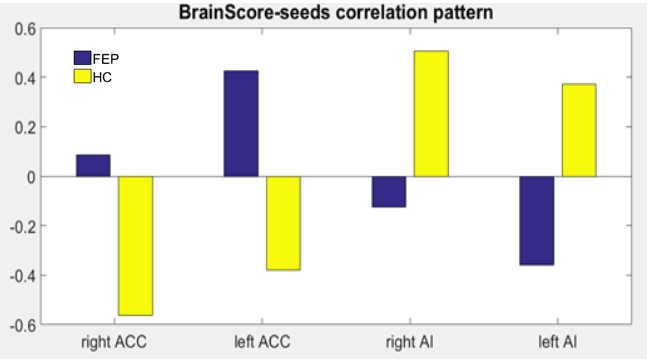
Figure 5.
Brain score–seed
correlation patterns for Latent Variable 2 (p < .05). It shows a structural
covariance pattern of the bilateral Anterior Cingulate Cortex (r-value: right ACCFEP=0.1,
left ACCFEP=0.1; right ACCHC=-0.6, left ACCHC=-0.4)
and right Anterior Insula (r-value: right
AIFEP=-0.1, left AIFEP=-0.4; right AIHC=0.5,
left AIHC=0.4) which is mainly present and stronger in healthy
controls. The latent variable shows structural covariance of all seeds that
differs significantly between FEP and HC (t=-5.8, p<0.01).