2752
Source-based Laterality of Grey Matter in Schizophrenia1Mind Research Network, Albuquerque, NM, United States, 2Electrical and Computer Engineering, Neurosciences, Psychiatry, Biology, and Computer Science, Mind Research Network, Albuquerque, NM, United States
Synopsis
Altered brain laterality is frequently reported in morphological brain studies of individuals with schizophrenia. However, these studies utilize voxel/vertex-wise univariate methods which may not be optimal for examining brain laterality. We introduce a novel multivariate approach to estimate covarying lateralized networks. In our approach, lateralized grey matter maps were computed by subtracting volumetric data one hemisphere from the other, and analyzed via independent component analysis (ICA), followed by testing loading parameters from components identifying covariation within laterality networks. Results display significant relationships with temporal lobe and cerebellar laterality and negative symptoms of schizophrenia that warrant further exploration with multimodal analyses.
Introduction:
Grey matter laterality alterations in patients with schizophrenia (SZ) has been reported across a number of functional1 and structural2–5 MRI studies. Deficits in language and speech are attributed to increased left laterality in frontal, temporal, and parietal regions in patients with SZ6. However, previous work utilized voxel-wise univariate methods, which may be sub-optimal for detecting laterality-specific alterations. To address this limitation, we propose a novel approach called source-based laterality (SBL). We lateralized (left hemisphere – right hemisphere) grey matter volume maps to identify covarying networks/components specific to volumetric grey matter laterality in patients with SZ followed by an ICA analysis to extract covarying laterality networks. This resulting sources represent laterality networks which covary between hemispheres across subjects.Methods:
Participants: T1 weighted images were acquired 167 participants with SZ (M/F: 129/38) and 159 (M/F: 113/46) TC from 7 imaging centers. No significant differences were identified between TC and SZ patients on age (W = 14169, p = 0.29), gender composition (χ2 = 1.32, df = 1, p = 0.25), or handedness (χ2 = 1.9454, p = 0.39). No differences in SZ vs TC representation were found across sites diagnostic groups (χ2 = 1.07, df = 6, p = 0.98).
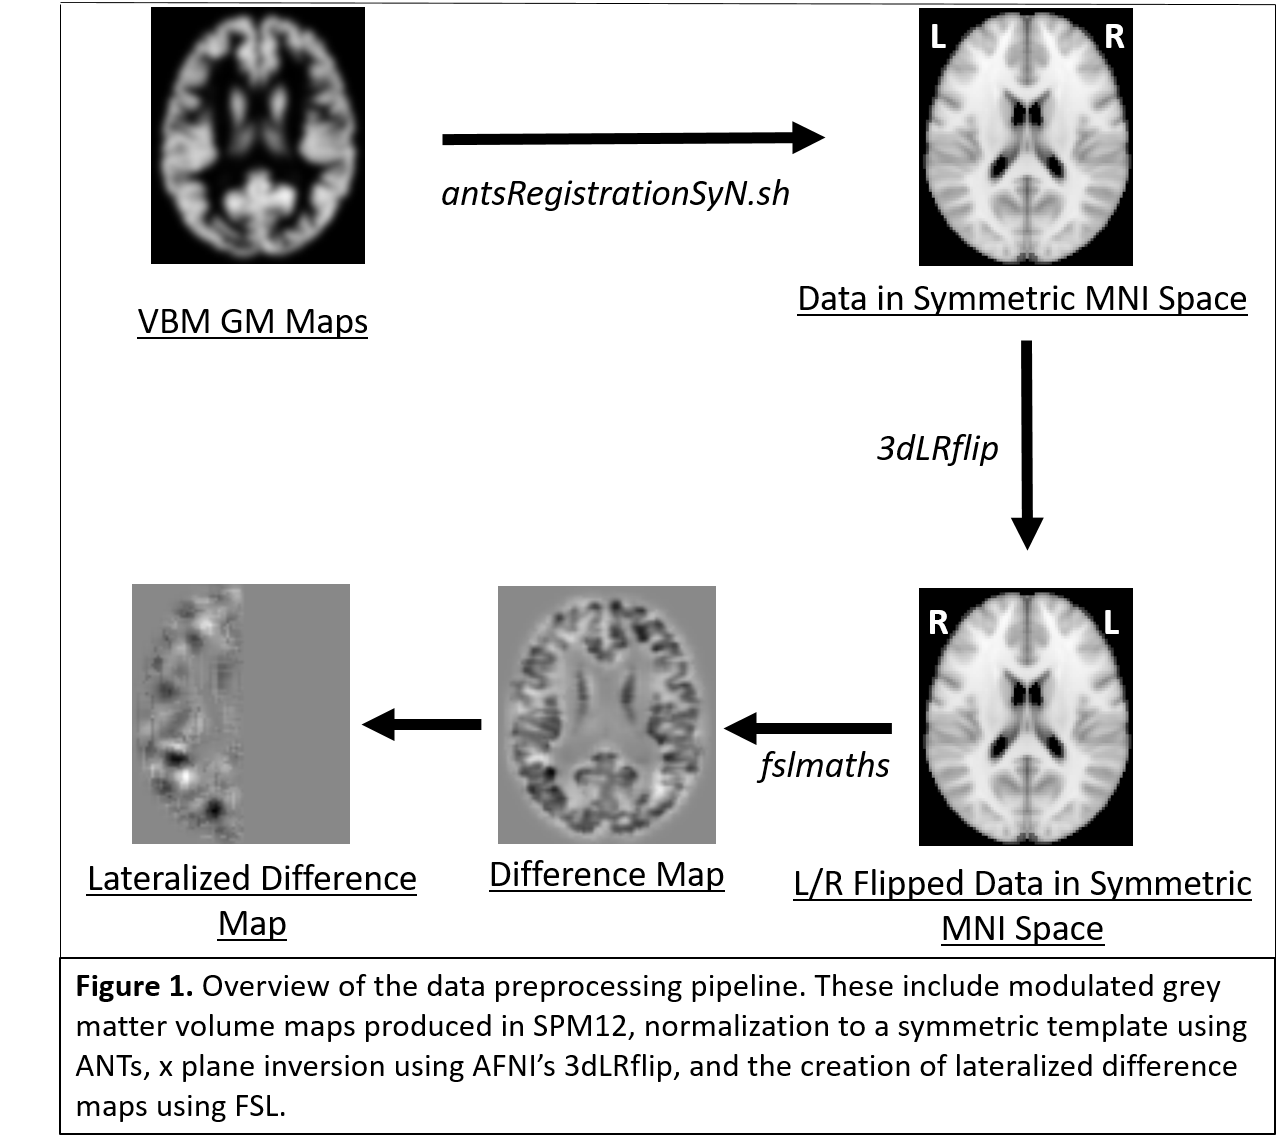
Preprocessing: Grey matter volume maps were computed from T1 images using SPM12’s voxel-based morphometry pipeline. Grey matter maps were normalized to a symmetric MNI template using ANTs8,9, and smoothed to an average FWHM ~ 12. After smoothing, each map was mirrored and the mirror was subtracted from the original smoothed image, and a mask of all positive values of x (left hemispheric) was applied to the difference image to generate a laterality map. A summary of the pipeline is detailed in Figure 1.
Analyses:
- Source-Based Morphometry: Source based morphometry7 for 30 components was performed on 326 laterality maps utilizing entropy bound minimization (EBM)-ICA, and selection of the best run from 20 for component stabilization.
- Multiple regression: Component weights were regressed onto diagnostic status (SZ vs TC), handedness, and data acquisition site. The 30 regressions were multiple comparison corrected using a 5% FDR10.
- Clinical Correlations: Weights from SZ patients were extracted from components associated with diagnostic status. Spearman’s ρ partial correlations across diagnosis-specific components were performed with positive, negative, and total positive and negative syndrome Scale (PANSS)11 to probe brain/behavior relationships in patients with SZ.
- FNC Calculations: Mixing matrices from the 4 components associated with diagnostic status were correlated with one another and adjusted for multiple comparisons using a Holm correction12 to examine relationships between components.
Results:
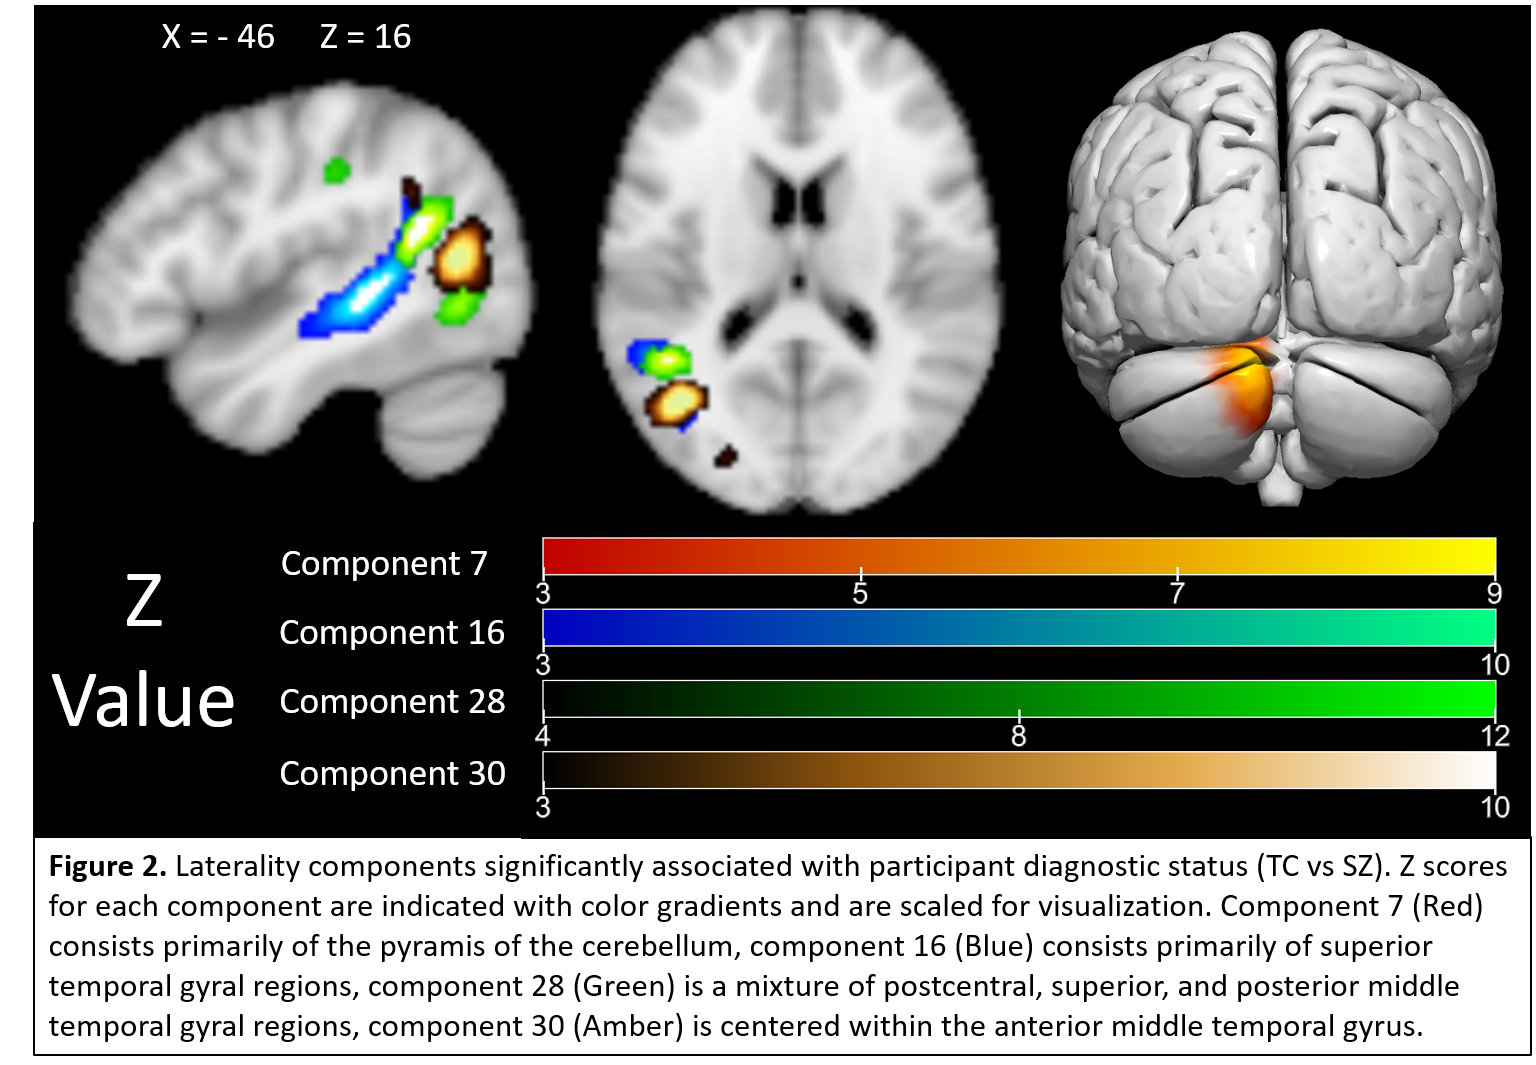
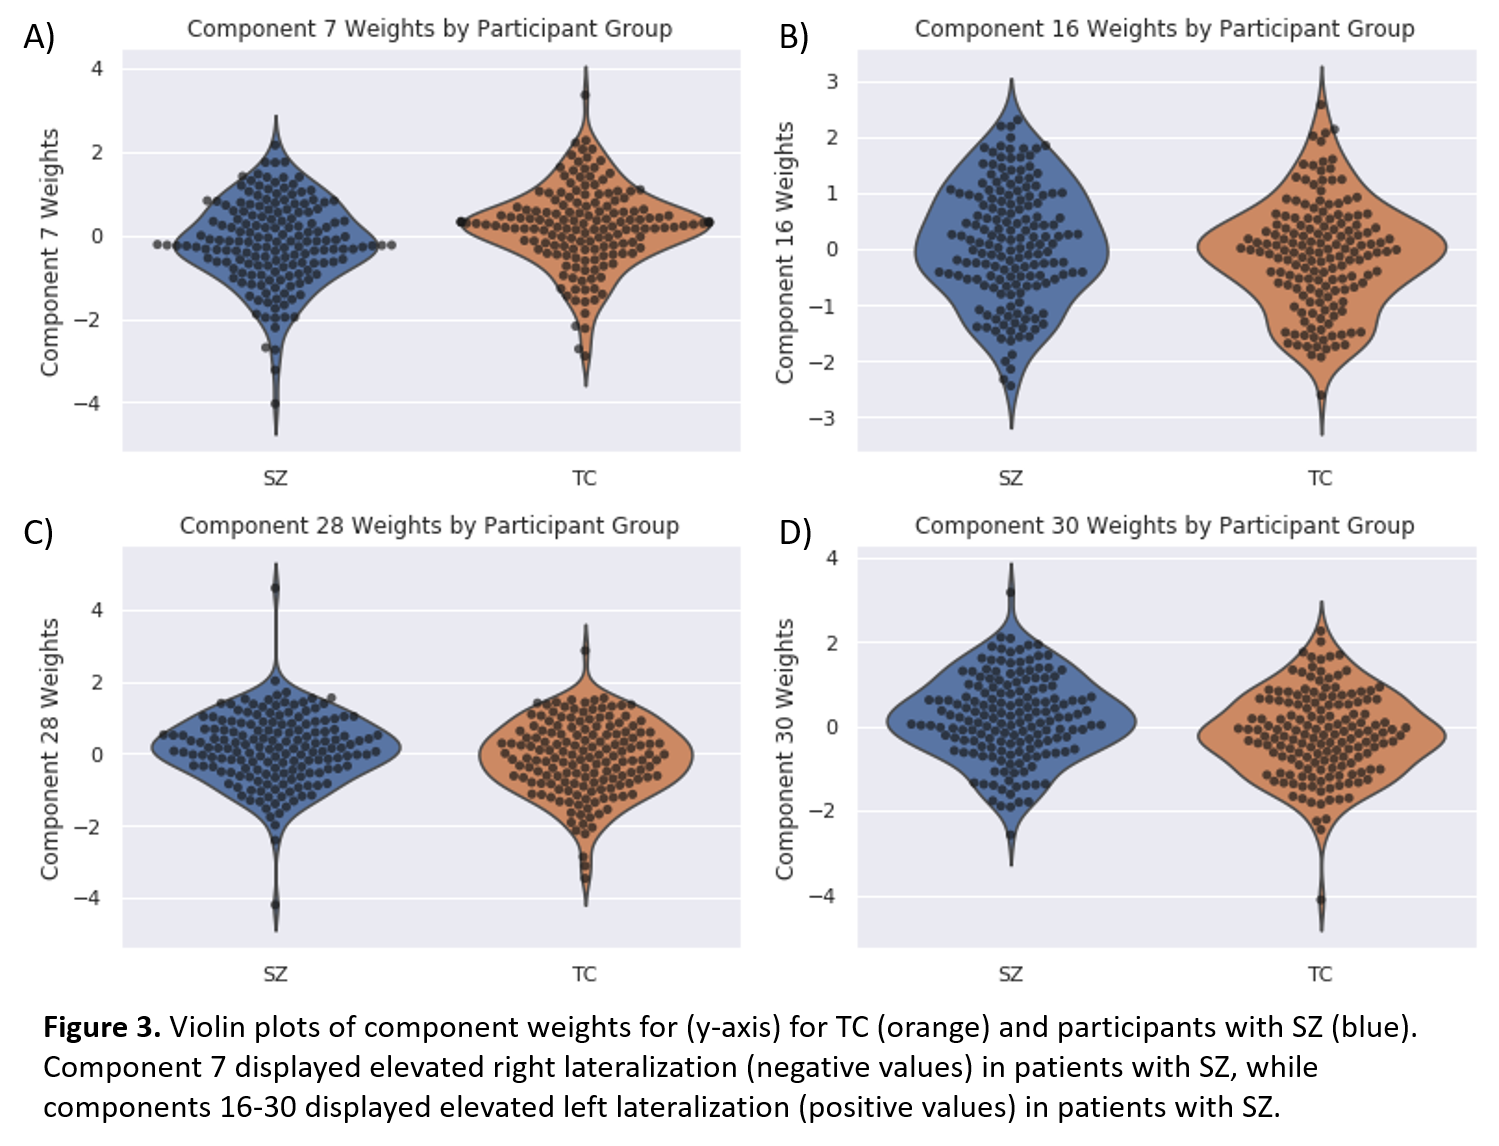
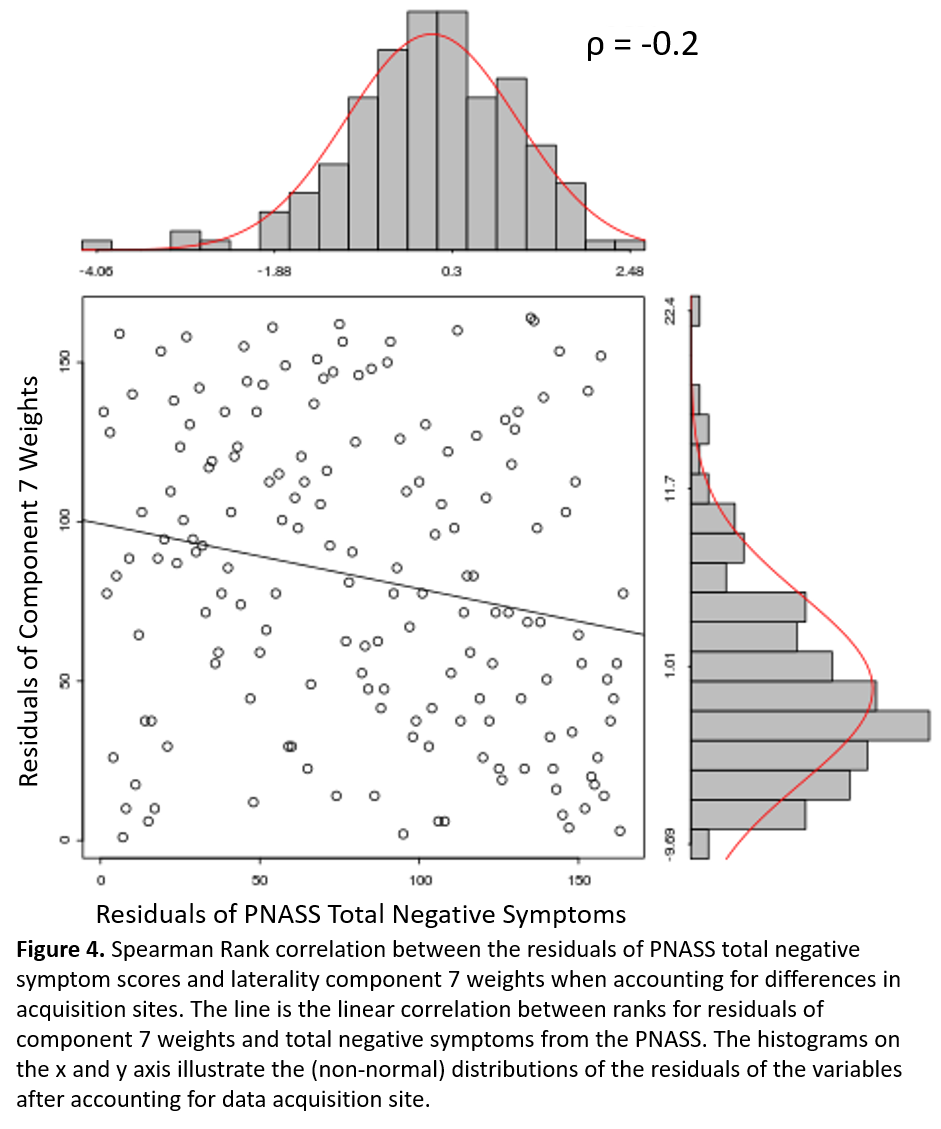
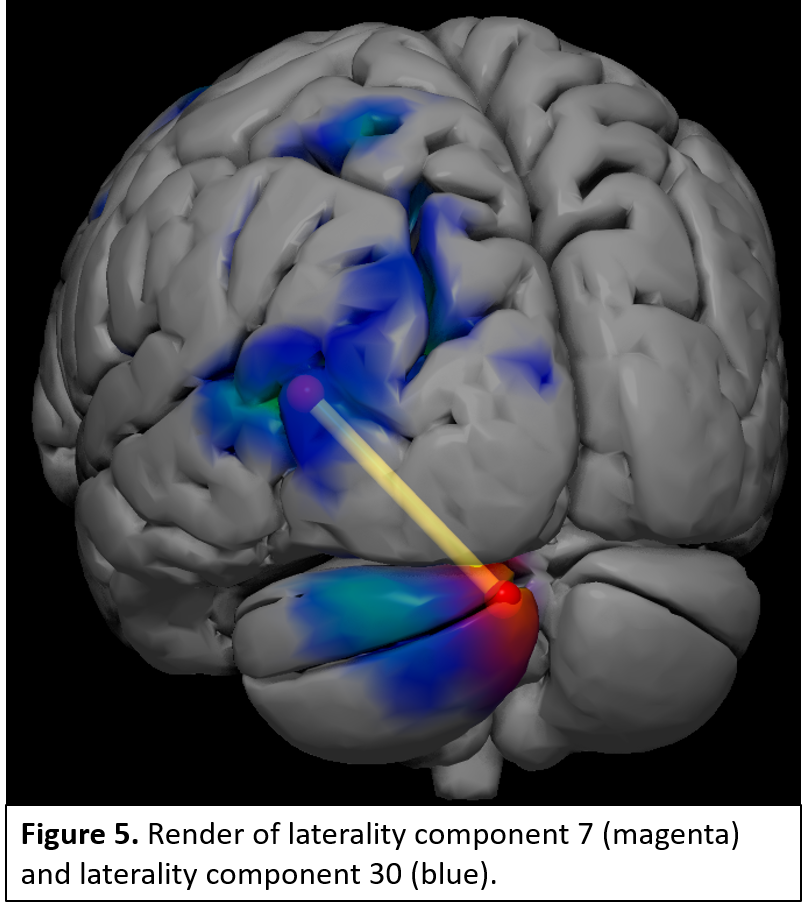
Laterality components were found across frontal, temporal, visual, parietal, and cerebellar regions. Linear regressions identified 4 components which significantly differentiated TC from SZ patients (Fig 2). These include greater right lateralization in the pyramis of the cerebellum in SZ patients compared to TC (Fig. 3), and greater left lateralization in SZ patients within postcentral and superior and middle temporal gyral (STG, MTG) components (Fig. 3). Follow-up analyses examining Spearman ρ partial correlations between positive, negative, and total PANSS symptoms with each component identified greater negative symptom scores associated with increases in right laterality (ρ = -0.2, correctedp = 0.03) of the cerebellum (Fig 4). FNC analyses revealed a significant correlation (r = -0.2, correctedp = 0.002) between component 7 and component 30 (Fig. 5).Discussion and Conclusions:
Results replicate and extend previous grey matter2–5, and resting-state analyses1. Left middle and superior temporal alterations are consistent with previous SZ studies including regions associated with language and social cognition6. Altered left-lateralized subregions of the STG and MTG is novel, and supports previous work linking the left anterior portions of the STG/MTG to language integration, and the posterior STG/MTG are to speech production and other cognitive functions in a graded manner13–16, which may be the source of the separate temporal components. Furthermore, tractography studies suggest physical connections exist between the cerebellum and contralateral MTG17, and white matter within temporal regions may be compromised in SZ18, which our FNC results may reflect. The cerebellum has been linked to social cognition via middle and superior temporal gyrus connections19. Right cerebellar resection from cranial fossa tumors is produces deficits in complex language tasks and speech alterations ranging from mutism to dysarthria20. These symptoms are not unlike negative symptoms described in the PANSS11. In future studies multimodal frameworks (e.g. diffusion MRI, fMRI), such as joint ICA or IVA can help further elucidate the relevance of these regions to patients with SZ.Acknowledgements
No acknowledgement found.References
1. Xie W, Peng C-K, Huang C-C, Lin C-P, Tsai S-J, Yang AC. Functional brain lateralization in schizophrenia based on the variability of resting-state fMRI signal. Prog Neuro-Psychopharmacology Biol Psychiatry 2018. https://doi.org/10.1016/j.pnpbp.2018.05.020.
2. Loeber RT, Cintron CMB, Yurgelun-Todd DA. Morphometry of individual cerebellar lobules in schizophrenia. Am J Psychiatry 2001. https://doi.org/10.1176/appi.ajp.158.6.952.
3. Kasai K, Shenton ME, Salisbury DF, Hirayasu Y, Lee CU, Ciszewski AA, et al. Progressive decrease of left superior temporal gyrus gray matter volume in patients with first-episode schizophrenia. Am J Psychiatry 2003. https://doi.org/10.1176/appi.ajp.160.1.156.
4. Gupta CN, Calhoun VD, Rachakonda S, Chen J, Patel V, Liu J, et al. Patterns of gray matter abnormalities in schizophrenia based on an international mega-analysis. Schizophr Bull 2015. https://doi.org/10.1093/schbul/sbu177.
5. Spalthoff R, Gaser C, Nenadic I. Altered gyrification in schizophrenia and its relation to other morphometric markers. Schizophr Res 2018. https://doi.org/10.1016/j.schres.2018.07.014.
6. Cavelti M, Kircher T, Nagels A, Strik W, Homan P. Is formal thought disorder in schizophrenia related to structural and functional aberrations in the language network? A systematic review of neuroimaging findings. Schizophr Res 2018. https://doi.org/10.1016/j.schres.2018.02.051.
7. Xu L, Groth KM, Pearlson G, Schretlen DJ, Calhoun VD. Source-based morphometry: The use of independent component analysis to identify gray matter differences with application to schizophrenia. Hum Brain Mapp 2009. https://doi.org/10.1002/hbm.20540.
8. Avants BB, Tustison NJ, Song G, Gee JC. ANTS: Open-Source Tools for Normalization And Neuroanatomy. HeanetIe 2009;X:1–11. https://doi.org/10.1007/s12021-011-9109-y.
9. Avants BB, Tustison N, Song G. Advanced Normalization Tools (ANTS). Insight J 2009:1–35.
10. Benjamini Y, Hochberg Y. Controlling the false discovery rate: a practical and powerful approach to multiple testing. J R Stat Soc B 1995:289–300. https://doi.org/10.2307/2346101.
11. Kay SR, Fiszbein A, Opler LA. The positive and negative syndrome scale (PANSS) for schizophrenia. Schizophr Bull 1987. https://doi.org/10.1093/schbul/13.2.261.
12. Holm S. A Simple Sequentially Rejective Multiple Test Procedure. Scand J Stat 1979. https://doi.org/10.2307/4615733.
13. Giraud AL, Price CJ. The constraints functional neuroimaging places on classical models of auditory word processing. J Cogn Neurosci 2001. https://doi.org/10.1162/08989290152541421.
14. Hein G, Knight RT. Superior temporal sulcus - It’s my area: Or is it? J Cogn Neurosci 2008. https://doi.org/10.1162/jocn.2008.20148.
15. DeWitt I, Rauschecker JP. Phoneme and word recognition in the auditory ventral stream. Proc Natl Acad Sci 2012. https://doi.org/10.1073/pnas.1113427109.
16. DeWitt I, Rauschecker JP. Wernicke’s area revisited: Parallel streams and word processing. Brain Lang 2013. https://doi.org/10.1016/j.bandl.2013.09.014.
17. Sokolov AA, Erb M, Grodd W, Pavlova MA. Structural loop between the cerebellum and the superior temporal sulcus: Evidence from diffusion tensor imaging. Cereb Cortex 2014. https://doi.org/10.1093/cercor/bhs346.
18. Ellison-Wright I, Bullmore E. Meta-analysis of diffusion tensor imaging studies in schizophrenia. Schizophr Res 2009. https://doi.org/10.1016/j.schres.2008.11.021.
19. Schmahmann JD. The cerebellum and cognition. Neurosci Lett 2018. https://doi.org/https://doi.org/10.1016/j.neulet.2018.07.005.
20. Riva D, Giorgi C. The cerebellum contributes to higher functions during development: evidence from a series of children surgically treated for posterior fossa tumours. Brain 2000;123 ( Pt 5:1051–61.
Figures