2747
A study of neurite orientation dispersion and density imaging in ischemic stroke1Radiology, Tongji Hospital, Tongji Medical College, Huazhong University of Science and Technology, Wuhan, China, 2GE Healthcare China, Beijing, China
Synopsis
Neurite orientation dispersion and density imaging (NODDI) can quantitatively evaluate specific microstructural changes in terms of neurite density and orientation distribution of axons and dendrites. In the study, we attempt to demonstrate the feasibility of NODDI in characterizing the microstructural alterations in brain tissues during ischemic stroke and to compare its sensitivity with diffusion tensor imaging and diffusion kurtosis imaging. Results demonstrated that NODDI is a potential technique for quantitatively evaluating ischemic stroke and showed higher sensitivity compared with diffusion tensor imaging (DTI) and diffusion kurtosis imaging (DKI).
Introduction
To demonstrate the feasibility of the neurite orientation dispersion and density imaging (NODDI) technique in characterizing the microstructural changes of brain tissues during ischemic stroke and to compare its sensitivity with diffusion tensor imaging (DTI) and diffusion kurtosis imaging (DKI).Methods
Seventy-one patients with ischemic stroke were divided into hyperacute/acute/subacute groups according to previous studies. 1 A multishell diffusion magnetic resonance imaging protocol was performed for each subject along 25 noncollinear directions at 3 b-values (0, 1250, and 2500 s/mm2). Diffusion data were analyzed using the NODDI and diffusional kurtosis estimator toolboxes. Then, NODDI metrics (Vic, which describes the density of the axons and dendrites; ODI, which describes the degree of the bending and fanning of axons and dendrites that are widespread throughout the white matter and gray matter; and Viso, which describes the cerebrospinal fluid volume fraction) between the lesions and the contralateral tissues were compared to evaluate their values in ischemic stroke. 2 NODDI metrics among different patient groups and the correlations between NODDI and the duration since stroke onset were analyzed as well. To compare the diagnostic sensitivity of NODDI with DTI/DKI, paired t-tests were performed on absolute percentage changes of diffusion metrics between NODDI and DTI/DKI. The percentage changes of the different diffusion metrics from normal to ischemic areas were computed as [(L – C)/C] × 100%, where L and C denote the mean values of the lesions and contralateral tissues, respectively. Moreover, the relative NODDI (rNODDI) metrics (relative Vic [rVic], relative ODI [rODI], and relative Viso [rViso]) from normal to ischemic areas were computed as L/C to standardize the NODDI metric values and partly eliminate the effect of different brain volumes on the assessment of NODDI metrics.Results
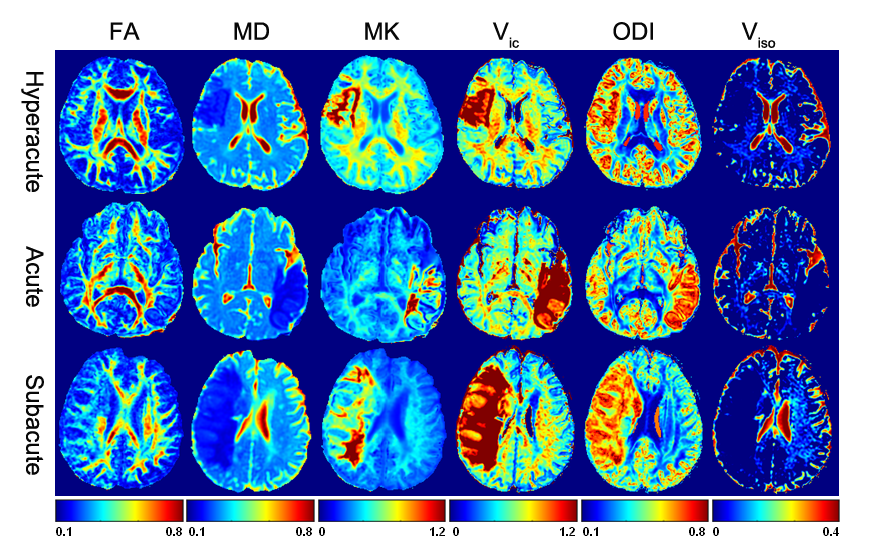
Parametric maps of NODDI (Vic, ODI, and Viso), DTI (FA, fractional anisotropy; MD, mean diffusivity), and DKI (MK, mean kurtosis) were generated from each subject. Representative parametric maps for typical subjects in different periods are illustrated in Figure 1. It was shown that ischemic areas had apparent heterogeneous and high signal on the ODI and Vic maps and hypointensity on the Viso map. MK showed heterogeneous hyperintensity; FA and MD showed hypointensity in lesions.
NODDI metrics in lesions were significantly different from those in contralateral normal tissues. The values of Vic and ODI in lesion areas increased significantly (P < 0.05, respectively), whereas the Viso value decreased significantly compared with contralateral regions (P < 0.05).
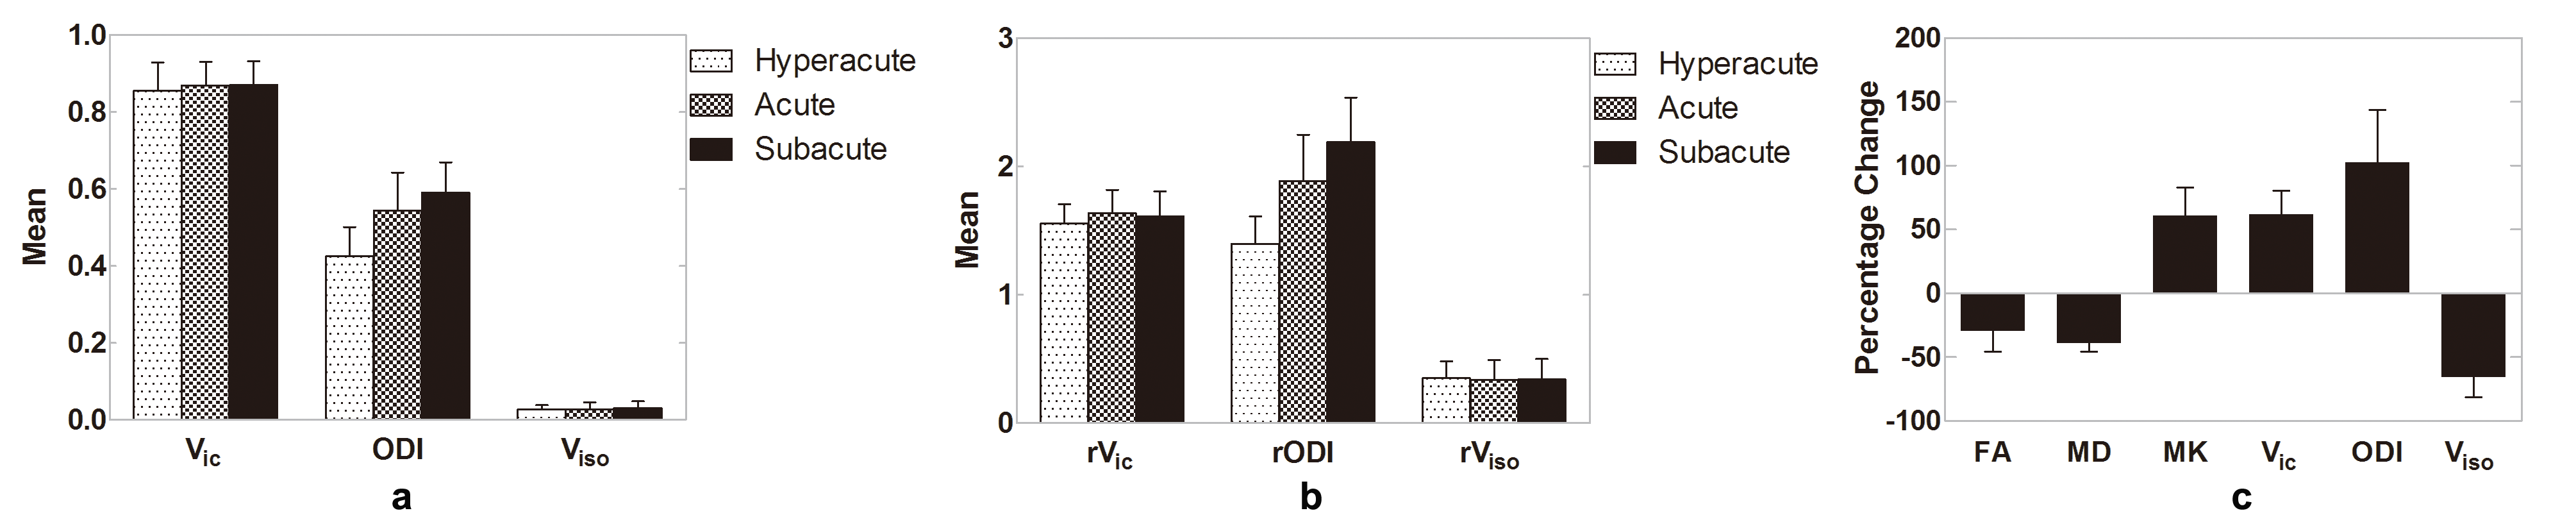
A significant intergroup difference was found for the ODI value. From the hyperacute to subacute periods, the ODI value increased and reached the peak at the subacute period (0.426 ± 0.076, 0.544 ± 0.099, and 0.590 ± 0.080; P < 0.05). There were no significant intergroup differences for Vic or Viso values (P = 0.860 and P = 0.620, respectively; Figure 2a). The rNODDI metrics had similar results, as shown in Figure 2b.
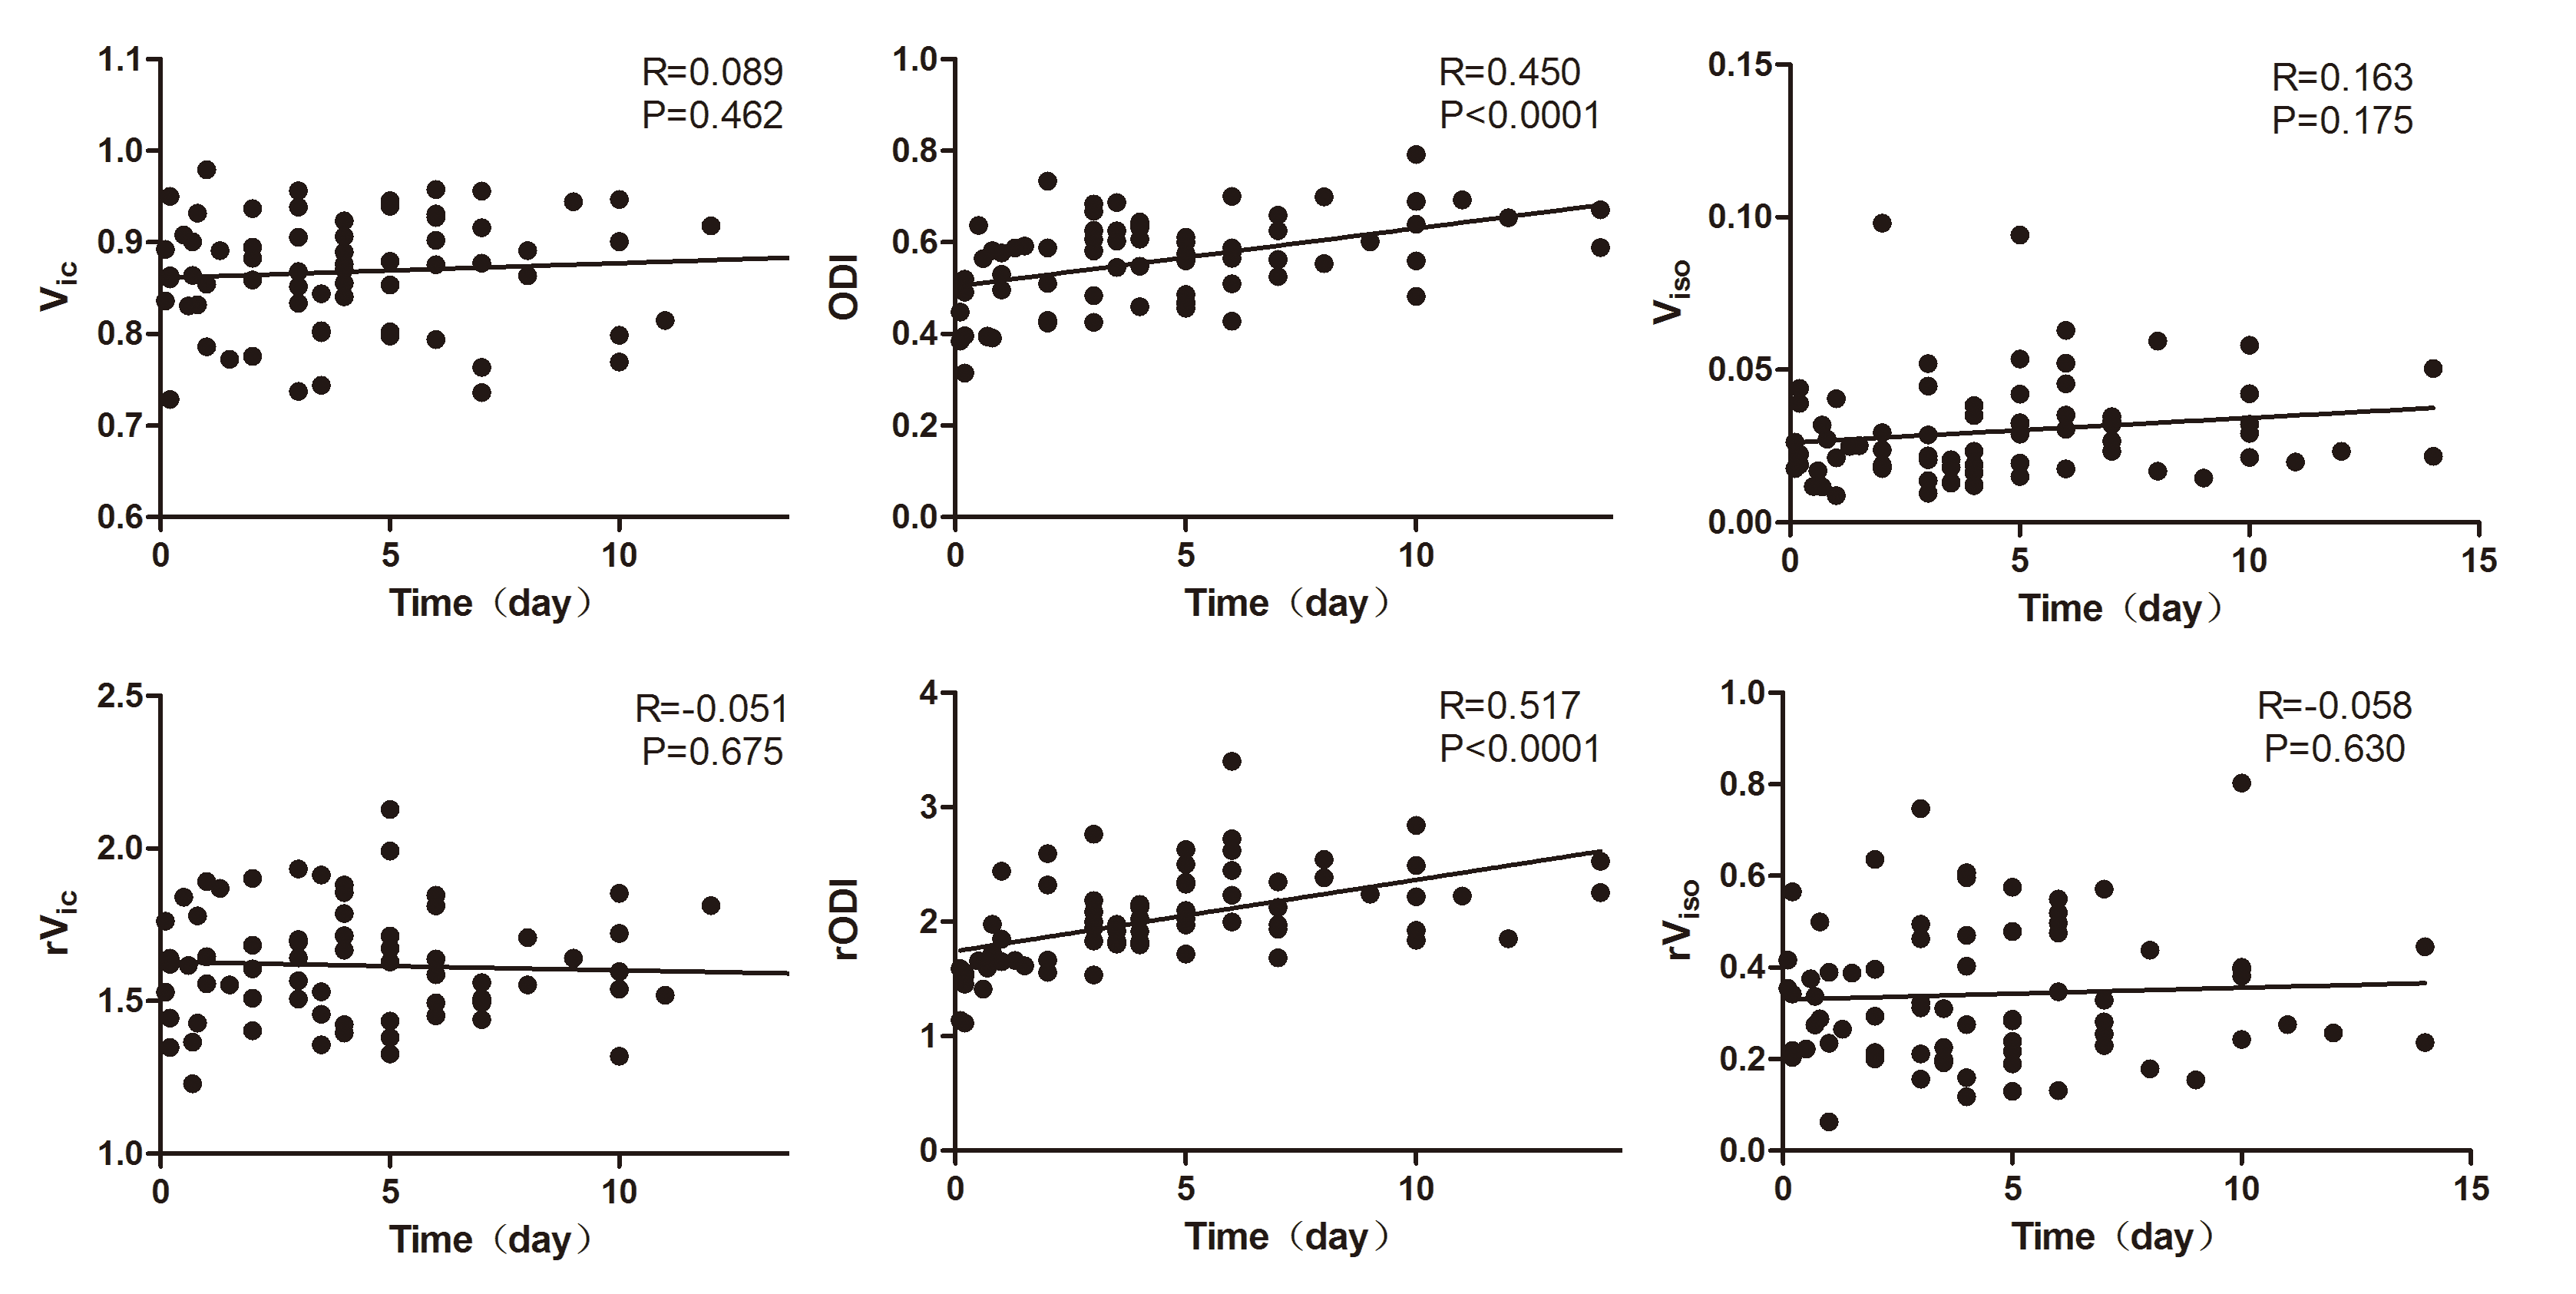
The value of ODI showed a fair to good positive correlation with the duration since stroke onset (R = 0.450, P < 0.05), whereas the Vic and Viso value showed no significant correlation with the time since stroke onset (R = 0.089, P = 0.462; R = 0.163, P = 0.175). The rNODDI metrics showed consistent results (Figure 3).
As shown in Figure 2c, in 71 patients with hyperacute/acute/subacute ischemic stroke, NODDI metrics (Vic, ODI, and ) had significantly increased absolute percentage changes compared with FA and MD metrics (P < 0.05, respectively), and the percentage change of ODI was significantly larger than MK (P < 0.05).
Discussion
In the present study, we demonstrated that the use of NODDI is feasible for the evaluation ischemic stroke. The ODI value showed a significant difference between hyperacute, acute, and subacute periods and had a fair to good positive correlation with the duration since stroke onset. Compared with DTI and DKI metrics, NODDI exhibited increased sensitivity in describing brain tissue microstructural changes and in investigating ischemic stroke.Conclusion
NODDI allowed efficient evaluation of microstructural changes in brain tissues during ischemic stroke and showed increased sensitivity compared with DTI and DKI. The possible biophysical mechanisms underlying ischemia could be further elucidated using this advanced diffusion technique.Acknowledgements
No acknowledgement found.References
1. Zhang S, Zhu W, Zhang Y, et al. Diffusional kurtosis imaging in evaluating the secondary change of corticospinal tract after unilateral cerebral infarction. Am J Transl Res. 2017;9(3):1426-1434.
2. Zhang H, Schneider T, Wheeler-Kingshott CA, et al. NODDI: practical in vivo neurite orientation dispersion and density imaging of the human brain. Neuroimage. 2012;61(4):1000-1016.
Figures