2743
Disrupted structural brain network configuration in patients with post-stroke depression1Department of Radiology, The Second Affiliated Hospital of Zhejiang University School of Medicine, Hangzhou, China, 2Department of Medical Imaging, Sun Yat-sen University Cancer Center, Guangzhou, China, 3Department of Radiology, Zhejiang Provincial Hospital of Chinese Medicine, Hangzhou, China
Synopsis
To better understand the underlying mechanisms for a wide range of emotional disturbances in post-stroke depression (PSD) patients, we used structural brain connectivity analysis to investigate the differences in global and local network organization of stroke patients with PSD and no PSD. Our results demonstrated that the efficiency of both local and regional network of patients with PSD were higher compared to those without, and that higher depression severity was significantly associated with increased network efficiency. These results indicated that the disrupted network architecture might be the cause of depressive symptoms in PSD patients, and brain network analysis is a useful tool to link psychological disorders with their underlying anatomical substrate.
Purpose
An estimated of 30-35% of the stroke patients suffer from post-stroke depression (PSD) after stroke insult and their quality of life is greatly affected by a wide range of emotional disturbances 1. Despite of the great clinical importance of PSD, it was often neglected and showed no agreement on the casual mechanisms. Considering that disease management largely depends on the understanding of pathological mechanisms, we therefore aim to investigate the structural network alterations in patients with PSD when compared to post stroke patients with no depression (PSND), and their relations with depression severity.Materials and methods
Participants 31 PSD patients (64 ± 10 years old) and 23 PSND patients (67 ± 12 years old) without any neurological or neuropsychological disorders were recruited.
Image acquisition Two b0 images and diffusion-weighted images with b-values = 1000 s/mm2 along 59 directions were acquired using single-shot EPI sequence (Siemens Verio 3-tesla system; Erlangen, Germany).
Post-processing High resolution anatomical images were segmented into 90 brain regions according to AAL atlas. Whole-brain tractography was obtained using Diffusion Toolkit (trackvis.org/dtk/). Structural network was estimated by counting the number of fiber tracts traversed any pairs of two regions.
Network analysis Global network topological properties, including global efficiency and local efficiency, and regional network measures were obtained using the Brain Connectivity Toolbox 2.
Statistical analysis Independent-samples t-test was used to test the difference in network measures between patients with PSD and PSND. The associations between network measures and the depression level of patients, measured by Hamilton Depression Rating Scale (HAMD), were investigated using Spearman’s rank correlation. Correction for multiple comparison was performed using Bonferroni-correction.
Results
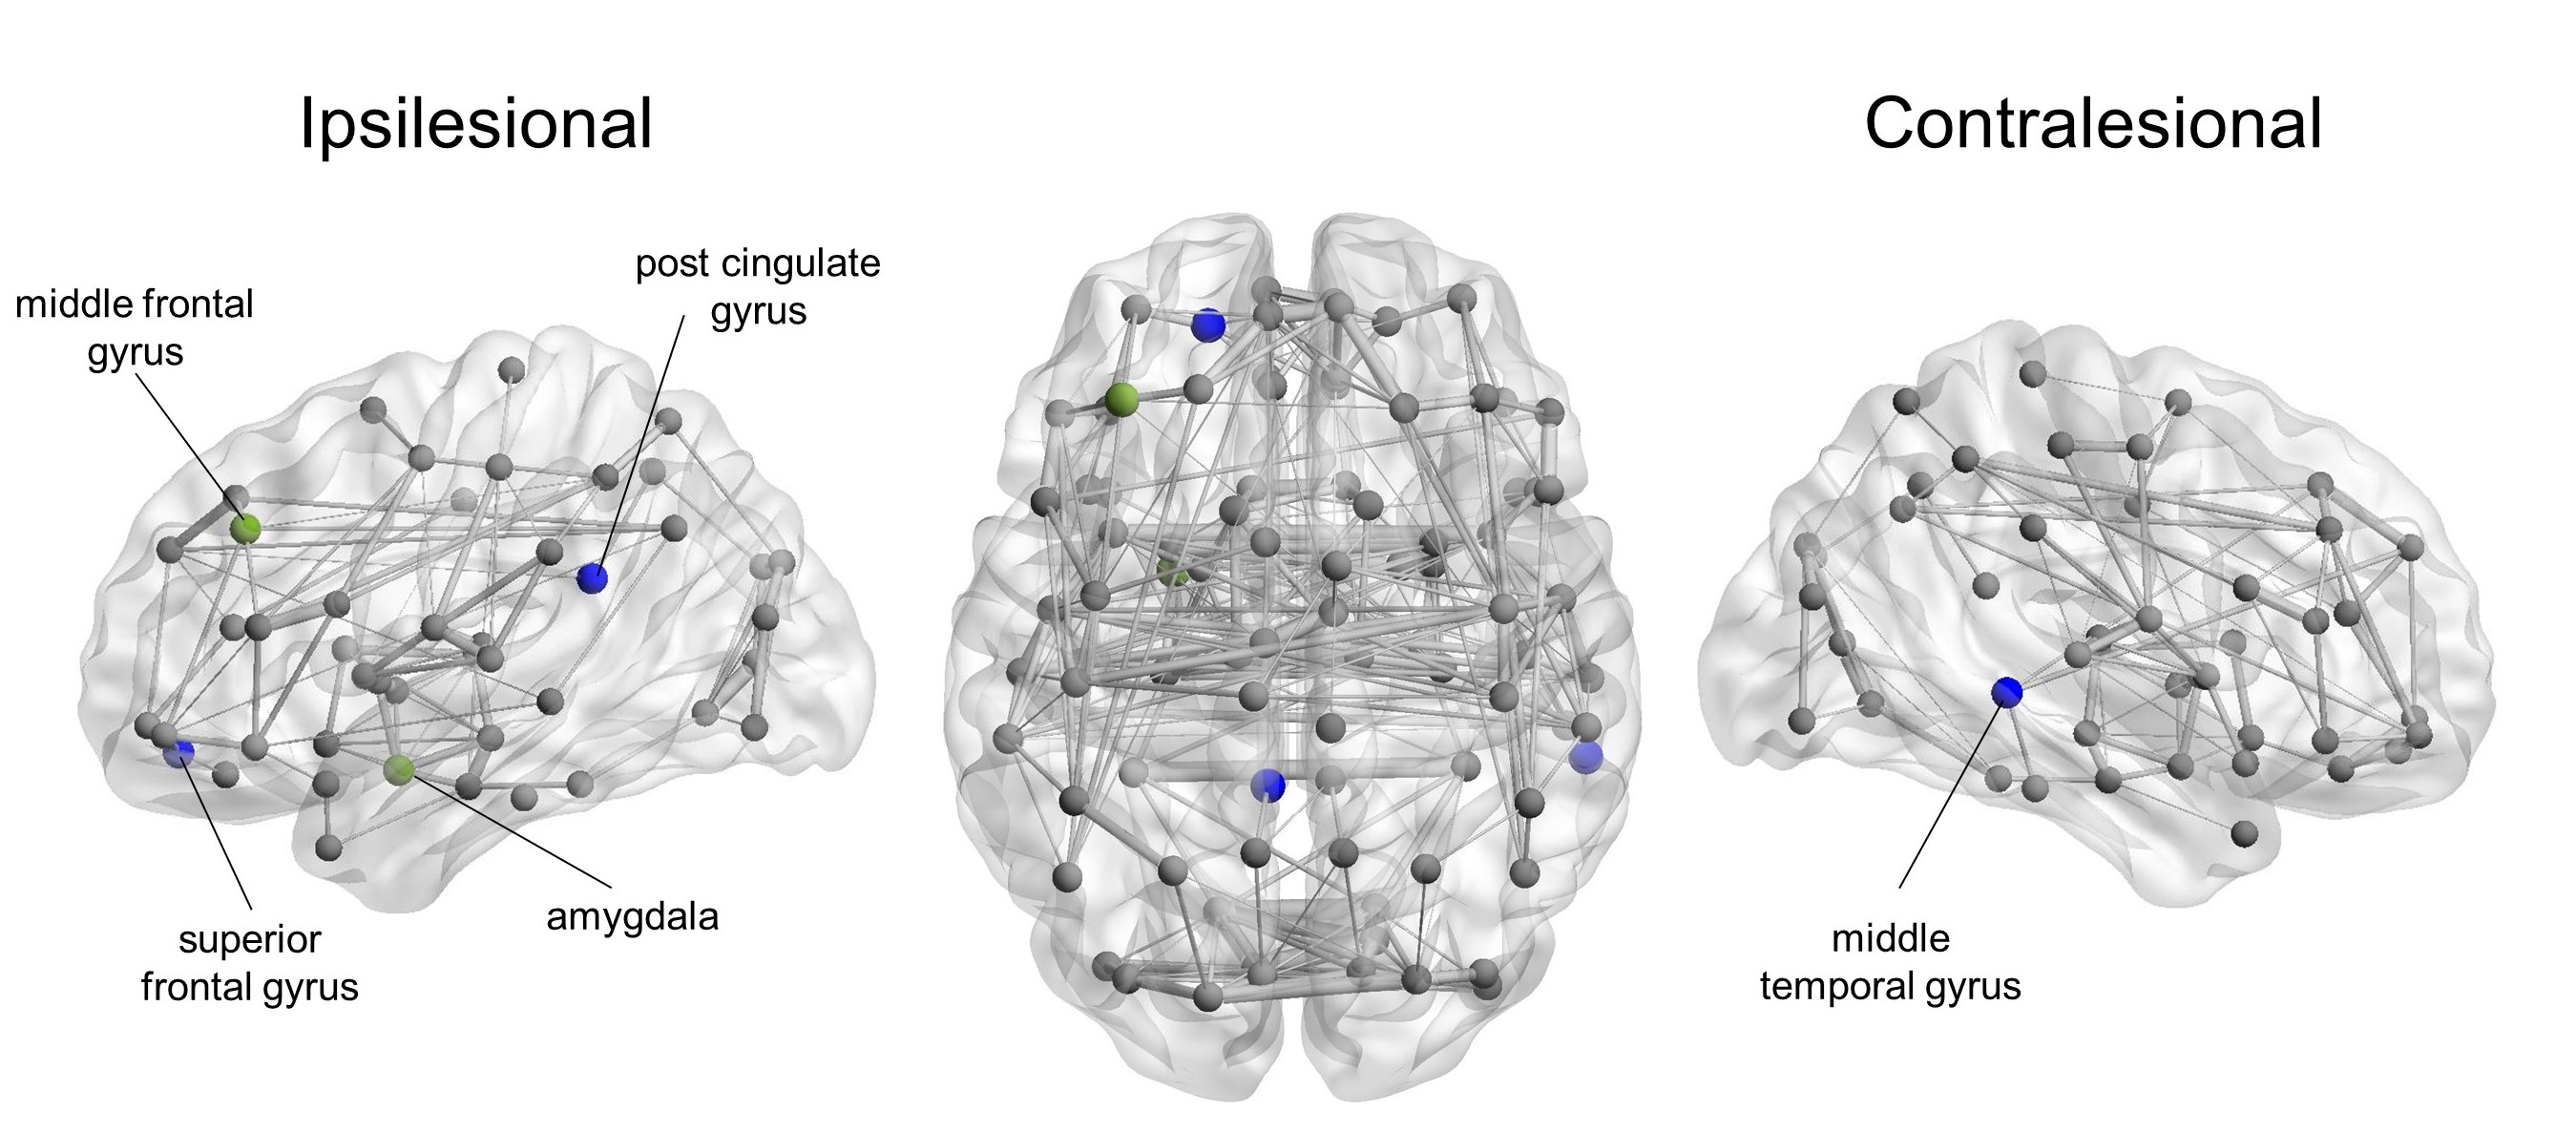
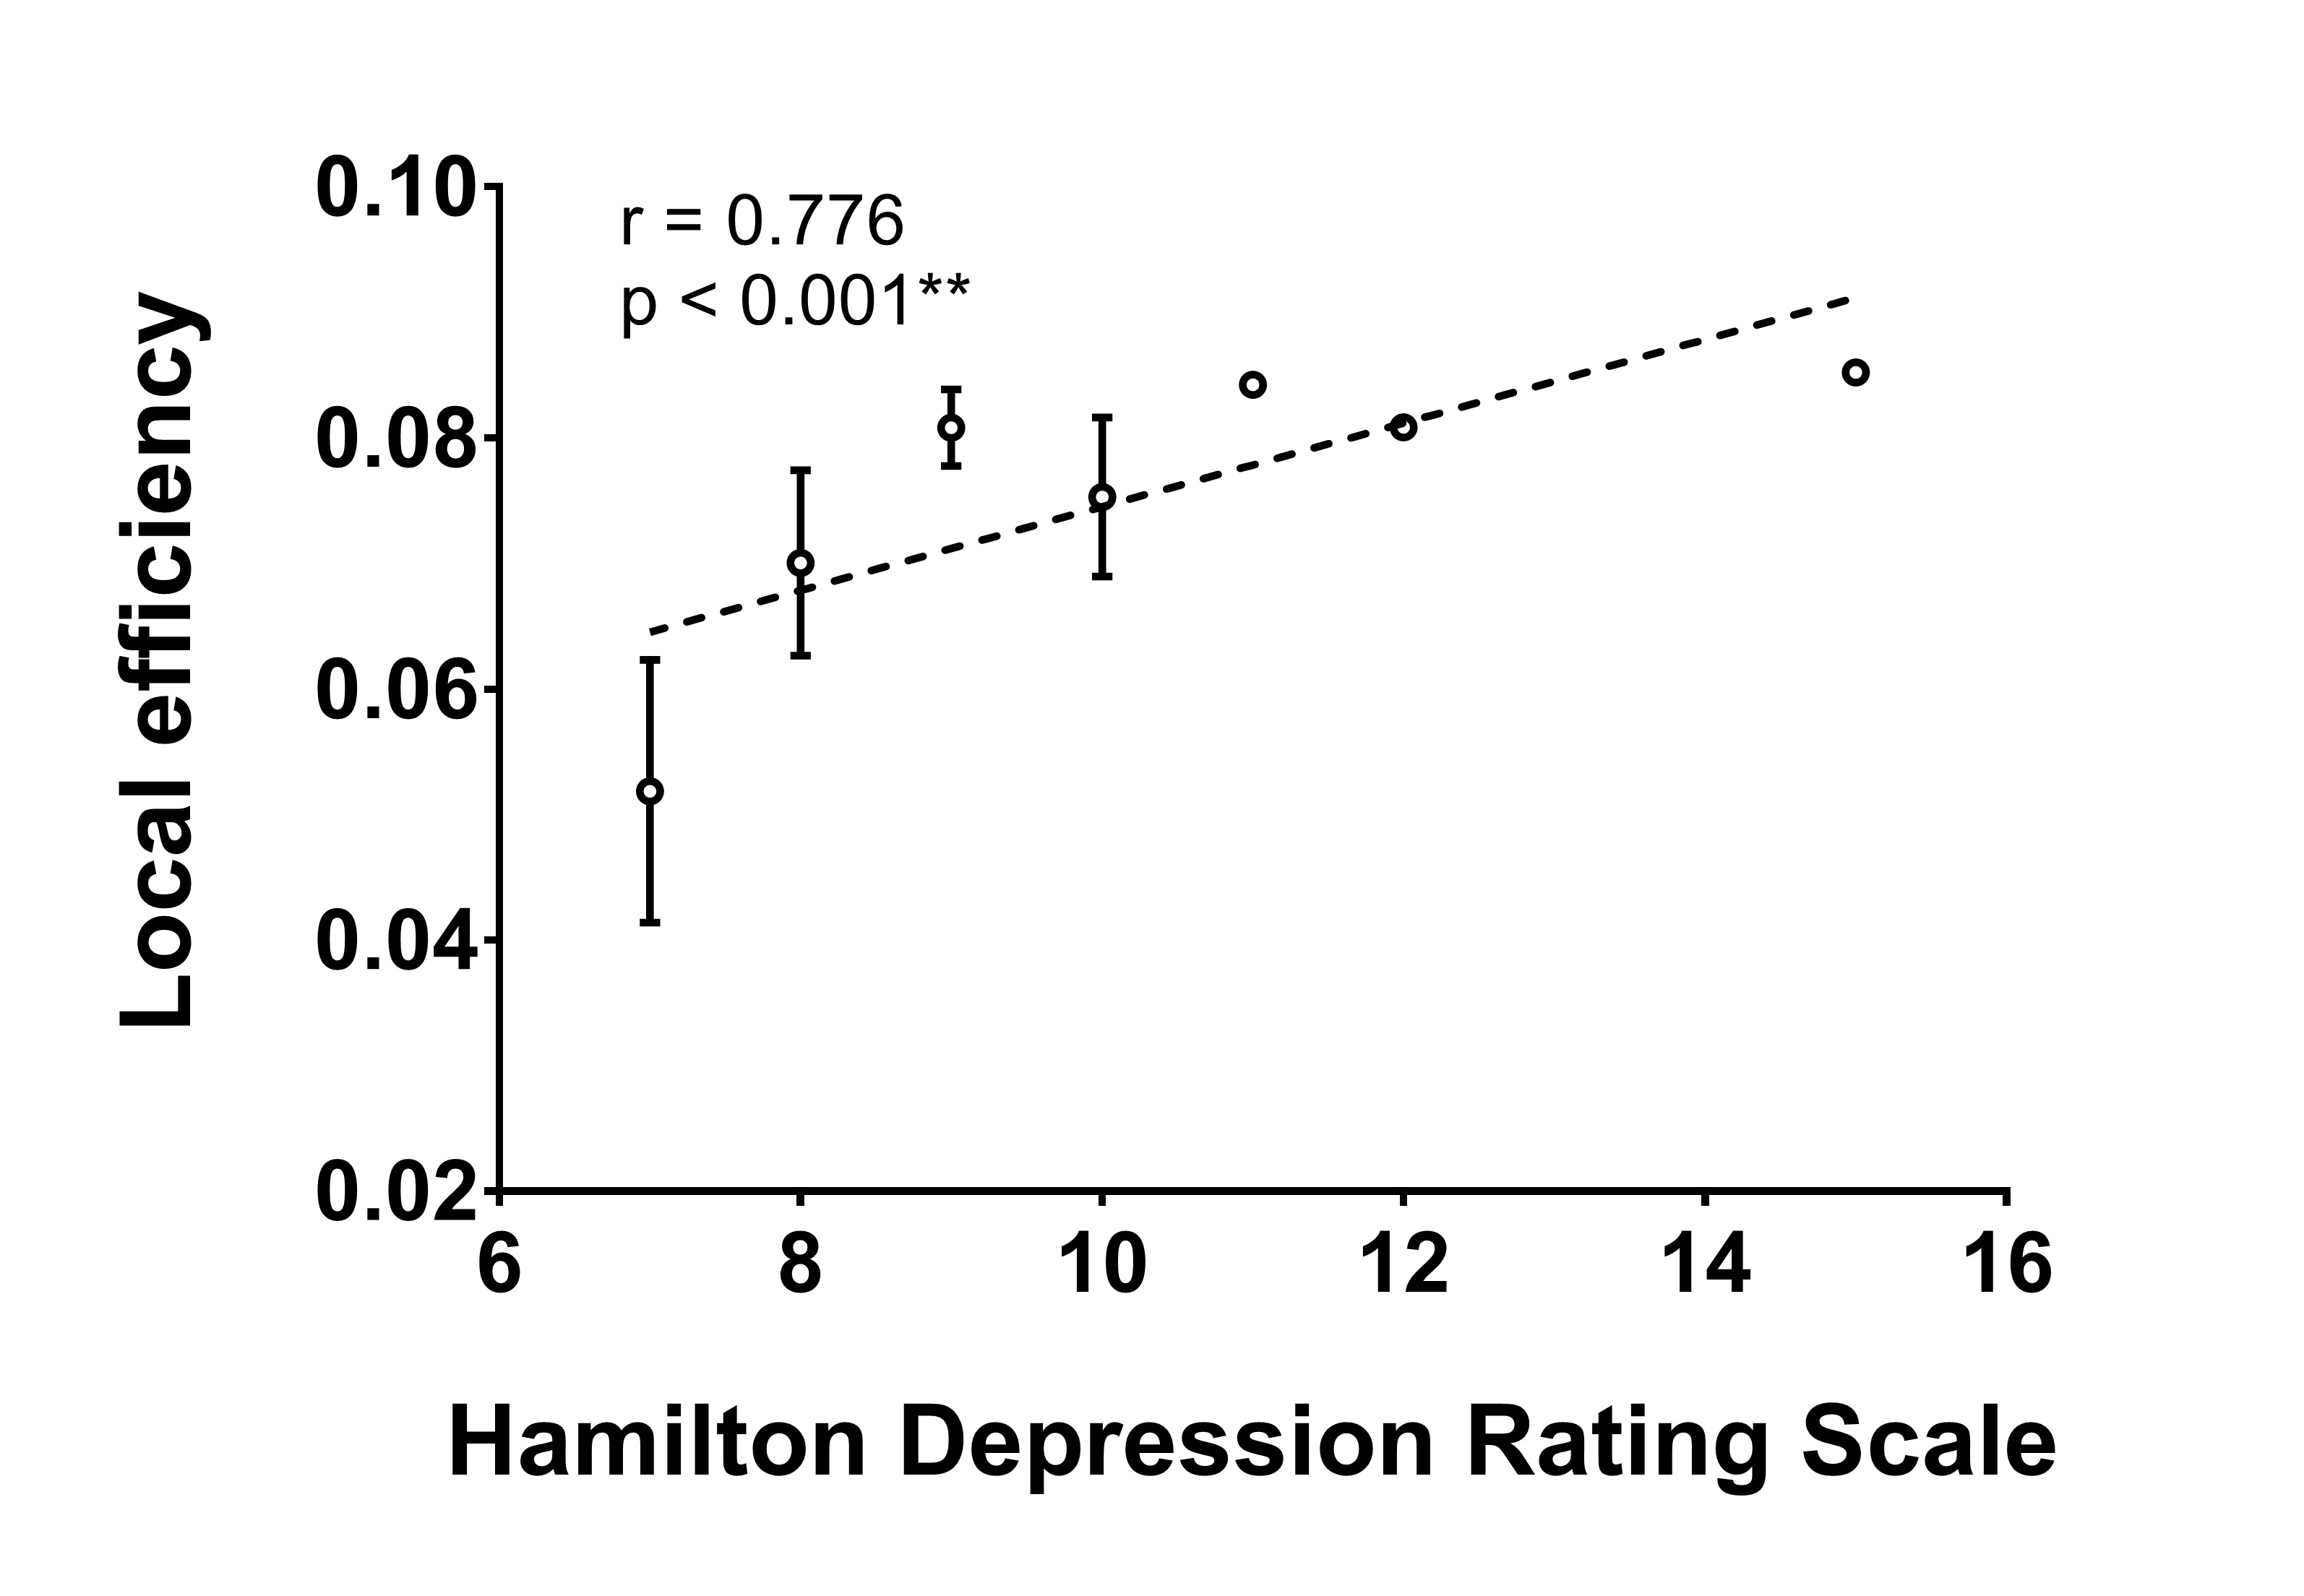
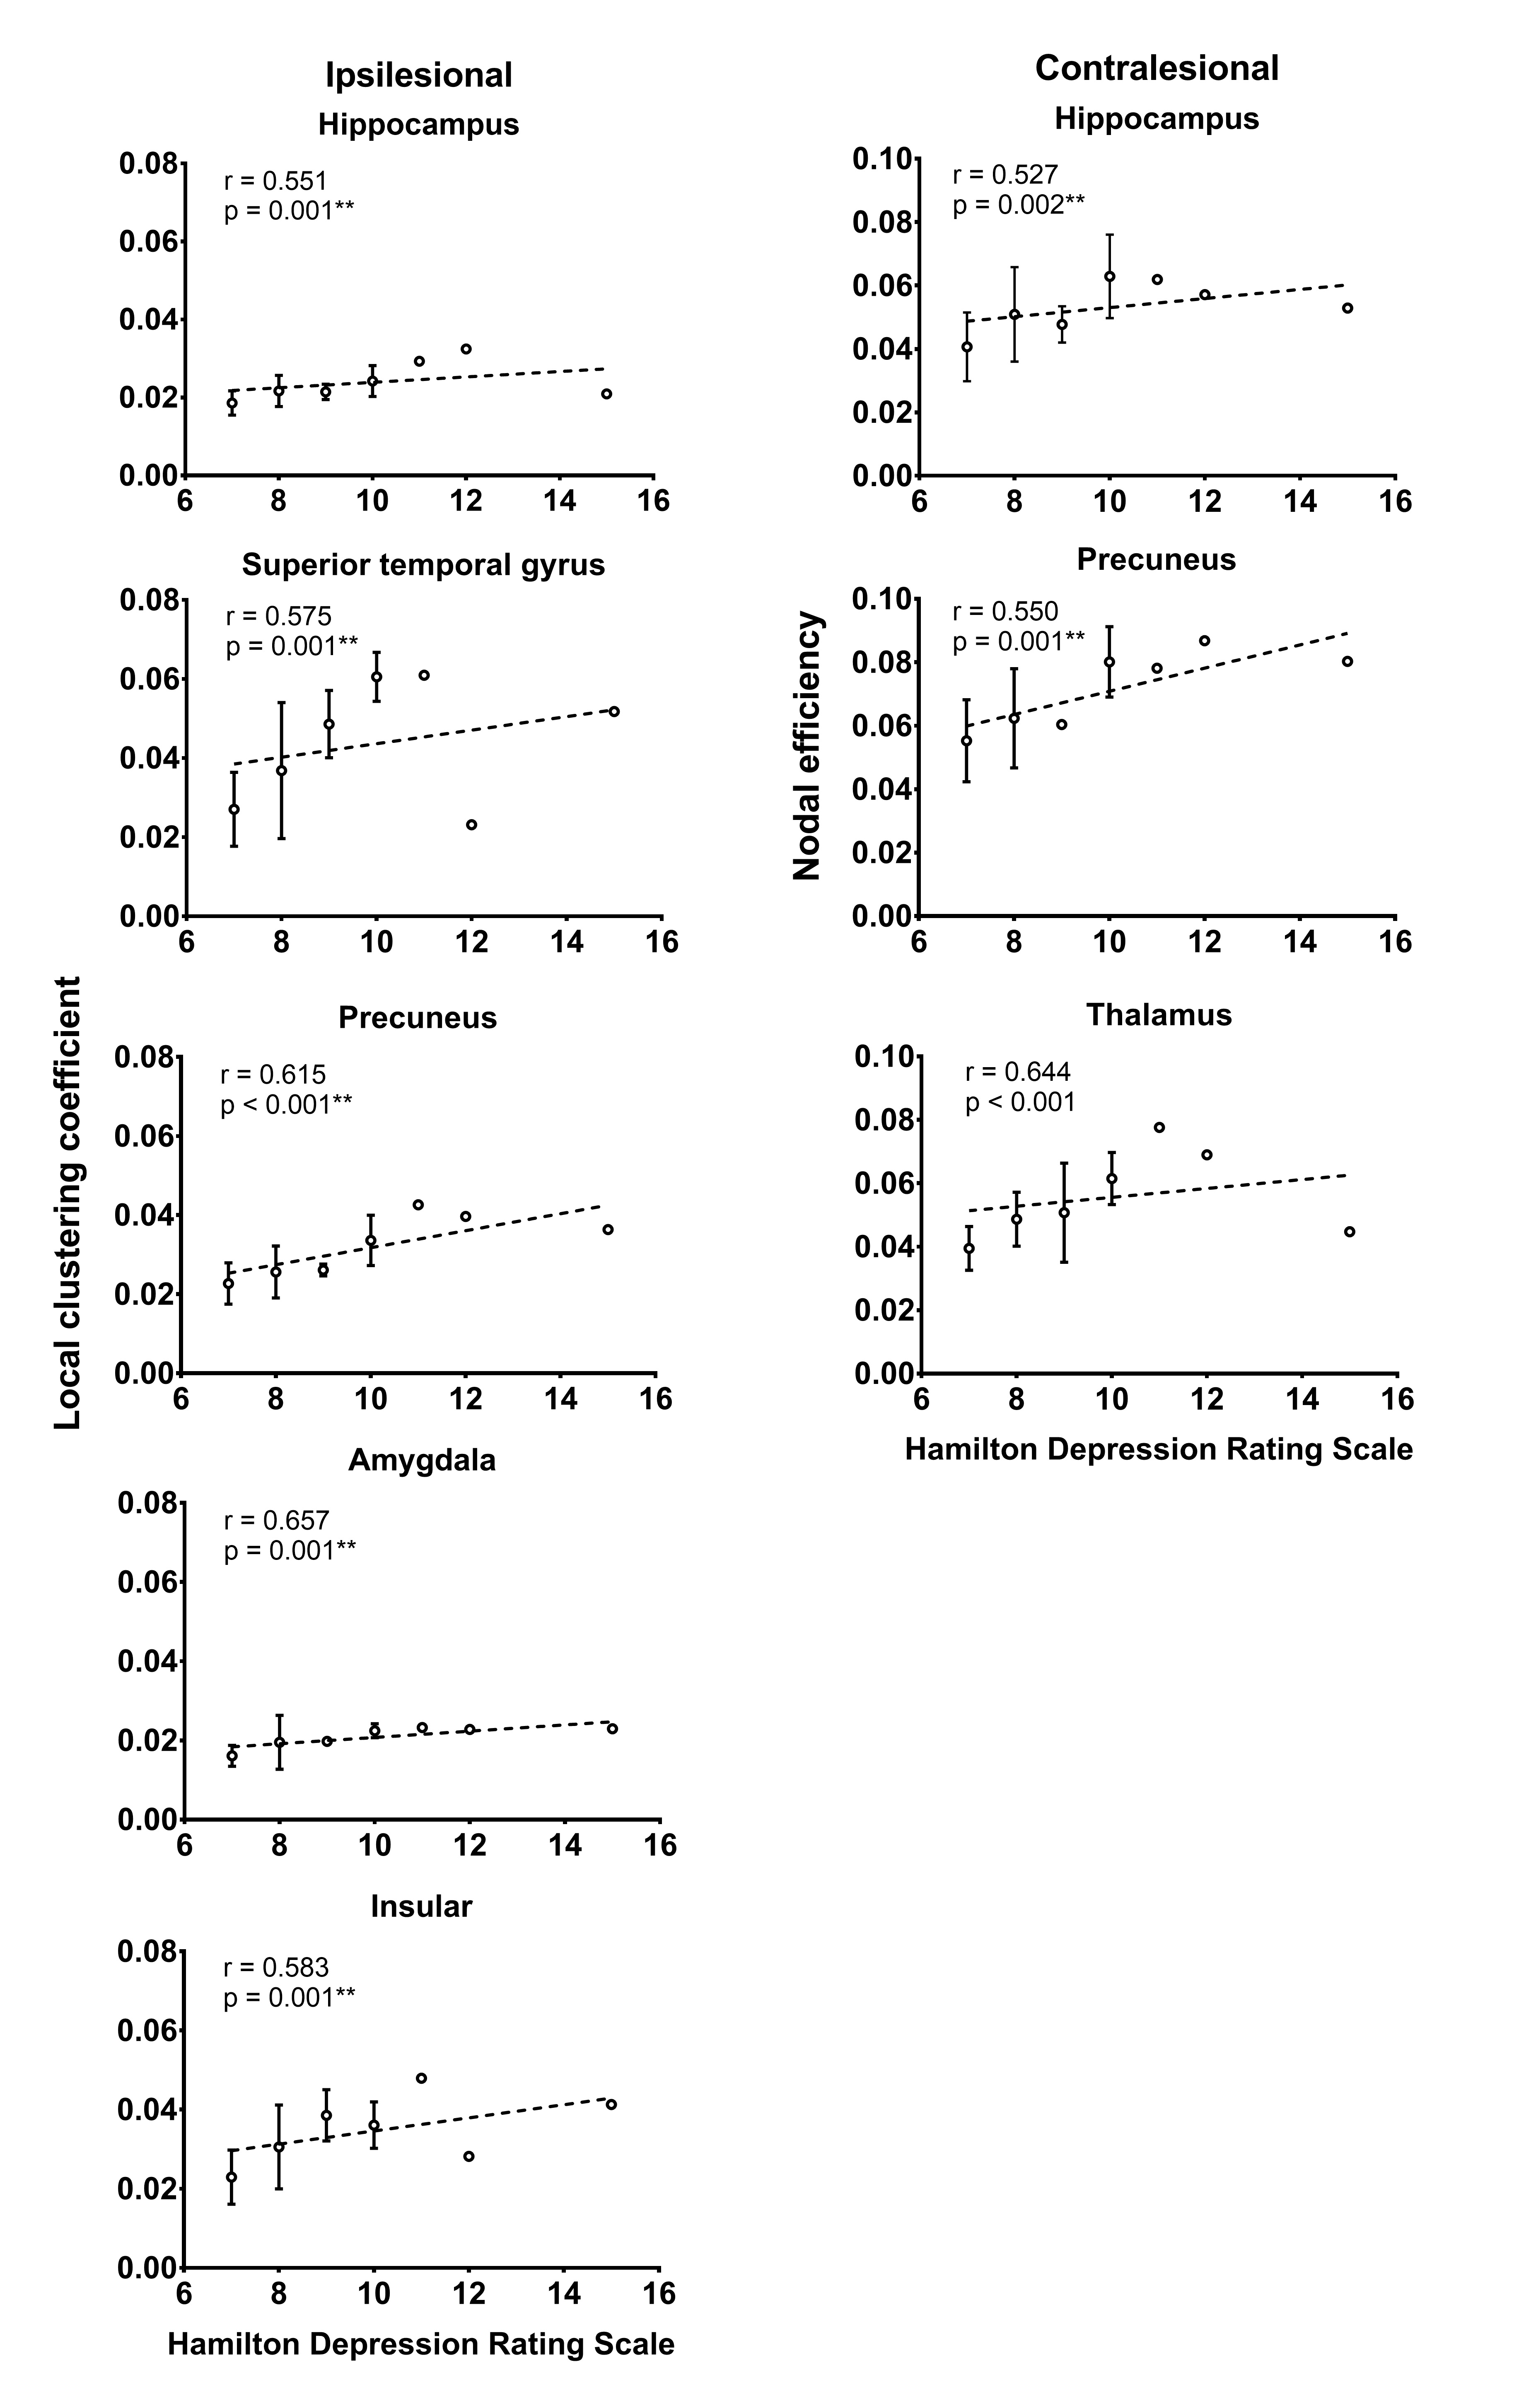
Significantly higher local efficiency (p < 0.001) was observed in patients with PSD compared to PSND patients. Higher nodal degree in ipsilesional superior frontal gyrus (p < 0.001), post cingulate gyrus (p < 0.001) and contralesional middle temporal gyrus (p < 0.001) as well as lower nodal efficiency in ipsilesional middle frontal gyrus (p< 0.001), post cingulate gyrus (p < 0.001) and amygdala (p = 0.001) were also found in patients with PSD (Figure 1). More importantly, the local efficiency (r = 0.776, p < 0.001) were correlated with HAMD (Figure 2) in patients with PSD. The local clustering coefficient of ipsilesional superior temporal gyrus (r = 0.575, p = 0.001), precuneus (r = 0.615, p < 0.001), hippocampus (r = 0.551, p = 0.001), amygdala (r = 0.657, p = 0.001), insular (r = 0.583, p = 0.001) and the nodal efficiency of contralesional hippocampus (r = 0.527, p = 0.002), thalamus (r = 0.644, p < 0.001), precuneus (r = 0.550, p = 0.001) were also associated with HAMD (Figure 3).Discussion
The balance between functional integration and functional segregation is one of the most essential goals a brain network needs to maintain for supporting psychological stability 3. In the current study, the structural network of patient with PSD had significantly high local efficiency, indicating that the connections among regions that are anatomically close or serving similar functions became more clustered within communities 4, potentially related to the emotional disorders of these patients 5. Our results showed certain consistency with a previous study conducted in patients with major depressive disorder which showed significant increase in local efficiency in those patients 6. In addition to global network changes, disrupted nodal characteristics were also found in multiple brain regions that reside in the cognitive and limbic system. Considering the important role that limbic system plays in emotional regulation, these local network changes may explain the mood disturbances 7 in these patients, and further supported the idea that disrupted structural brain connections might be the most important underlying mechanism behind PSD 8. More importantly, we found that higher local efficiency and regional network features were associated with greater depression level, measured by HAMD. Considering that HAMD indicates depression severity and is considered a guide to evaluate recovery 9, the association between network measures and HAMD that we observe may serve as an evidence for the notion that disrupted balance between functional integration and segregation might be cause to emotional disturbance in PSD.Conclusion
Our findings showed that PSD patients exhibit a disrupted balance between functional segregation and integration in the topological organization of structural brain networks. More importantly, this altered network configuration with greater functional segregation may contribute to the depressive symptoms in PSD.Acknowledgements
No acknowledgement found.References
1. Lenzi GL, Altieri M, Maestrini I. Post-stroke depression. Rev Neurol (Paris) 2008;164:837–40.
2. Bullmore E, Sporns O. Complex brain networks: graph theoretical analysis of structural and functional systems. Nat Rev Neurosci 2009;10:186–98.
3. Sporns O. Network attributes for segregation and integration in the human brain. Curr Opin Neurobiol 2013;23:162–71.
4. Achard S, Bullmore E. Efficiency and Cost of Economical Brain Functional Networks. PLoS Comput Biol 2007;3:e17.
5. Gaete JM, Bogousslavsky J. Post-stroke depression. Expert Rev Neurother 2008;8:75–92.
6. Ye M, Qing P, Zhang K, et al. Altered network efficiency in major depressive disorder. BMC Psychiatry 2016;16:450.
7. Anthes E. Depression: A change of mind. Nature 2014;515:185–7.
8. Yang S, Hua P, Shang X, et al. A significant risk factor for poststroke depression: the depression-related subnetwork. J Psychiatry Neurosci 2015;40:259–68.
9. Williams JB. Standardizing the Hamilton Depression Rating Scale: past, present, and future. Eur Arch Psychiatry Clin Neurosci 2001;251 Suppl 2:II6-12.
Figures