2732
Diffusion lesion segmentation with deep learning in acute ischemic stroke: A combined use of DWI and ADC1Clinical Research Institute, Samsung Medical Center, Sungkyunkwan Univ., Seoul, Korea, Republic of, 2Department of Neurology, Samsung Medical Center, Sungkyunkwan Univ., Seoul, Korea, Republic of, 3Department of Biomedical Engineering, Korea University, Seoul, Korea, Republic of
Synopsis
Conventional deep learning methods for cerebral infarct segmentation rely on diffusion weighted images (DWI) only. Meanwhile, traditional cerebral diffusion lesion segmentation is typically based on a fixed apparent diffusion coefficient (ADC) threshold. It may be worthwhile to combine DWI and ADC images and use them as input for model training. The objective of this study is to develop a deep-learning segmentation model that takes DWI and ADC as input and produces a segmentation map as output and evaluate its performance.
Introduction
Diffusion weighted imaging (DWI) allows sensitive visualization of ischemic core in acute ischemic stroke patients. The clinical importance of DWI has been growing, since DWI lesion volume is highly associated with treatment decision and clinical outcome.1,2 Physicians are seeking fast and accurate ways to measure the lesion volume. Recent deep learning methods for cerebral infarct segmentation rely on DWI (e.g., b-value = 1000 s/mm2) images only.3,4 Meanwhile, traditional cerebral infarct segmentation is typically based on a fixed apparent diffusion coefficient (ADC) threshold, for example, in the RAPID software.5 It may be worthwhile to combine DWI and ADC images and use them as input for deep learning model training. This study aims to develop a deep-learning segmentation model that takes DWI and ADC as input and produces a segmentation map as output.Methods
MRI data were retrospectively collected from 430 subjects who had symptoms of acute ischemic stroke and underwent MRI scans including a DWI sequence at two different b-values, 0 and 1000 s/mm2. A majority (85%) of the subjects' images were acquired using a Philips 3T scanner. ADC images were computed based on pixel-wise fitting. A total of 296 subjects were used for training and validation, while 134 subjects were used for testing. An expert neurologist labeled the infarct masks based on clinical history, DWI, and ADC images. The infarct mask delineation served as reference.
DWI and ADC images were normalized as follows:
$$DWI_{n}(x,y)=\frac{DWI(x,y)-M_{DWI,tissue}}{SD_{DWI,tissue}}$$
where $$$M_{DWI,tissue}$$$ and $$$SD_{DWI,tissue}$$$ are the mean and standard deviation of diffusion weighted image from the voxels corresponding to healthy brain tissue. $$$DWI$$$ is original DWI b=1000 image, and $$$DWI_{n}$$$ is normalized DWI b=1000 image.
$$ADC_{n}(x,y)=\frac{ADC(x,y)-T_{ADC}}{SD_{ADC,tissue}}$$
where $$$T_{ADC}$$$ is ADC threshold and $$$SD_{ADC,tissue}$$$ is the standard deviation of ADC image from the voxels corresponding to healthy brain tissue. $$$ADC$$$ is original ADC image, and $$$ADC_{n}$$$ is normalized ADC image.
U-net was adopted for segmentation.6 Two models were considered: (a) U-net DWI and (b) U-net DWI+ADC. U-net DWI took $$$DWI_{n}$$$ as input and produced segmentation map as output. U-net DWI+ADC took $$$DWI_{n}$$$ and $$$ADC_{n}$$$ as input and produced segmentation map as output. Implementation was based on Dong et al.’s implementation7 and tested on an 8 GB GPU. For training we used the following parameters: epochs=1000, batch_size=10, Adam optimizer with learning rate = 0.0001 and beta = 0.9. The (1-Dice score) loss, referred to as Dice loss, was plotted with respect to epochs. After training, we saved the U-net models and used them for automatic lesion segmentation in testing.
Results
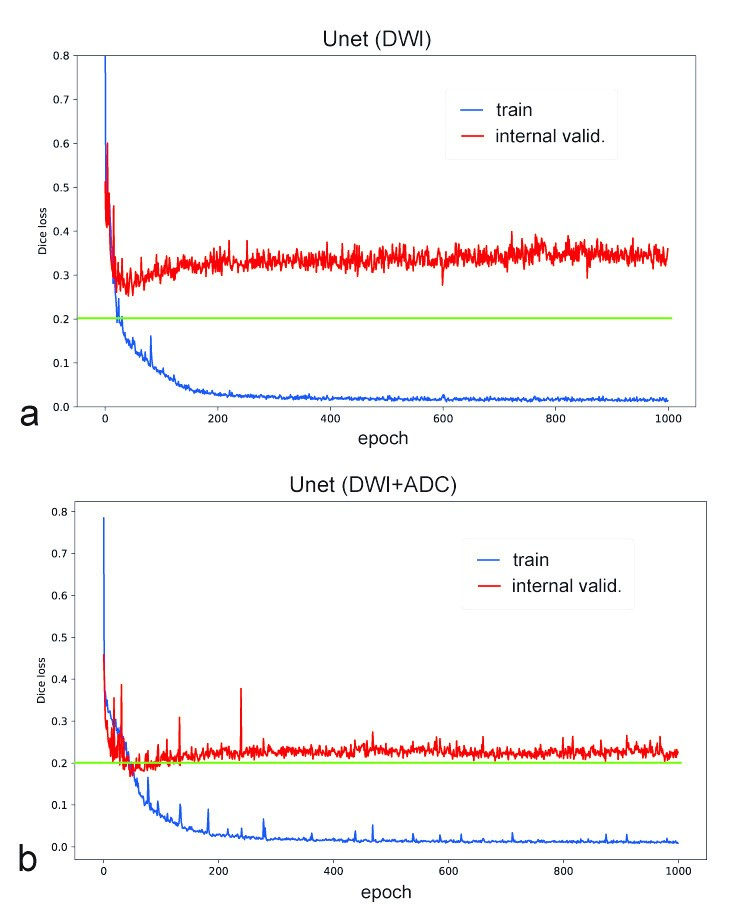
Figure 1 shows training and internal validation results for U-net DWI and U-net DWI+ADC models. Both produce similar Dice loss curves for the training, but different Dice loss curves for the internal validation, where Dice loss was ~0.33 for the U-net DWI and ~0.22 for the U-net DWI+ADC. Both loss curves were stable after 400 epochs, without noticeable overfittings. Dice loss of U-net DWI showed more fluctuations than that of U-net DWI+ADC.
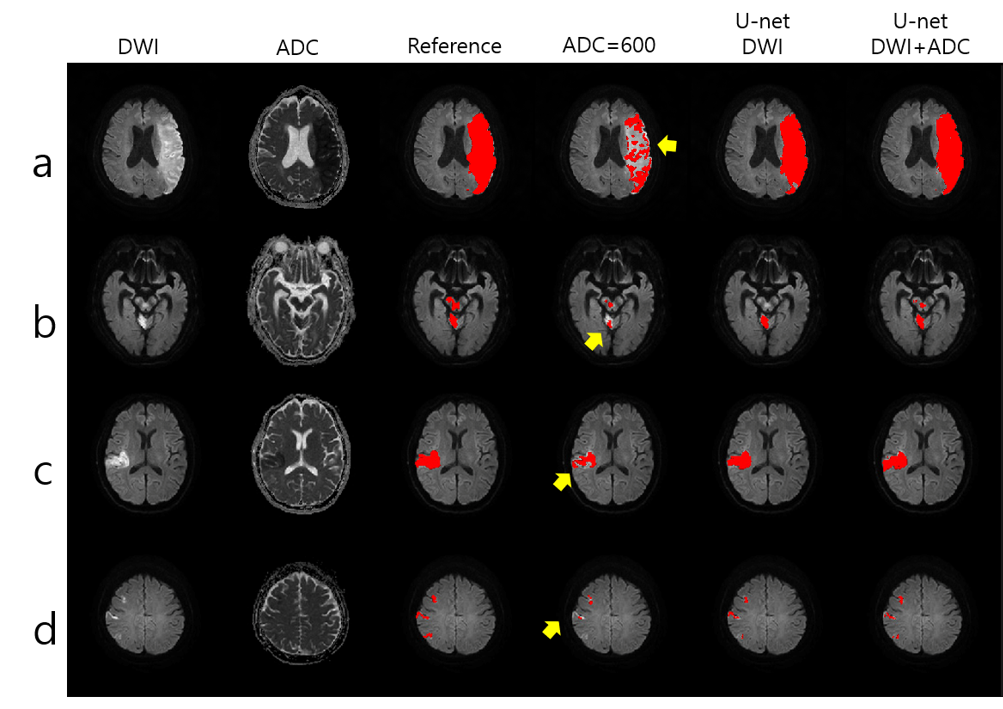
Figure 2 shows sample segmentation results for four external validation patient cases. The fixed threshold-based method under-estimated the diffusion lesions (see yellow arrows). The U-net (DWI) and U-net DWI+ADC showed segmentation performance similar to the manual reference.
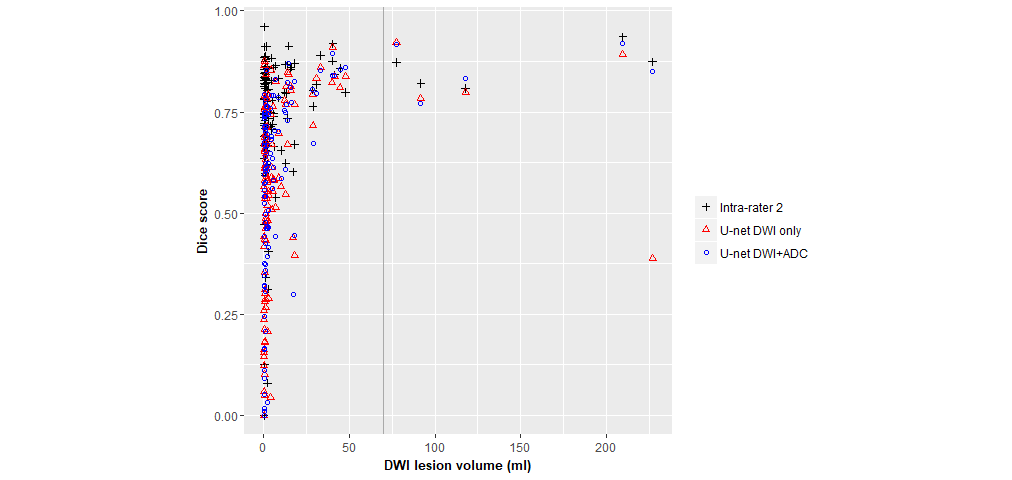
Mean(sd) Dice scores in the test subjects were 0.75(0.16) for intra-rater 2, 0.57(0.23) for U-net DWI, and 0.60(0.23) for U-net DWI+ADC. Figure 3 shows distributions of Dice scores over diffusion lesion volume. Dice scores were >0.75 for U-net DWI+ADC for diffusion lesion volume >70 ml, while Dice scores were distributed over a wide range for diffusion lesion volume <25 ml.
Lesion volume measurement root-mean-square errors (RMSE) in the test subjects were 14.51 ml for U-net DWI, 2.64 ml for U-net DWI+ADC, and 12.75 ml for the fixed ADC threshold method at ADC threshold = 600 (10-6 mm2/s). The fixed ADC threshold showed under-estimation of lesion volume in most of the test subjects.
Discussion
The
deep learning segmentation model was highly effective in predicting diffusion
lesion volume, especially when both DWI and ADC images were used as input for
the training. Comparison between the U-net DWI and U-net DWI+ADC shows that
the addition of ADC images to the model improved the segmentation accuracy, and deep learning-based segmentation methods overcame the lesion volume underestimation problem in traditional threshold-based segmentation methods.
However, both the U-net DWI and U-net DWI+ADC resulted in low Dice scores, especially for the cases of small diffusion lesion volume, requiring further
advancements of the segmentation algorithm.
Conclusion
The proposed deep learning-based method is fully automatic and has the potential to improve accuracy of the diffusion lesion volume measurement.Acknowledgements
This work was supported by the Basic Science Research Program through the National Research Foundation of Korea (NRF-2017 R1A2B4010648, NRF-2018 R1D1A1B07042692).References
1. Nogueira RG, Jadhav AP, Haussen DC, et al. Thrombectomy 6 to 24 hours after stroke with a mismatch between deficit and infarct. New England Journal of Medicine 2018;378:11-21.
2. Albers GW, Marks MP, Kemp S, et al. Thrombectomy for stroke at 6 to 16 hours with selection by perfusion imaging. New England Journal of Medicine 2018;378:708-718.
3. Chen L, Bentley P, Rueckert D. Fully automatic acute ischemic lesion segmentation in DWI using convolutional neural networks. NeuroImage: Clinical 2017;15:633-643.
4. Zhang R, Zhao L, Lou W, et al. Automatic Segmentation of Acute Ischemic Stroke from DWI using 3D Fully Convolutional DenseNets. IEEE transactions on medical imaging 2018;37:2149-2160.
5. Straka M, Albers GW, Bammer R. Real-time diffusion-perfusion mismatch analysis in acute stroke. Journal of magnetic resonance imaging : JMRI 2010;32:1024-1037.
6. Ronneberger, O., Fischer, P., & Brox, T. U-net: Convolutional networks for biomedical image segmentation. In International Conference on Medical Image Computing and Computer-Assisted Intervention (pp. 234-241). Springer, Cham (2015).
7. Dong, H., Yang, G., Liu, F., Mo, Y., & Guo, Y. Automatic Brain Tumor Detection and Segmentation Using U-Net Based Fully Convolutional Networks. arXiv preprint arXiv:1705.03820 (2017).
Figures