2728
Focal corticospinal tract volume loss following stroke characterized by diffusion tensor based morphometry (D-TBM)1Quantitative Medical Imaging Section, NIBIB,NIH, Bethesda, MD, United States, 2The Henry M. Jackson Foundation for the Advancement of Military Medicine Inc, Bethesda, MD, United States, 3Georgetown University, Washington D.C, DC, United States, 4Georgetown University and MedStar National Rehabilitation Hospital, Washington D.C, DC, United States, 5NICHD,NIH, Bethesda, MD, United States
Synopsis
Use of a diffusion tensor-based registration method to compare different scans within each subject and to map the results into a population template that can ultimately be used to stratify patients with different motor recovery outcome in stroke.
Introduction
Diffusion tensor imaging (DTI) has been used to evaluate changes in the corticospinal tract (CST) associated with Wallerian degeneration (WD) in chronic stroke. [1,2] Moreover, an association between poor motor recovery after stroke and decreased fractional anisotropy (FA) in the CST has been reported and there is a general interest in exploiting DTI measurements to predict outcome and stratify patients .[3-9] However, registration of same subject longitudinal studies, as well registration of individual subject data into populations templates has been problematic with the low quality DWIs typically acquired. In this study, we propose to use a tensor-based registration method to compare different scans within each subject and to map the results into a population template that can ultimately be used to stratify patients with different motor recovery outcome.
Method
We performed a retrospective analysis of data from the National Institute of Neurological Disorders and Stroke (NINDS) Natural History registry. Stroke participants met the following criteria: admission diagnosis of ischemic stroke, date/time of symptom onset is known, pre-admit modified Rankin scale (mRS) ≤ 2, NIH Stroke Scale (NIHSS) collected at admission and 30 days, NIHSS arm motor item ≥ 1 on admission, mRS collected at 30 and 90 days, no prior history of stroke, and survived ≥ 90 days. Control participants had an admission diagnosis of transient ischemic attack and had no prior history of stroke. Good recovery was defined as ≥ 2 point improvement on the NIHSS arm motor item from baseline to 30 days. Clinical grade MRIs (6 dir, b=1000 s/mm2 3.5mm slice thickness) were obtained within 36 hours of symptom onset and at 30 days.
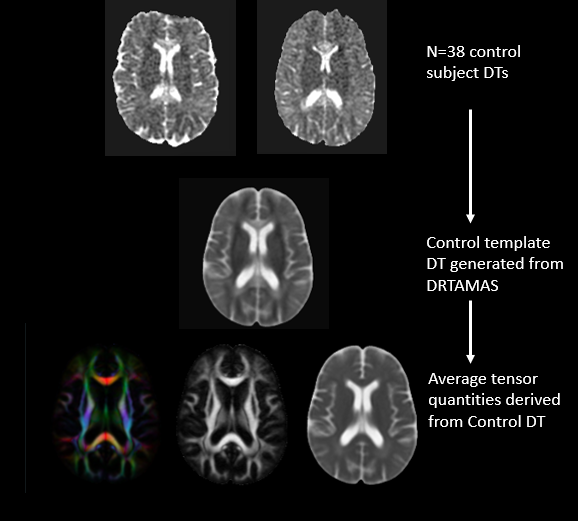
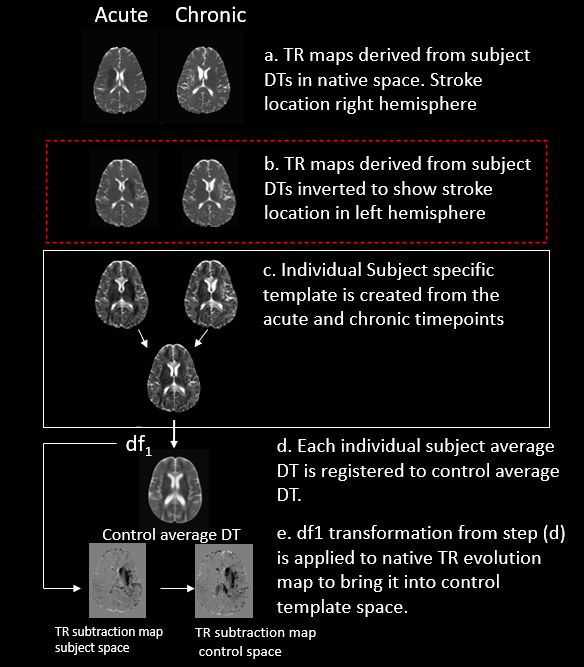
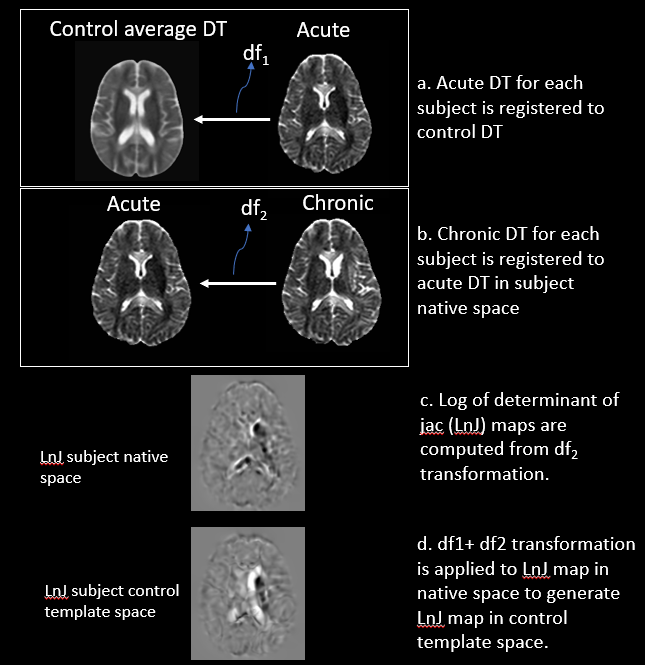
Diffusion images of patients (n=23) were processed to correct for eddy and, motion distortions; diffusion tensors (DTs) were computed. [10] DTs for participants with right hemispheric stroke lesions (n=13) were inverted using appropriate methods [10] to appear on the left in order to increase power to detect changes at the population level. A tensor-based registration approach [11] was used to create the control template (fig1). Maps quantifying change in FA, trace (TR) and volume change from log of the determinant of the jacobian (Ln-J) were computed using the pipeline shown in fig’s 2-3. For diffusion tensor-based morphometry (D-TBM)[12] analysis, the deformation (df) applied to bring chronic DT into acute DT was used in the computation of the Ln-J maps in a voxelwise manner. The Ln-J provides information about the volume of a particular structure in relation to the template i.e here, Ln-J map provides information about the volume change of structures in chronic timepoint in relation to the acute timepoint.
Results and Discussion
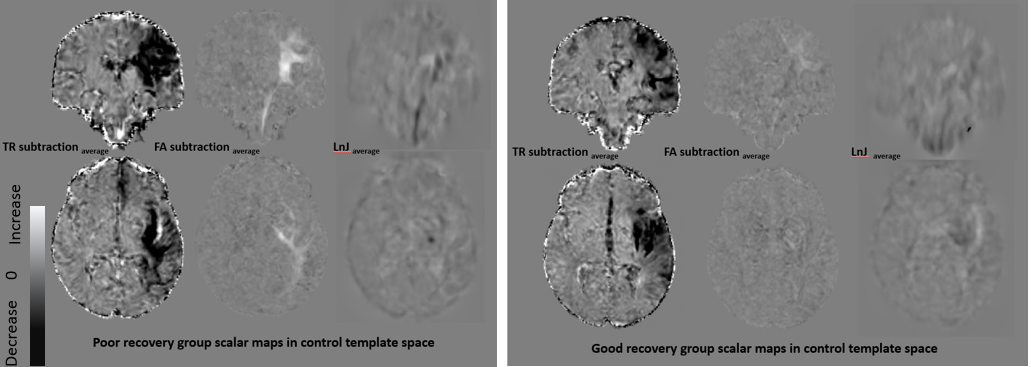
In participants with good motor recovery (fig4), there were longitudinal changes in TR in the motor cortex and putamen, but no significant (fig 5) changes in the FA or Ln-J maps. In contrast, in the bad recovery group (fig3) there is:
1) a longitudinal decrease in TR that was concentrated in the posterior regions in and around the white matter structures.
2) a decrease in FA observed over time, consistent with prior studies of WD.[1-9]
3) a decrease in volume in a region seemingly more focused in the region of the CST, in the Ln-J map. This observation indicates that together with FA changes there is evidence of volume change for the CST tract.
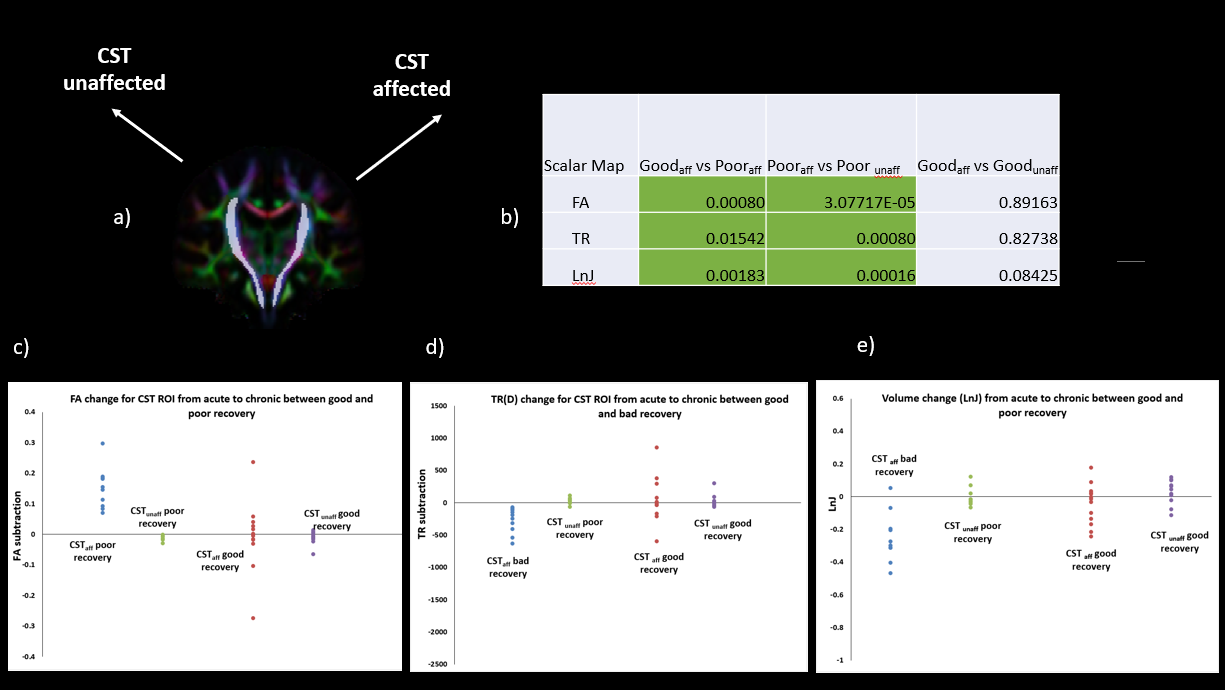
In order to further understand the TR, FA and Ln-J changes in the affected tract within the recovery groups, ROIs (CSTaffected and CSTunaffected) were defined on the left and right CST tracts of the control DEC map (fig 4).These ROIs were used to extract mean values from each control template warped FA,TR subtraction and Ln-J maps.[13] Two tailed two sample t-tests for FA, TR and Ln-J map show acute to chronic change is significantly higher (p<0.05) in poor than in good recovery. A paired t-test within poor recovery is significantly higher (p<0.05) in the affected side versus unaffected side as opposed to no significant change in the good recovery group.The plots(c) show the ability of the diffusion metrics in classifying the subjects based on their motor recovery outcome.
Conclusion
This study demonstrates the ability of using an effective tensor based registration method to extract FA,TR and Ln-J changes along the CST tract in individual patients despite using low resolution DTI. The specificity of changes captured in the structure is also highlighted when the images are mapped to a population template. The “punctate” change in volume that is observed at the population level is due to excellent tensor based registration. The volume changes observed using D-TBM can serve as an additional marker in evaluating the extent of damage to the white matter structures in stroke progression and associated motor outcomes.Acknowledgements
No acknowledgement found.References
[1] David J Werring, Ahmed T Toosy, Christopher A Clark, GeoVrey JM Parker, Gareth J Barker, David H Miller, Alan J Thompson, Diffusion tensor imaging can detect and quantify corticospinal tract degeneration after stroke (2000) J Neurol Neurosurg Psychiatry;69:269–272
[2] Carlo Pierpaoli, Alan Barnett, Sinisa Pajevic, Robert Chen, LaRoy Penix, Anette Virta, and Peter Basser, Water Diffusion Changes in Wallerian Degeneration and Their Dependence on White Matter Architecture. NeuroImage 13,1174–1185 (2001) doi:10.1006/nimg.2001.0765
[3] Jang SH, Kim K, Kim SH, Son SM, Jang WH, Kwon HG., The relation between motor function of stroke patients and diffusion tensor imaging findings for the corticospinal tract (2014). Neuroscience Letters 572 DOI: 10.1016/j.neulet.2014.04.044
[4] Lindenberg, R., Renga, V., Zhu, L. L., Betzler, F., Alsop, D., & Schlaug, G. (2010). Structural integrity of corticospinal motor fibers predicts motor impairment in chronic stroke. Neurology, 74(4), 280-7.
[5] Lindenberg, R., Zhu, L. L., Rüber, T., & Schlaug, G. (2011). Predicting functional motor potential in chronic stroke patients using diffusion tensor imaging. Human brain mapping, 33(5), 1040-51.
[6] Judith D. Schaechter,Zachary P. Fricker,Katherine L. Perdue, Karl G. Helmer, Mark G. Vangel, Douglas N. Greve, and Nikos Makris (2009). Microstructural Status of Ipsilesional and Contralesional Corticospinal Tract Correlates with Motor Skill in Chronic Stroke Patients. Human Brain Mapping 30:3461–3474.
[7] F Song et al., (2012).Diffusion Tensor Imaging for Predicting Hand Motor Outcome in Chronic Stroke Patients. The Journal of International Medical Research
[8] Cathy M. Stinear P. Alan Barber Peter R. Smale James P. Coxon Melanie K. Fleming Winston D. Byblow,(2007). Functional potential in chronic stroke patients depends on corticospinal tract integrity. Brain, Volume 130, Issue 1, 1 January 2007, Pages 170–180,
[9] Zhu, L. L., Lindenberg, R., Alexander, M. P., & Schlaug, G. (2010). Lesion load of the corticospinal tract predicts motor impairment in chronic stroke. Stroke, 41(5), 910-5.
[10] C. Pierpaoli, L. Walker, M. O. Irfanoglu, A. Barnett, P. Basser, L-C. Chang, C. Koay, S. Pajevic, G. Rohde, J. Sarlls, and M. Wu, 2010, TORTOISE: an integrated software package for processing of diffusion MRI data, ISMRM 18th annual meeting, Stockholm, Sweden, abstract #1597
[11] Irfanoglu MO, Nayak A, Jenkins J, Hutchinson EB, Sadeghi N, Thomas CP, Pierpaoli C, DR-TAMAS: Diffeomorphic Registration for Tensor Accurate Alignment of Anatomical Structures. Neuroimage. 2016 May 15;132:439-454. doi: 10.1016/j.neuroimage.2016.02.066. Epub 2016 Feb 28
[12] Neda Sadeghi Filippo Arrigoni Maria Grazia D'Angelo Cibu Thomas M. Okan Irfanoglu Elizabeth B. Hutchinson Amritha Nayak Pooja Modi Maria Teresa Bassi Carlo Pierpaoli (2018). Tensor‐based morphometry using scalar and directional information of diffusion tensor MRI data (DTBM): Application to hereditary spastic paraplegia, Human Brain Mapping.
[13] Cox RW. 1996. AFNI: software for analysis and visualization of functional magnetic resonance neuroimages. Comput Biomed Res. 29:162 173.
Figures