2726
Cerebral Venous Blood Volume Estimation Using Velocity-Selective Spin Labeling Prepared Single-Slab Three-Dimensional Turbo Spin Echo Imaging1Radiology, University of Pennsylvania, Philadelphia, PA, United States
Synopsis
Venous CBV (CBVv) is of relevance to brain oxygenation level changes during functional activation. To date, MRI techniques for CBVv mapping fall into two categories, based on a 1) quantitative BOLD (qBOLD) model of extravascular signals, and 2) hyperoxic stimulus induced changes in intravascular signal. However, in the former estimation accuracy is impaired due to mutual coupling between CBVv and Yv in the model, while the latter suffers from the complexities in both experiments and estimation involving multiple parameters. Here, we propose velocity-selective spin labeling prepared single-slab 3D TSE imaging for straightforward derivation of CBVv maps in the whole brain. Results from three subjects show plausible values of CBVv estimates in the range of 1.9 - 3.3 % and 1.1 - 2.1 % for gray and white matter, respectively.
Introduction
Cerebral blood volume (CBV) is an important parameter for understanding normal brain function and pathophysiology in neurological disorders1. Particularly, venous CBV (CBVv) is of relevance to brain oxygenation level (Yv) changes during functional activation2. To date, MRI techniques for CBVv mapping fall into two categories, based on a 1) quantitative BOLD (qBOLD) model of extravascular signals3,4, and 2) hyperoxic stimulus induced changes in intravascular signal5,6. However, in the former estimation accuracy is impaired due to mutual coupling between CBVv and Yv in the model, while the latter suffers from the complexities in both experiments and estimation involving extraction of multiple parameters. Here, we propose a velocity-selective spin labeling (VSSL) based approach7 for straightforward derivation of CBVv maps in the whole brain.Methods
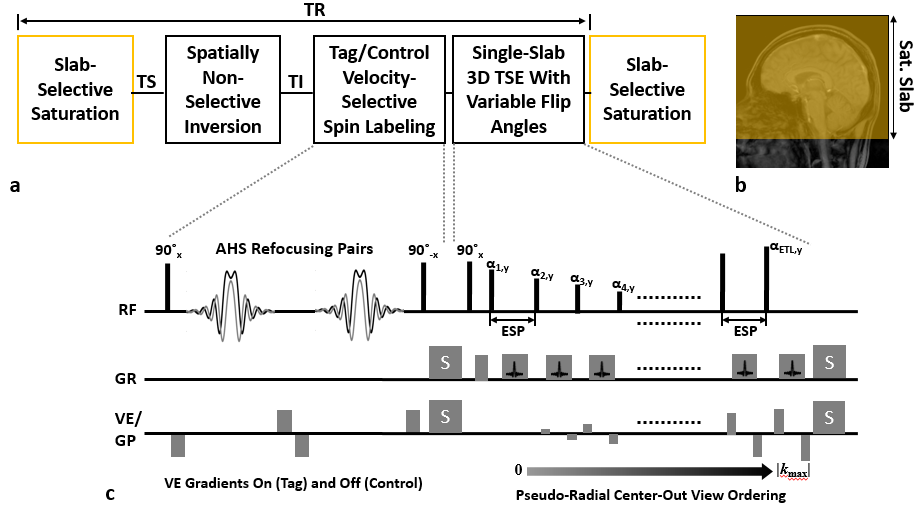
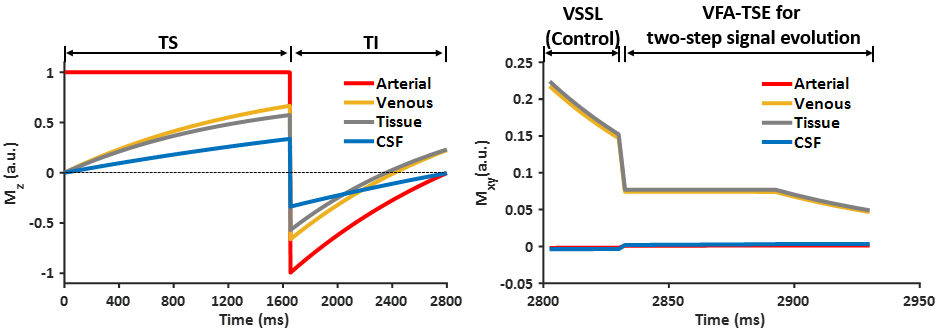
Sequence configuration: Figure 1 shows a schematic and diagram of the proposed pulse sequence. RF pulses for slab-selective saturation and non-selective inversion are sequentially applied at times determined from numerical simulations (Fig. 2) so as to suppress both arterial blood and cerebrospinal-fluid (CSF) signals at the onset of VSSL, thereby ensuring exclusive labeling of venous blood water spins. Following the VSSL, a single-slab 3D turbo spin echo (TSE)8 module (Fig. 1c) is employed in which VSSL-targeted signals are acquired along the echo train with variable refocusing flip angles for prescribed, two-step evolution of brain tissue signals (Fig. 2b). To maximize sensitivity to labeled blood signals, phase-encoding views in each echo train are mapped in an elliptical ky-kz space in a pseudo-radial, center-out fashion9. The four blocks in Fig. 1a are repeated with the velocity-encoding gradients switched on and off alternately for tag and control scans, respectively.
CBVv estimation: Given the effective suppression of both arterial blood and CSF signals, voxel signals in control (Scon) and tag (Stag) images can be written as10:
$$S_{con}=C\cdot \left ( (1-CBV_v)\cdot M_{z,t}^{-}\cdot e^{-\frac{T_{VSSL}}{T_{2,t}}}+CBV_v\cdot M_{z,v}^{-}\cdot e^{-\frac{T_{VSSL}}{T_{2,v}}} \right ) (1)$$
$$S_{tag}=C\cdot (1-CBV_v)\cdot M_{z,t}^{-}\cdot e^{-\frac{T_{VSSL}}{T_{2,t}}} (2)$$
where C is a hardware-related constant, $$$M_{z,t}^{-}$$$ and $$$M_{z,v}^{-}$$$ represent longitudinal magnetization of brain tissue and venous blood, respectively, immediately prior to VSSL, and TVSSL is the duration of the VSSL block. CBVv can then be estimated by using the following equation:
$$\frac{S_{con}-S_{tag}}{S_{con}}=\frac{CBV_v\cdot M_{z,v}^{-}\cdot e^{-\frac{T_{VSSL}}{T_{2,v}}}}{(1-CBV_v)\cdot M_{z,t}^{-}\cdot e^{-\frac{T_{VSSL}}{T_{2,t}}}+CBV_v\cdot M_{z,v}^{-}\cdot e^{-\frac{T_{VSSL}}{T_{2,v}}}}\approx CBV_v (3) $$
Here, we made two approximations: $$$T_{2,t} ≈ T_{2,v}$$$ valid at a 3 T field strength, and $$$M_{z,t}^{-} ≈ M_{z,v}^{-}$$$ suggested by the numerical Bloch equation simulation (Fig. 2).
Data acquisition and processing: Experiments were performed at 3 T (Siemens Prisma) in three healthy subjects. A 32-channel head coil was used for signal reception. Imaging parameters were: TS = 1650 ms, TI = 1150 ms, FOV = 220 x 220 x 180 mm3 (sagittal orientation), matrix size = 72 x 72 x 60, voxel size = 3 mm isotropic, TVSSL = 30 ms, cut-off velocity = 1.5 cm/s, echo-train-length = 40, echo-spacing = 2.5 ms, and scan time = 8.4 min. High-resolution T1-weigthed images were additionally acquired for brain segmentation with SPM12 software11. Gaussian smoothing with a 3 x 5 x 5 kernel size was applied to both control and tag images. Derived CBVv in each voxel was averaged over segmented gray matter (GM) and white matter (WM) regions.
Results
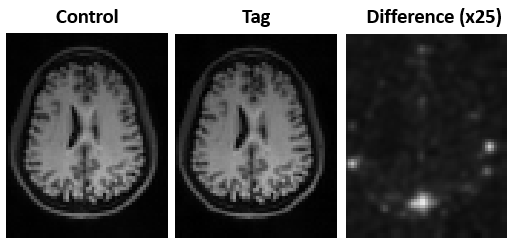
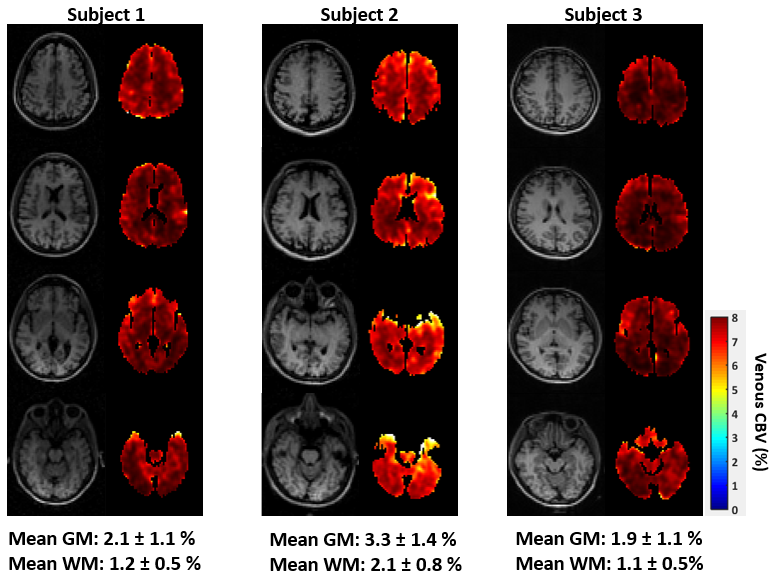
Figure 3 shows a pair of control (Fig. 3a) and tag (Fig. 3b) images in the axial plane along with the corresponding difference (Fig. 3c). The difference image highlighting large veins (e.g., superior sagittal sinus) demonstrates the effectiveness of the VSSL module in targeting venous blood water spins. Figure 4 displays four representative slices of CBVv maps in the three study subjects and the corresponding images from control scans. All CBVv maps depict the expected contrast between GM and WM, yielding physiologically plausible values in the range of 1.9 – 3.3 % and 1.1 – 2.1 % for GM and WM, respectively.Discussion and Conclusions
The present VSSL-based method, as opposed to prior approaches, allows staraightforward measurements of CBVv in the whole brain yielding values in the expected range. Nevertheless, the accuracy of the proposed method may be sensitive to the validity of the two assumptions made in Eq. (3), which warrants further investigations. While having a potential as a stand-alone technique, the method may also be combined with qBOLD for accurate estimation of whole-brain hemodynamic and metabolic parameters, as demonstrated in Ref. 10 for 2D single-slice imaging.Acknowledgements
NIH grants RO1-HL122754, RO1-HL109545, R21-NS082953References
1. Derdeyn CP, Videen TO, Yundt KD, Fritsch SM, Carpenter DA, Grubb RL, Powers WJ. Variability of cerebral blood volume and oxygen extraction: stages of cerebral haemodynamic impairment revisited. Brain 2002;125:595-607.
2. van Zijl PC, Eleff SM, Ulatowsk JA, Oja JM, Ulug AM, Traystman RJ, Kauppinen RA. Quatitative assessment of blood flow, blood volume and blood oxygenation effects in functional magnetic resonance imaging. Nat Med 1998;4:159-167.
3. An HY, Lin WL. Quantitative measurements of cerebral blood oxygen saturation using magnetic resonance imaging. J Cereb Blood Flow Metab 2000; 20:1225-1236.
4. He X, Yablonskiy DA. Quantitative BOLD: mapping of human cerebral deoxygenated blood volume and oxygen extraction fraction: default state. Magn Reson Med 2007;57:115-126.
5. Bulte DP, Chiarelli P, Wise R, Jezzard P. Measurement of cerebral blood volume in humans using hyperoxic MRI contrast. J Magn Reson Imaging 2007;26:894-899.
6. Blockley NP, Griffeth VE, Germuska MA, Bulte DP, Buxton RB. An analysis of the use of hyperoxia for measuring venous cerebral blood volume: comparison of the existing method with a new analysis approach. Neuroimage 2013;72:33-40.
7. Norris DG, Schwarzbauer C. Velocity selective radiofrequency pulse trains. J Magn Reson 1999;137:231-236.
8. Mugler JP. Optimized three-dimensional fast-spin-echo MRI. J Magn Reson Imaging 2014;39:745-767.
9. Busse RF, Brau AC, Michelich CR, Bayram E, Kijowski R, Reeder SB, Rowley HA. Effects of refocusing flip angle modulation and view ordering in 3D fast spin echo. Magn Reson Med 2008;60:640-649.
10. Lee H, Englund EK, Wehrli FW. Interleaved quantitative BOLD: Combining extravascular R2’- and intravascular R2-measurements for estimation of deoxygenated blood volume and hemoglobin oxygen saturation. Neuroimage 2018;174:420-431.
11. Penny W, Friston K, Ashburner J, Kiebel S, Nichols T. Statistical parametric mapping: The analysis of functional brain images. Elsevier 2016.
Figures