2725
The effect of scan length on the assessment of perfusion using BOLD delay in ischemic stroke1Center for Stroke Research, Charité University of Medicine, Berlin, Germany, 2Institute of Biometry and Clinical Epidemiology, Charité University of Medicine, Berlin, Germany, 3Berlin Institute of Health (BIH), Berlin, Germany, 4Department of Neurophysics, Max Planck Institute for Human Cognitive and Brain Sciences, Leipzig, Germany, 5Center for Cognitive Neuroscience, Free University, Berlin, Germany, 6Department of Neurology, Max Planck Institute for Human Cognitive and Brain, Leipzig, Germany, 7School of Mind and Brain, Humboldt University, Berlin, Germany
Synopsis
Hypoperfusion in acute stroke can be detected without exogenous contrast agents using BOLD delay. However the effect of scan duration on assessing perfusion using this method hasn’t been systematically evaluated. This study researched the effect of different scan lengths on diagnostic accuracy and image quality of BOLD delay maps while accounting for head motion. Our results revealed that scan time can be reduced to 3 min and 24 sec without compromising diagnostic power and image quality. However, lesion volumes were robust down to a scan length of 1 min and 8 sec.
Introduction
Delayed systemic low frequency oscillations (sLFOs) of the blood oxygen level dependent (BOLD) signal are defined as BOLD delay 1 and reflects blood flow changes similar to dynamic susceptibility contrast MRI (DSC-MRI) 2. BOLD delay’s mapping in acute stroke can be used for detecting salvageable tissue, the potential target for reperfusion therapies 3. This method holds great potential since it doesn’t require exogenous contrast agents. However, before BOLD delay can be routinely applied in clinical practice , its acquisition time needs to be investigated further. Previous studies employed scan lengths varying between 3.5 and 30 minutes 4 5 6 7, all longer than scan lengths typical of DSC-MRI (~2 min). Here we systematically evaluated the impact of scan length in terms of diagnostic accuracy and image quality on brain perfusion assessment with BOLD delay.Methods
Sixty-three acute stroke patients underwent a standard stroke imaging protocol 8 including multiband EPI scan for BOLD delay mapping (CMRR, TR/TE=400/30 ms, flip angle 43°, multiband factor=6, thirty 4.0-mm slices, acquisition time: 340s). Thirty-eight patients received a follow-up scan (Day 1) within 24 hours after the baseline scan (Day 0). To reflect a representative clinical population, patients were not excluded based on head motion. Qualitative analysis was performed on all patients. A subset of 42 patients with visible hypoperfusion on BOLD delay maps were selected for quantitative analysis (see Table 1).
Four segments of various lengths were generated from the full 340s scan (68s, 136s, 204s, 272s), and referred to as the 0.2, 0.4, 0.6, 0.8 segments respectively. Preprocessing of the segments included band pass filtering (0.01-0.15 Hz) and motion correction. For each voxel, the time shift needed for maximum cross-correlation with the signal in the venous sinuses was calculated using rapidtide 9 to obtain BOLD delay maps for each scan segment. Head motion was assessed using the the mean and maximum framewise displacement (FD) of each segment.
Quantitative analysis was employed to spatially and volumetrically compare hypoperfusion lesions from shorter scans with those from the full length scan. The Dice Similarity Coefficient was used for measuring spatial overlap. Bland Altman analysis was used for assessing the agreement between segments on lesion volumes. Two (two-level; random-intercept and slope) linear mixed models 10 were used for measuring scan segments’ impact on the volume estimation of lesions when accounting for mean and maximum FD values separately. Subjects were level two units, measurements level one units nested within subjects. Lesion volumes were log-transformed.
BOLD delay map quality (noise, structure clarity and interpretability) and diagnostic accuracy (sensitivity to hypoperfusion detection) were evaluated by two radiologists. The effect of scan length on these variables was investigated using a binary logistic mixed model 10 (interpretability and hypoperfusion detection) and an ordinal mixed model 11 (noise and structure clarity). In all models, subjects were level two units and head motion and inter-reader differences were accounted for.
Results
Pair-wise comparison for spatial overlap using Dice (DSC) reveals that the highest overlap was between the 0.8 scan and the full scan (0.67; IQR=0.56-0.79) and it decreased by 0.11 (95% CI =-0.13, -0.09) when scan length was shortened by 20%.
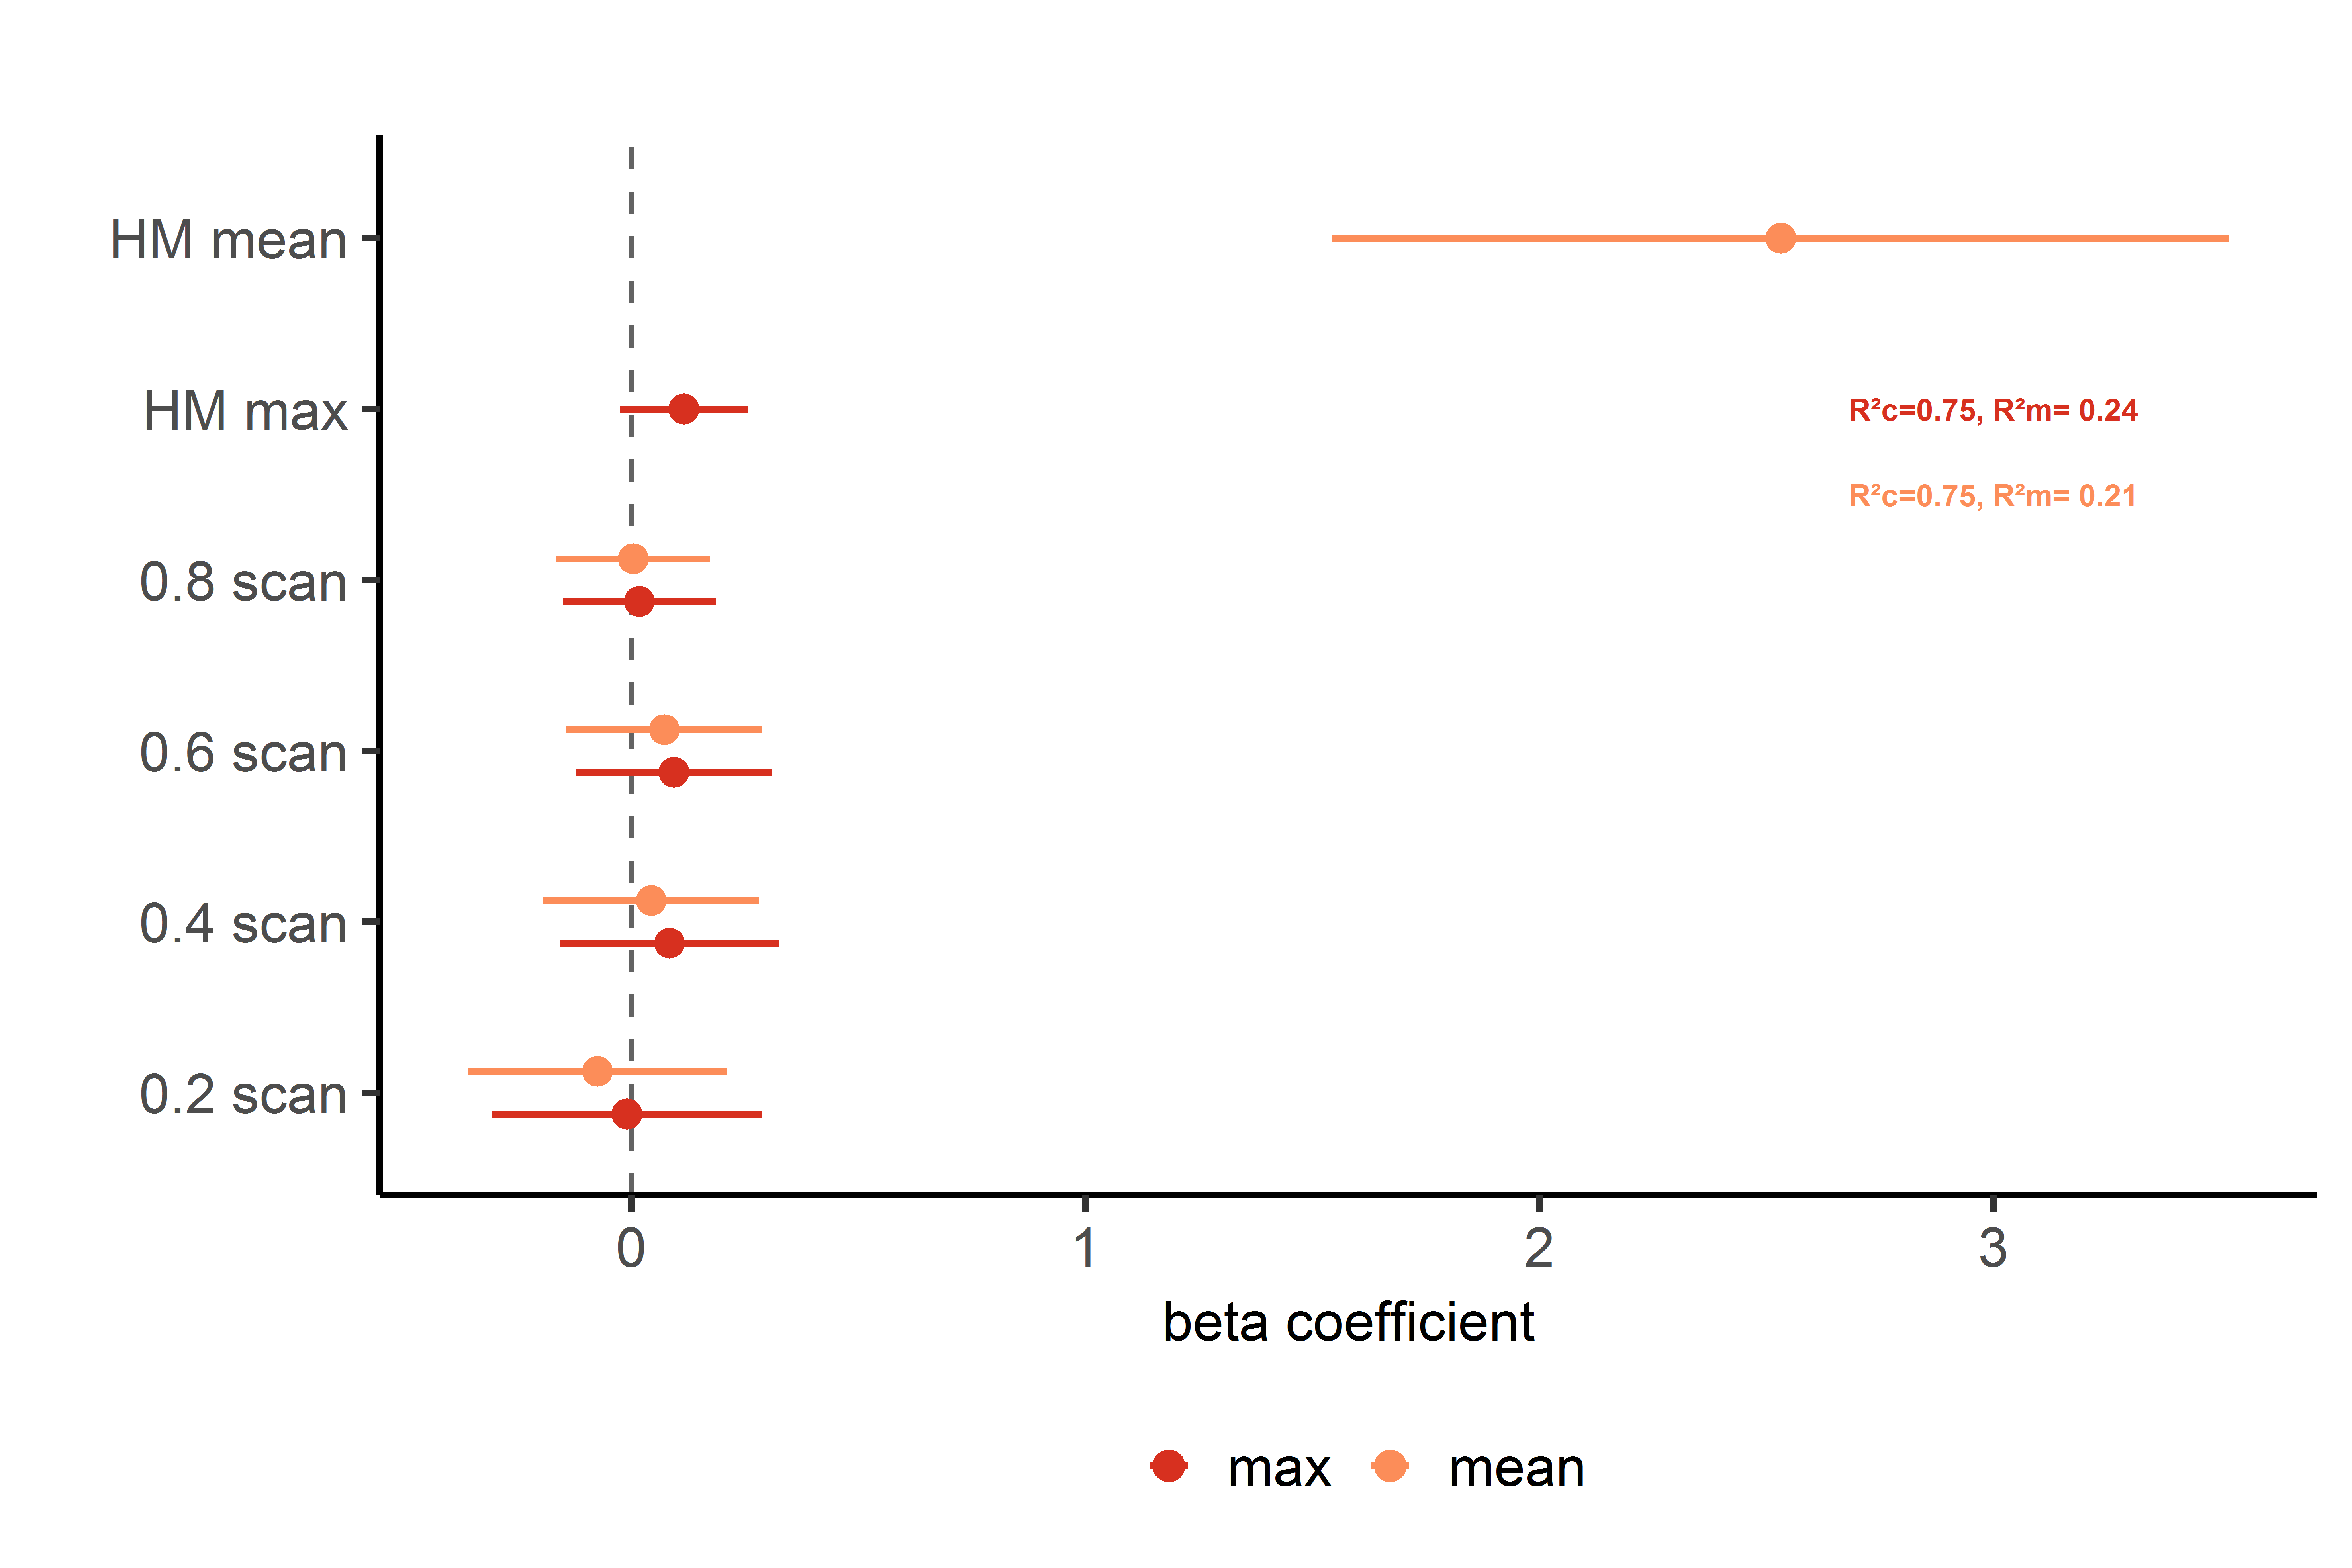
Bland-Altman analysis showed that the difference between longer and shorter scans was on average 0 with lower variability between longer and 0.8 scan than between longer and 0.6, 0.4 and 0.2 scans. Additionally there was no systematic bias in lesion volumes derived from the different segments (Fig. 2). Linear mixed effects models revealed that various scan segments were not systematically associated with volumetric estimation of lesions. Head motion (mean) was positively associated with lesion estimate (Fig. 3).
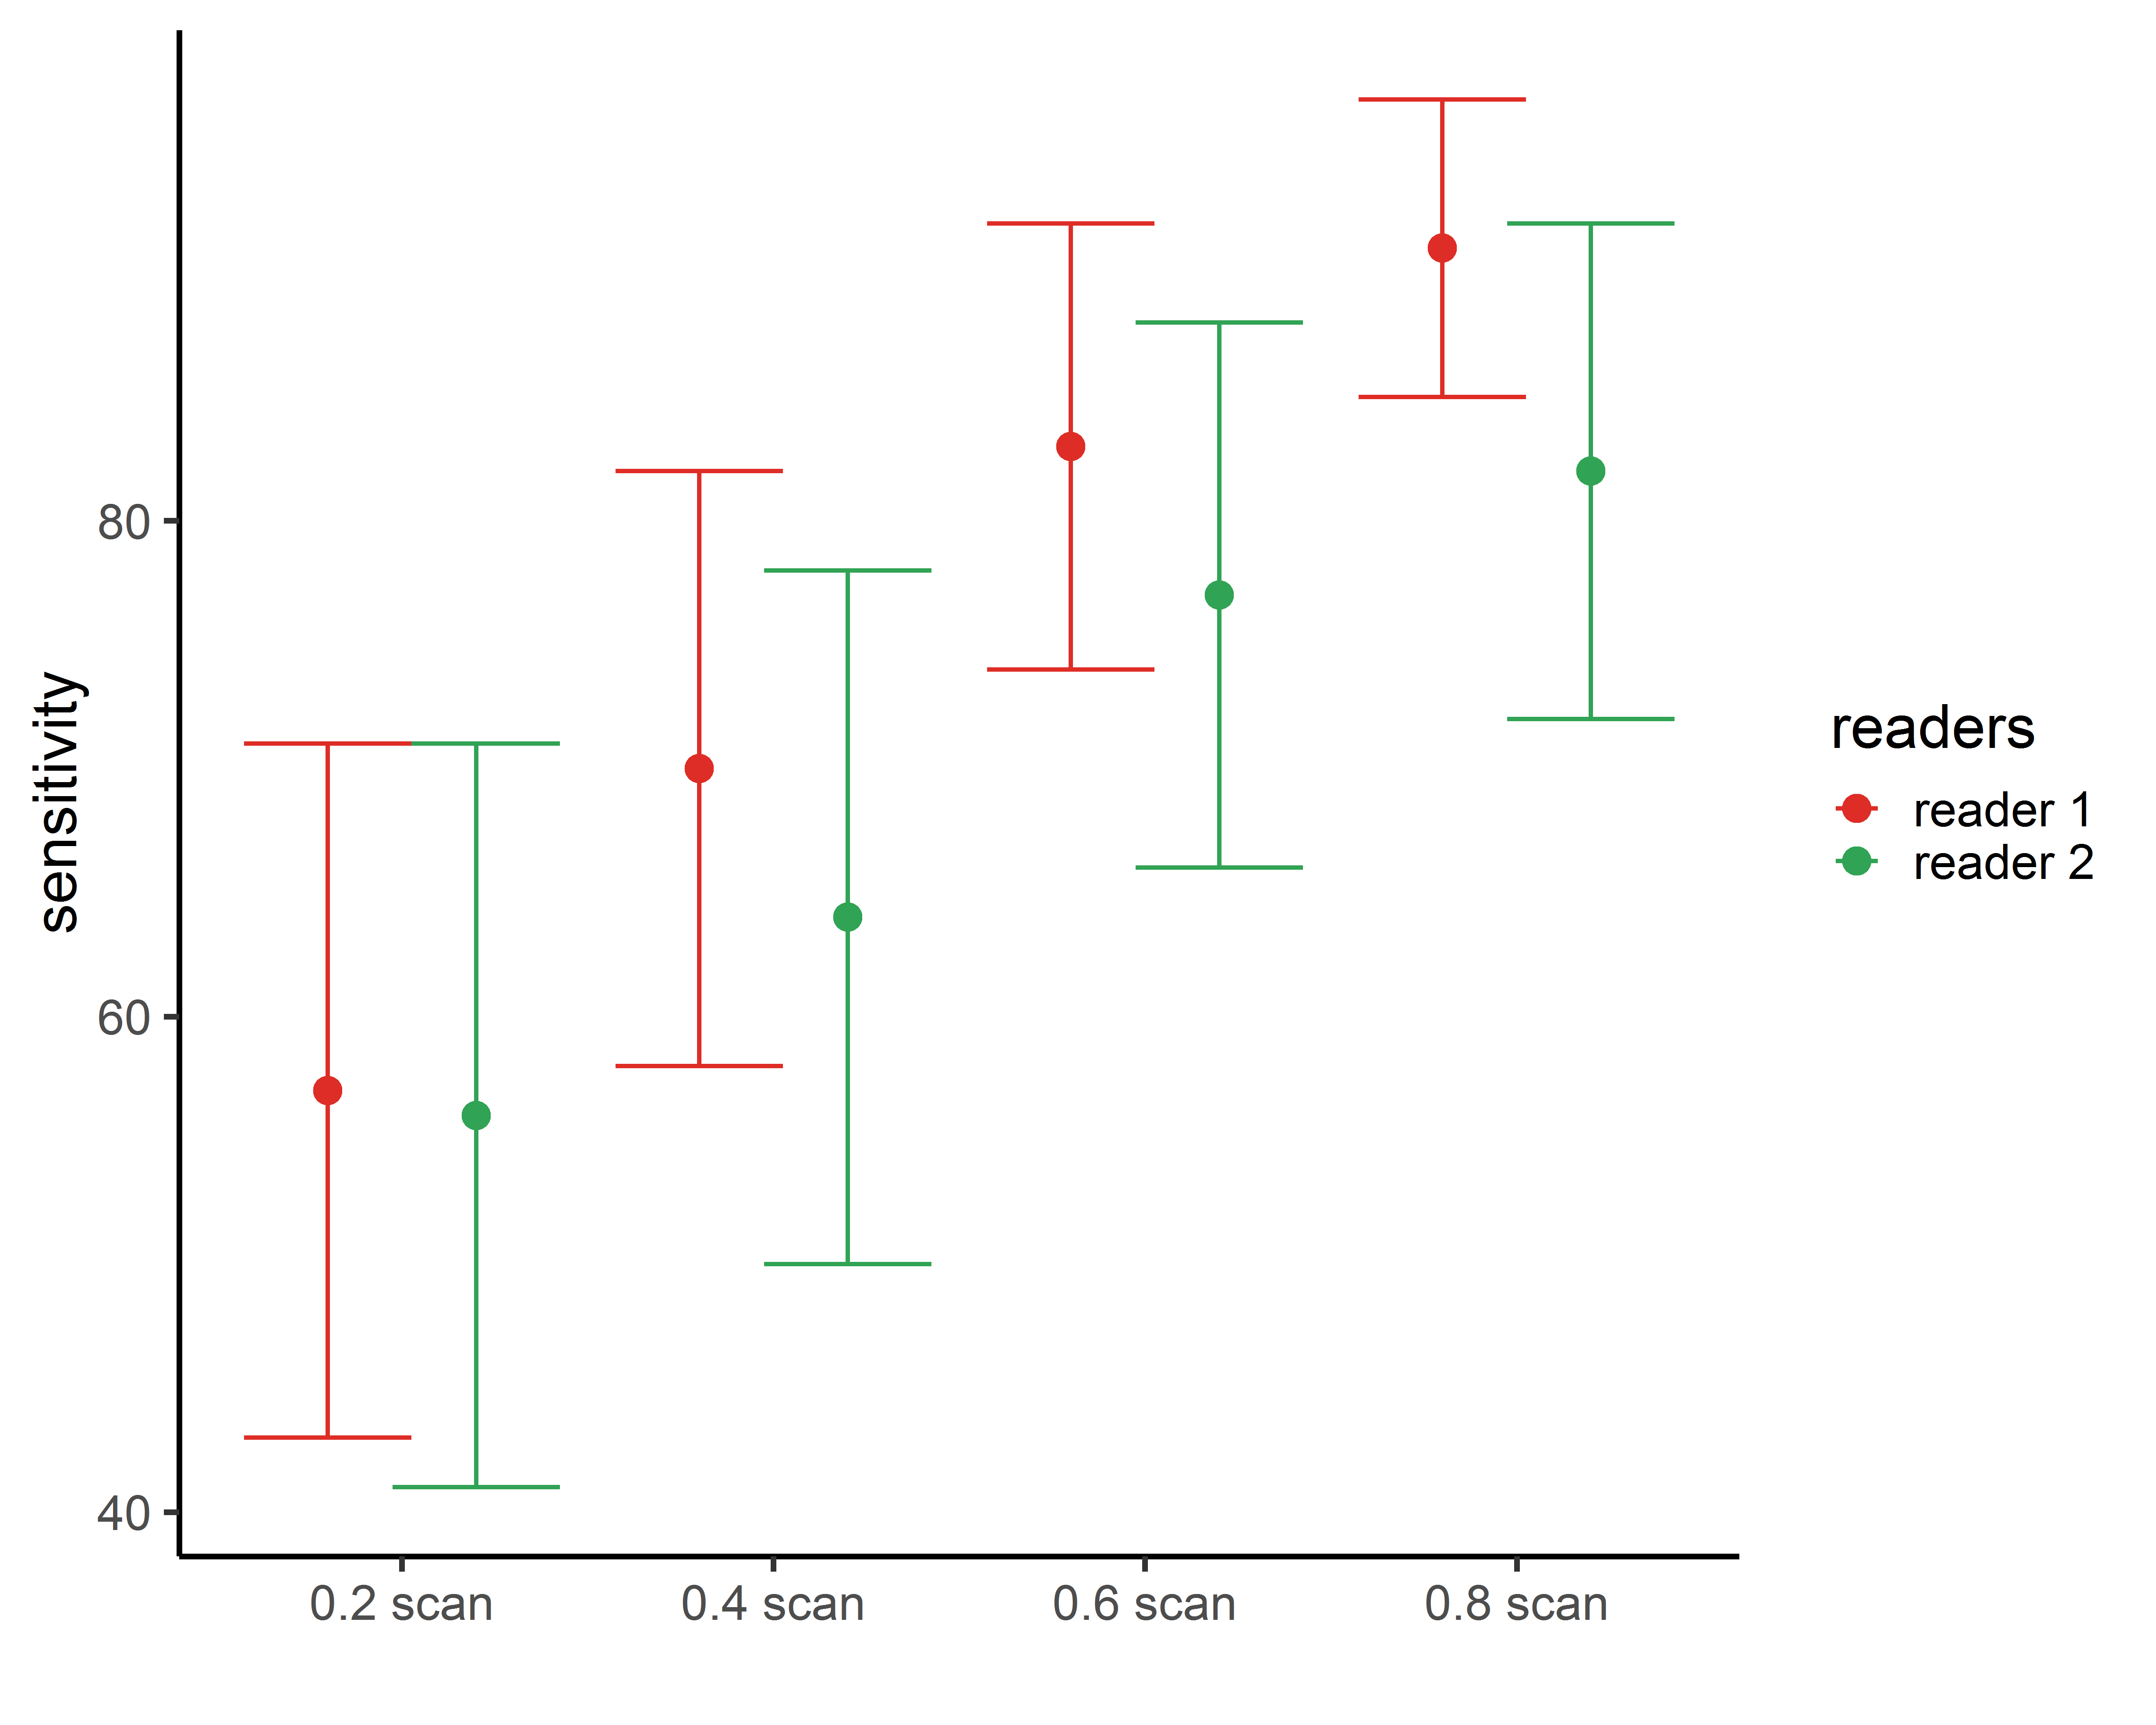
Sensitivity decreases gradually with scan shortening and scan length significantly attenuates the diagnostic power of the 0.4 and 0.2 segments (Fig. 4).
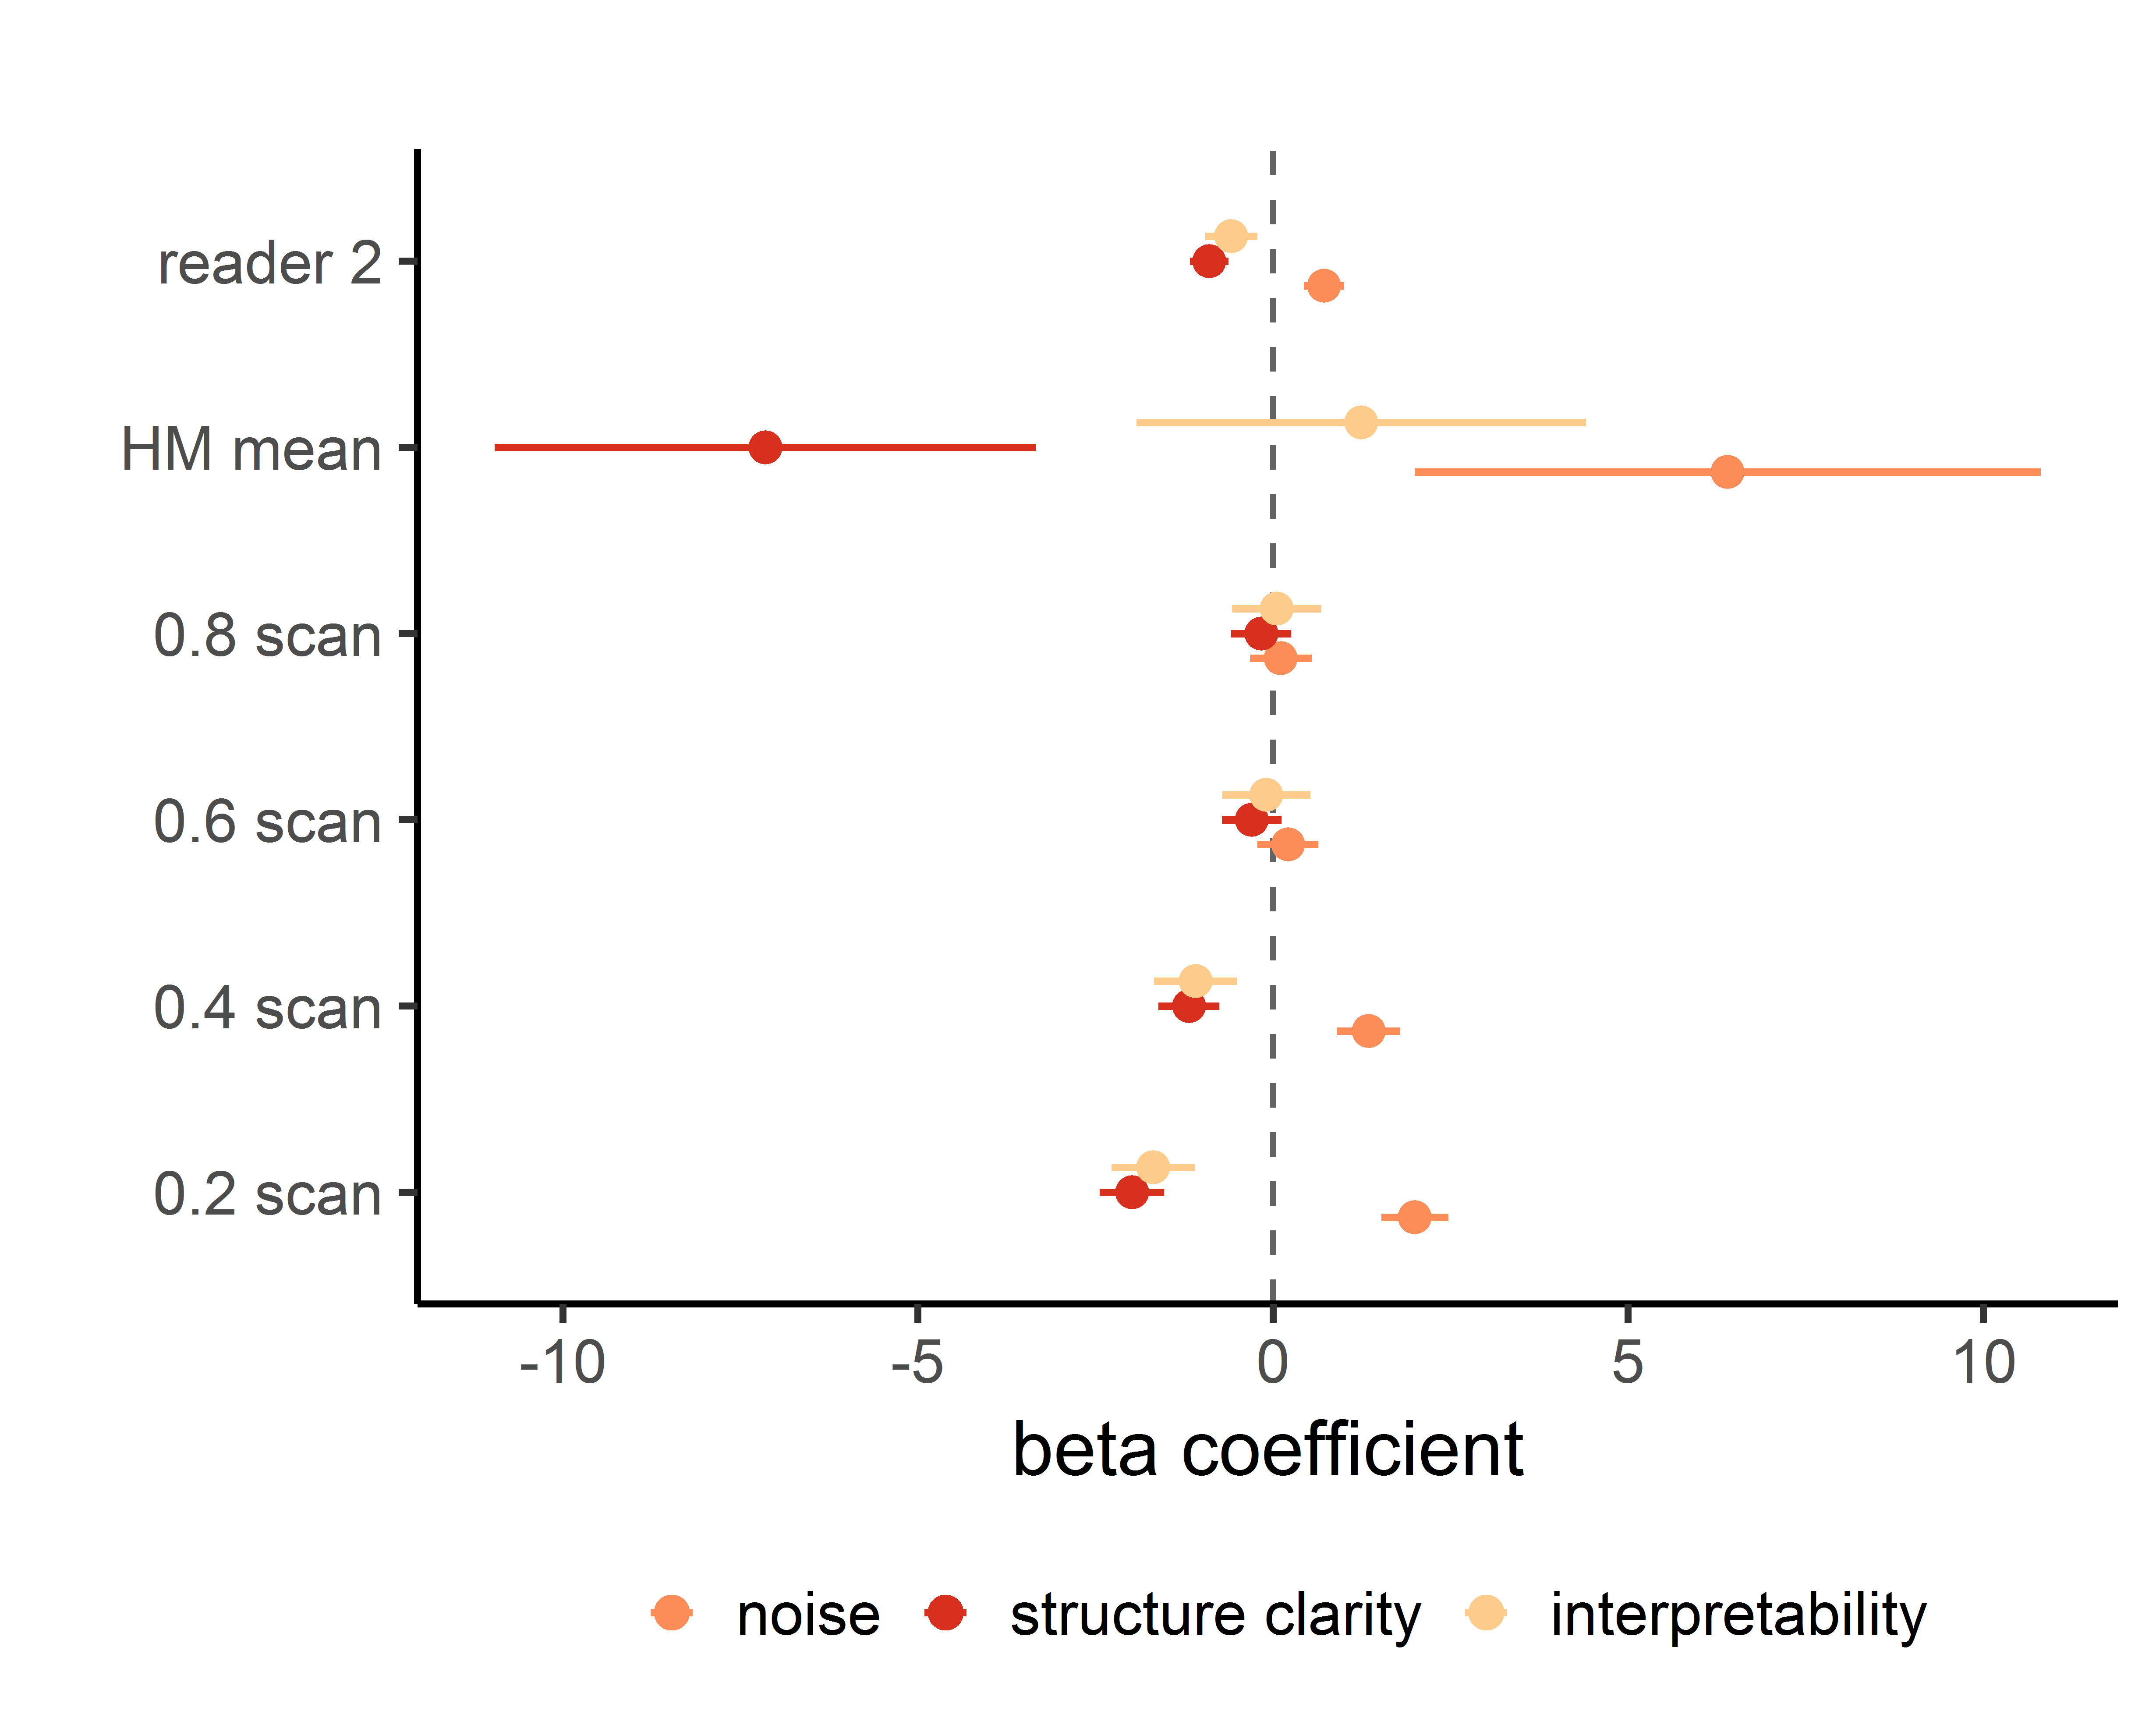
Binary logistic and ordinal mixed models showed that shortening the scan length by 60% diminished the interpretability and structure clarity of the maps while increasing noise (Fig. 5). Head motion adversely altered motion and structure clarity.
Discussion
This study methodically assessed the effect of scan time reduction on diagnostic quality of BOLD delay perfusion mapping in acute stroke. Scan time can be reduced to 3 min and 24 sec without a significant loss of diagnostic power and image quality when accounting for head motion. However lesion volume estimates were robust down to a scan time of 1 min and 8 sec. Our results provide an important step towards the implementation of contrast agent-free BOLD delay mapping for detecting hypoperfusion.
Acknowledgements
Center for Magnetic Resonance Research, Department of Radiology, University of MinnesotaReferences
1. Tong Y, Frederick BD. Time lag dependent multimodal processing of concurrent fMRI and near-infrared spectroscopy (NIRS) data suggests a global circulatory origin for low-frequency oscillation signals in human brain. Neuroimage 2010;53:553–564
2. Khalil, A. A., Ostwaldt, A. C., Nierhaus, T., Ganeshan, R., Audebert, H. J., Villringer, K., … Fiebach, J. B. (2017). Relationship between Changes in the Temporal Dynamics of the Blood-Oxygen-Level-Dependent Signal and Hypoperfusion in Acute Ischemic Stroke. Stroke. https://doi.org/10.1161/STROKEAHA.116.015566
3. Latchaw RE, Yonas H, Hunter GJ, et al. Guidelines and recommendations for perfusion imaging in cerebral ischemia: a scientific statement for healthcare professionals by the writing group on perfusion imaging, from the Council on Cardiovascular Radiology of the American Heart Association. Stroke 2003;34(4):1084–1104.
4. Christen T, Jahanian H, Ni WW, Qiu D, Moseley ME, Zaharchuk G. Noncontrast mapping of arterial delay and functional connectivity using resting-state functional MRI: a study in Moyamoya patients. J Magn Reson Imaging. 2015;41:424–430. doi: 10.1002/jmri.24558.
5. Siegel JS, Snyder AZ, Ramsey L, Shulman GL, Corbetta M. The effects of hemodynamic lag on functional connectivity and behav- ior after stroke. J Cereb Blood Flow Metab. 2016;36:2162–2176. doi: 10.1177/0271678X15614846.
6. Amemiya S, Kunimatsu A, Saito N, Ohtomo K. Cerebral hemodynamic impairment: assessment with resting-state functional MR imaging.Radiology. 2014;270:548–555. doi: 10.1148/radiol.13130982.
7. Wu, J., Dehkharghani, S., Nahab, F., Allen, J., & Qiu, D. (2017). The Effects of Acetazolamide on the Evaluation of Cerebral Hemodynamics and Functional Connectivity Using Blood Oxygen Level–Dependent MR Imaging in Patients with Chronic Steno-Occlusive Disease of the Anterior Circulation. American Journal of Neuroradiology, 38(1), 139–145. https://doi.org/10.3174/ajnr.A4973
8. Hotter B, Pittl S, Ebinger M, et al. Prospective study on the mismatch concept in acute stroke patients within the first 24 h after symptom onset - 1000Plus study. BMC Neurol. 2009;9. doi:10.1186/1471-2377-9-60
9. https://github.com/bbfrederick/rapidtide
10. Bates, D., Mächler, M., Bolker, B., & Walker, S. (2015). Fitting linear mixed-effects models using lme4. Journal of Statistical Software. https://doi.org/10.18637/jss.v067.i01
11. Christensen, R. H. B. (2018). ordinal - Regression Models for Ordinal Data. R package version 2018.8-25. http://www.cran.r-project.org/package=ordinal/.
Figures
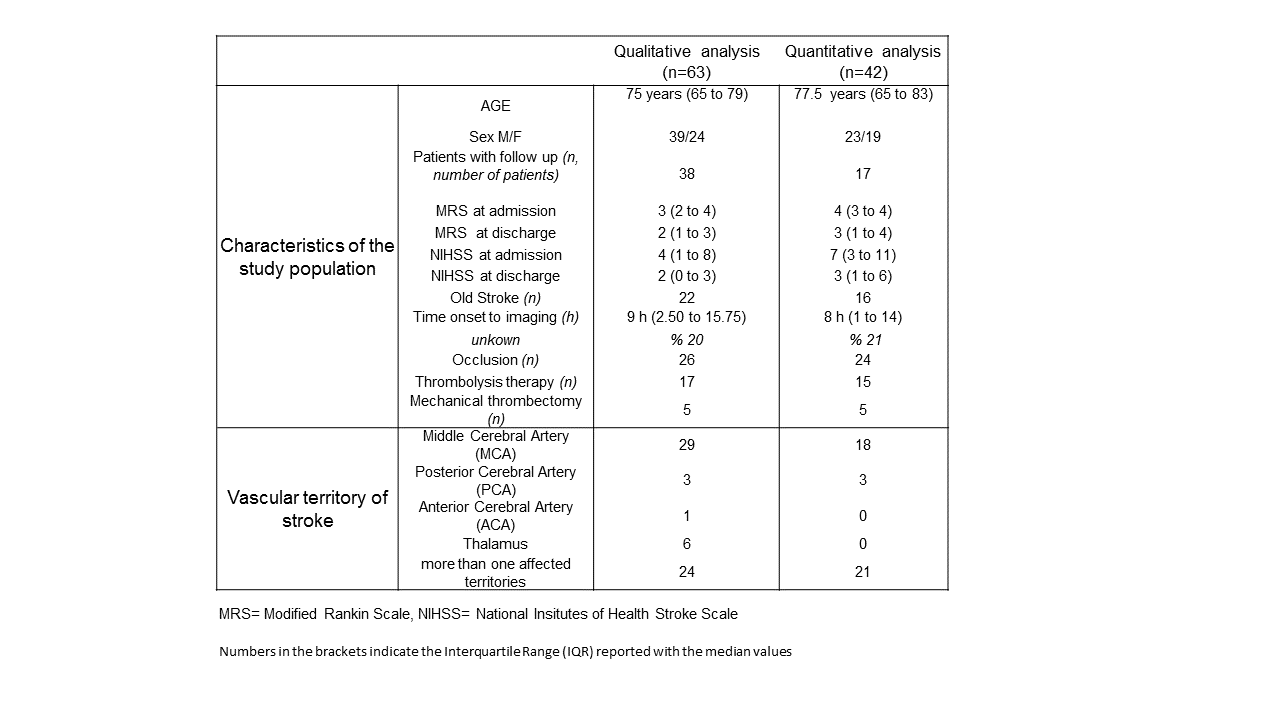
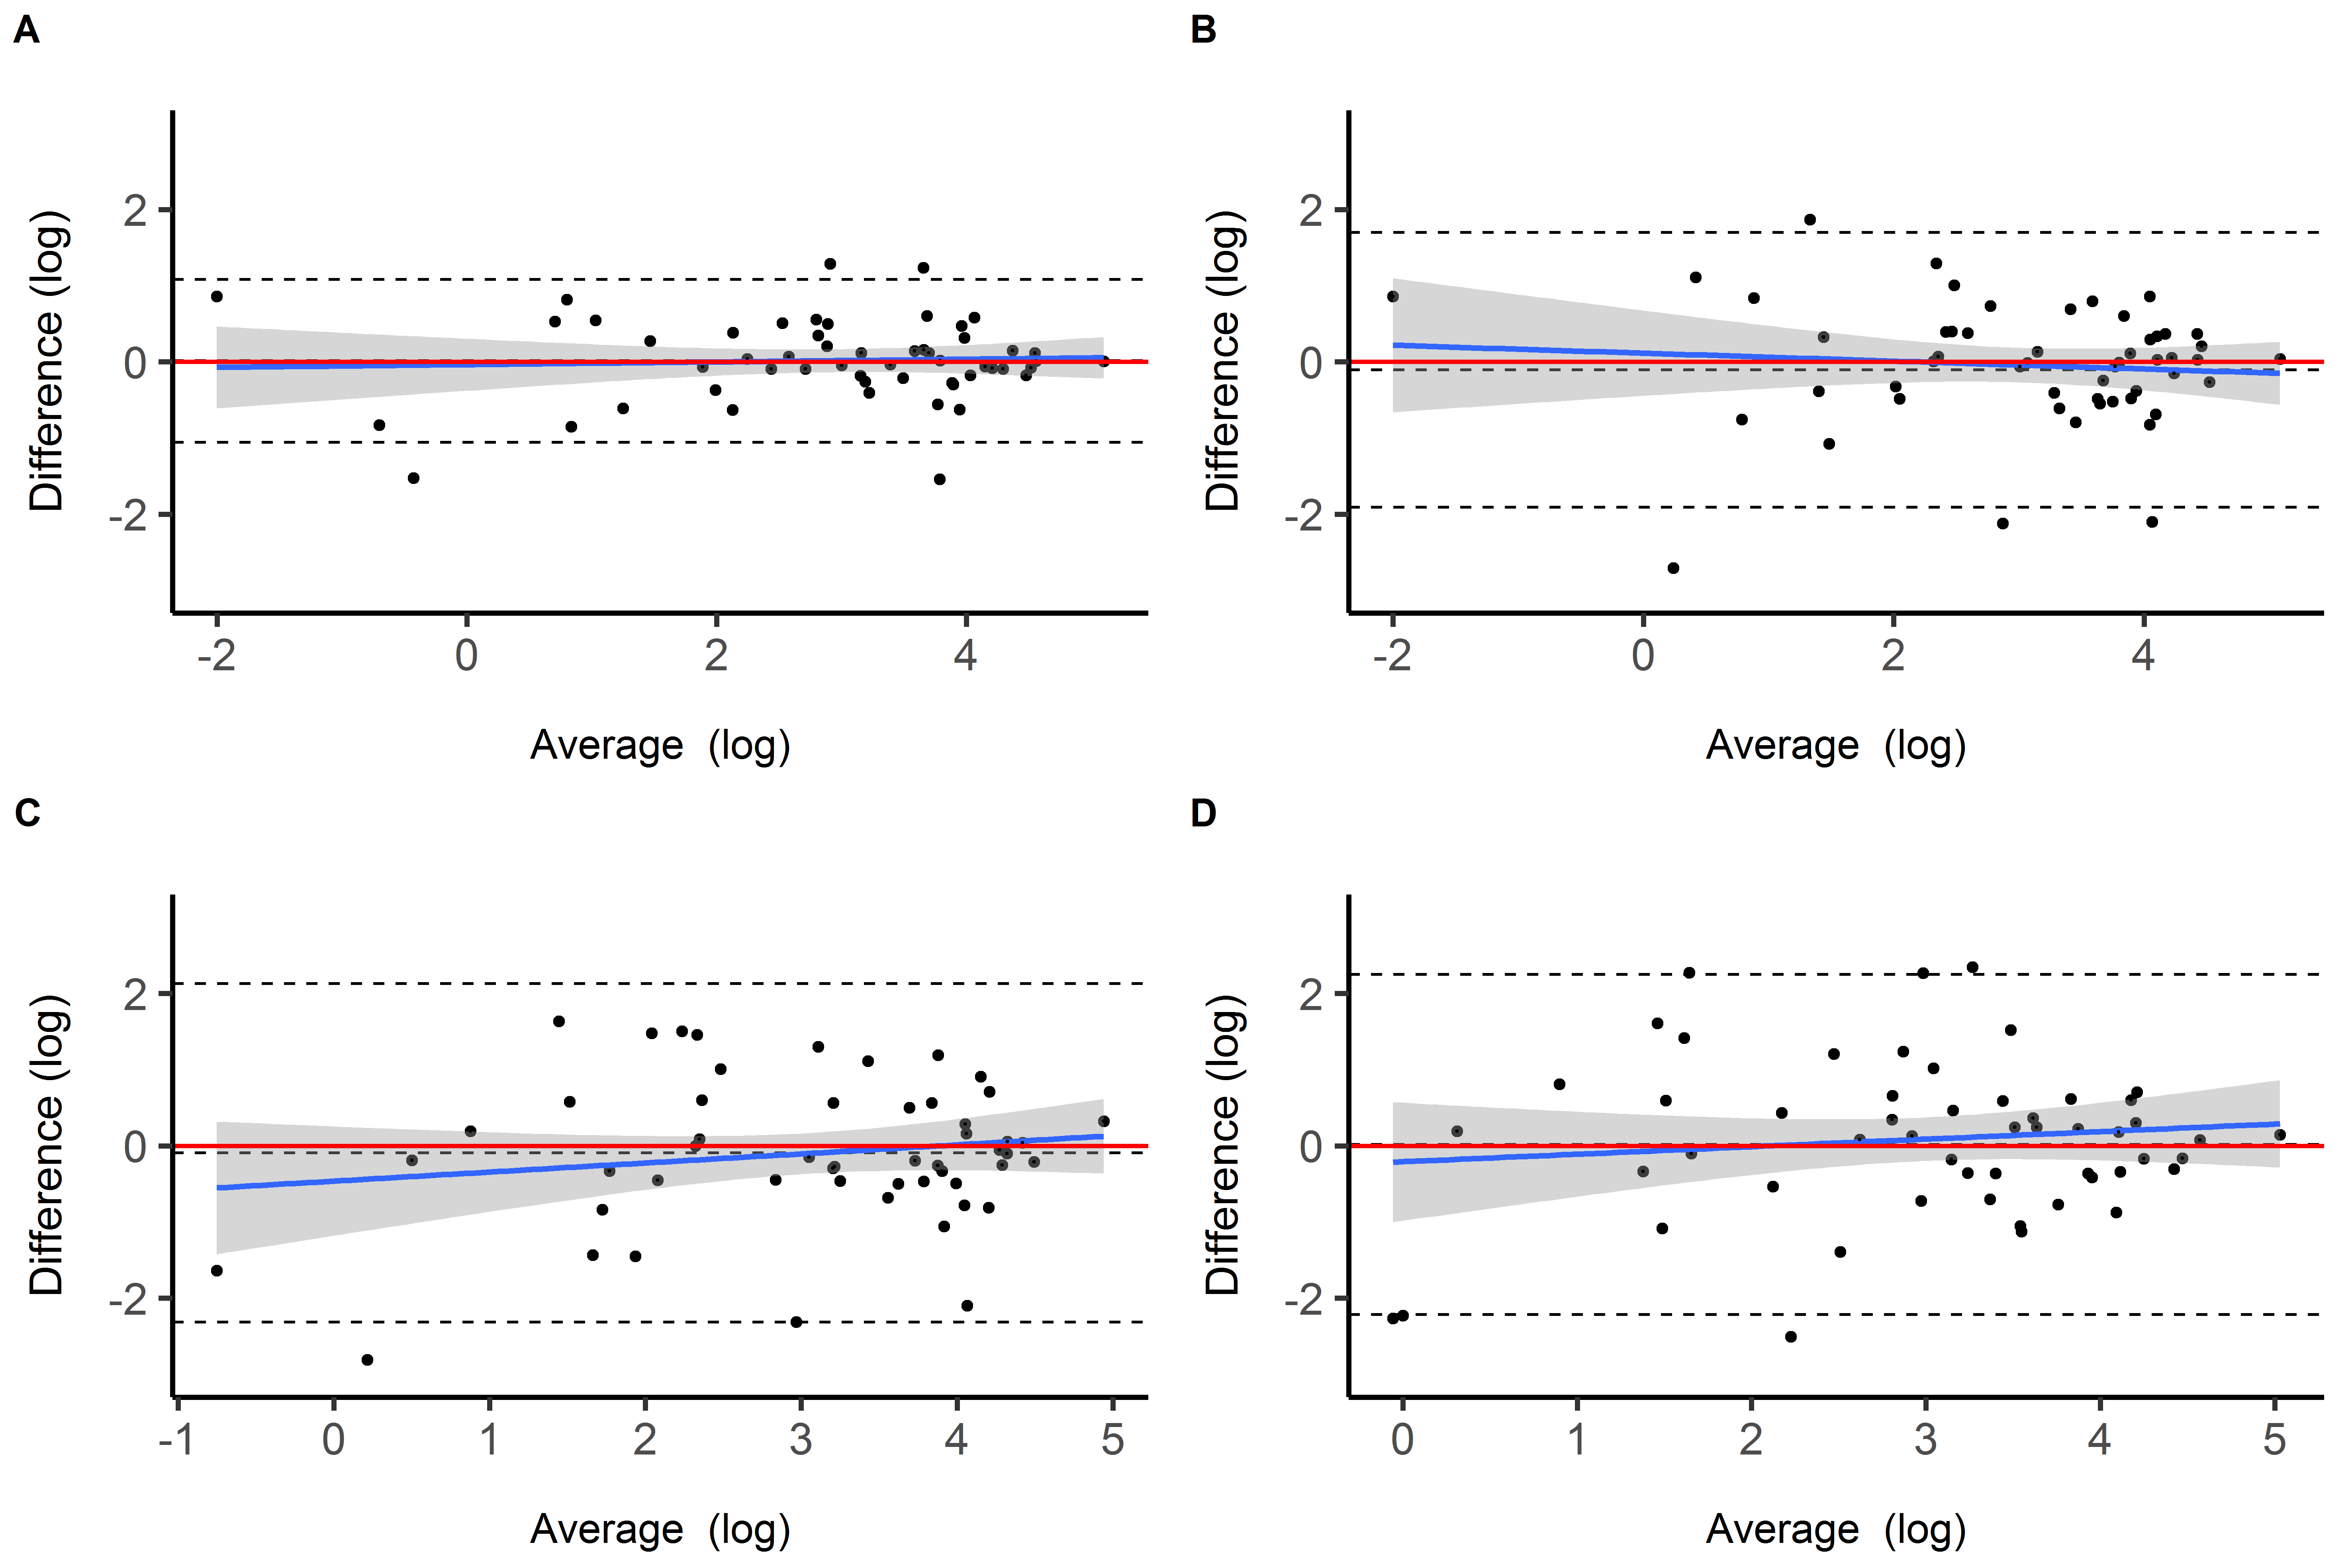
Figure 2. Bland-Altman plots for the comparison of the full scan with 4 shorter scans (A. 0.8 scan, B. 0.6 scan, C. 0.4 scan, D. 0.2 scan) in terms of measured lesion volumes. Top and bottom dashed lines represent the upper and lower limits of agreement (LoA), the middle dashed line refers to the mean of the difference (bias). Bias for each pair with upper and lower LoA is as follows: A) 0.17 (mL) [-33.37, 33.72], B) -3.49 (mL) [-57.84, 50.86], C) -2.62 (mL) [ -66.15, 60.91], D) 2.67 (mL) [-46.23, 51.58]