2724
Data-driven regularized inversion (DRI) for improved QSM+qBOLD based CMRO2 Mapping: a feasibility study in healthy subjects and ischemic stroke patients1Biomedical Engineering, Cornell University, Ithaca, NY, United States, 2Radiology, Tongji Hospital, Wuhan, China, 3Radiology, Weill Cornell Medical College, New York, NY, United States, 4Computer Assisted Clinical Medicine, Heidelberg University, Mannheim, Germany
Synopsis
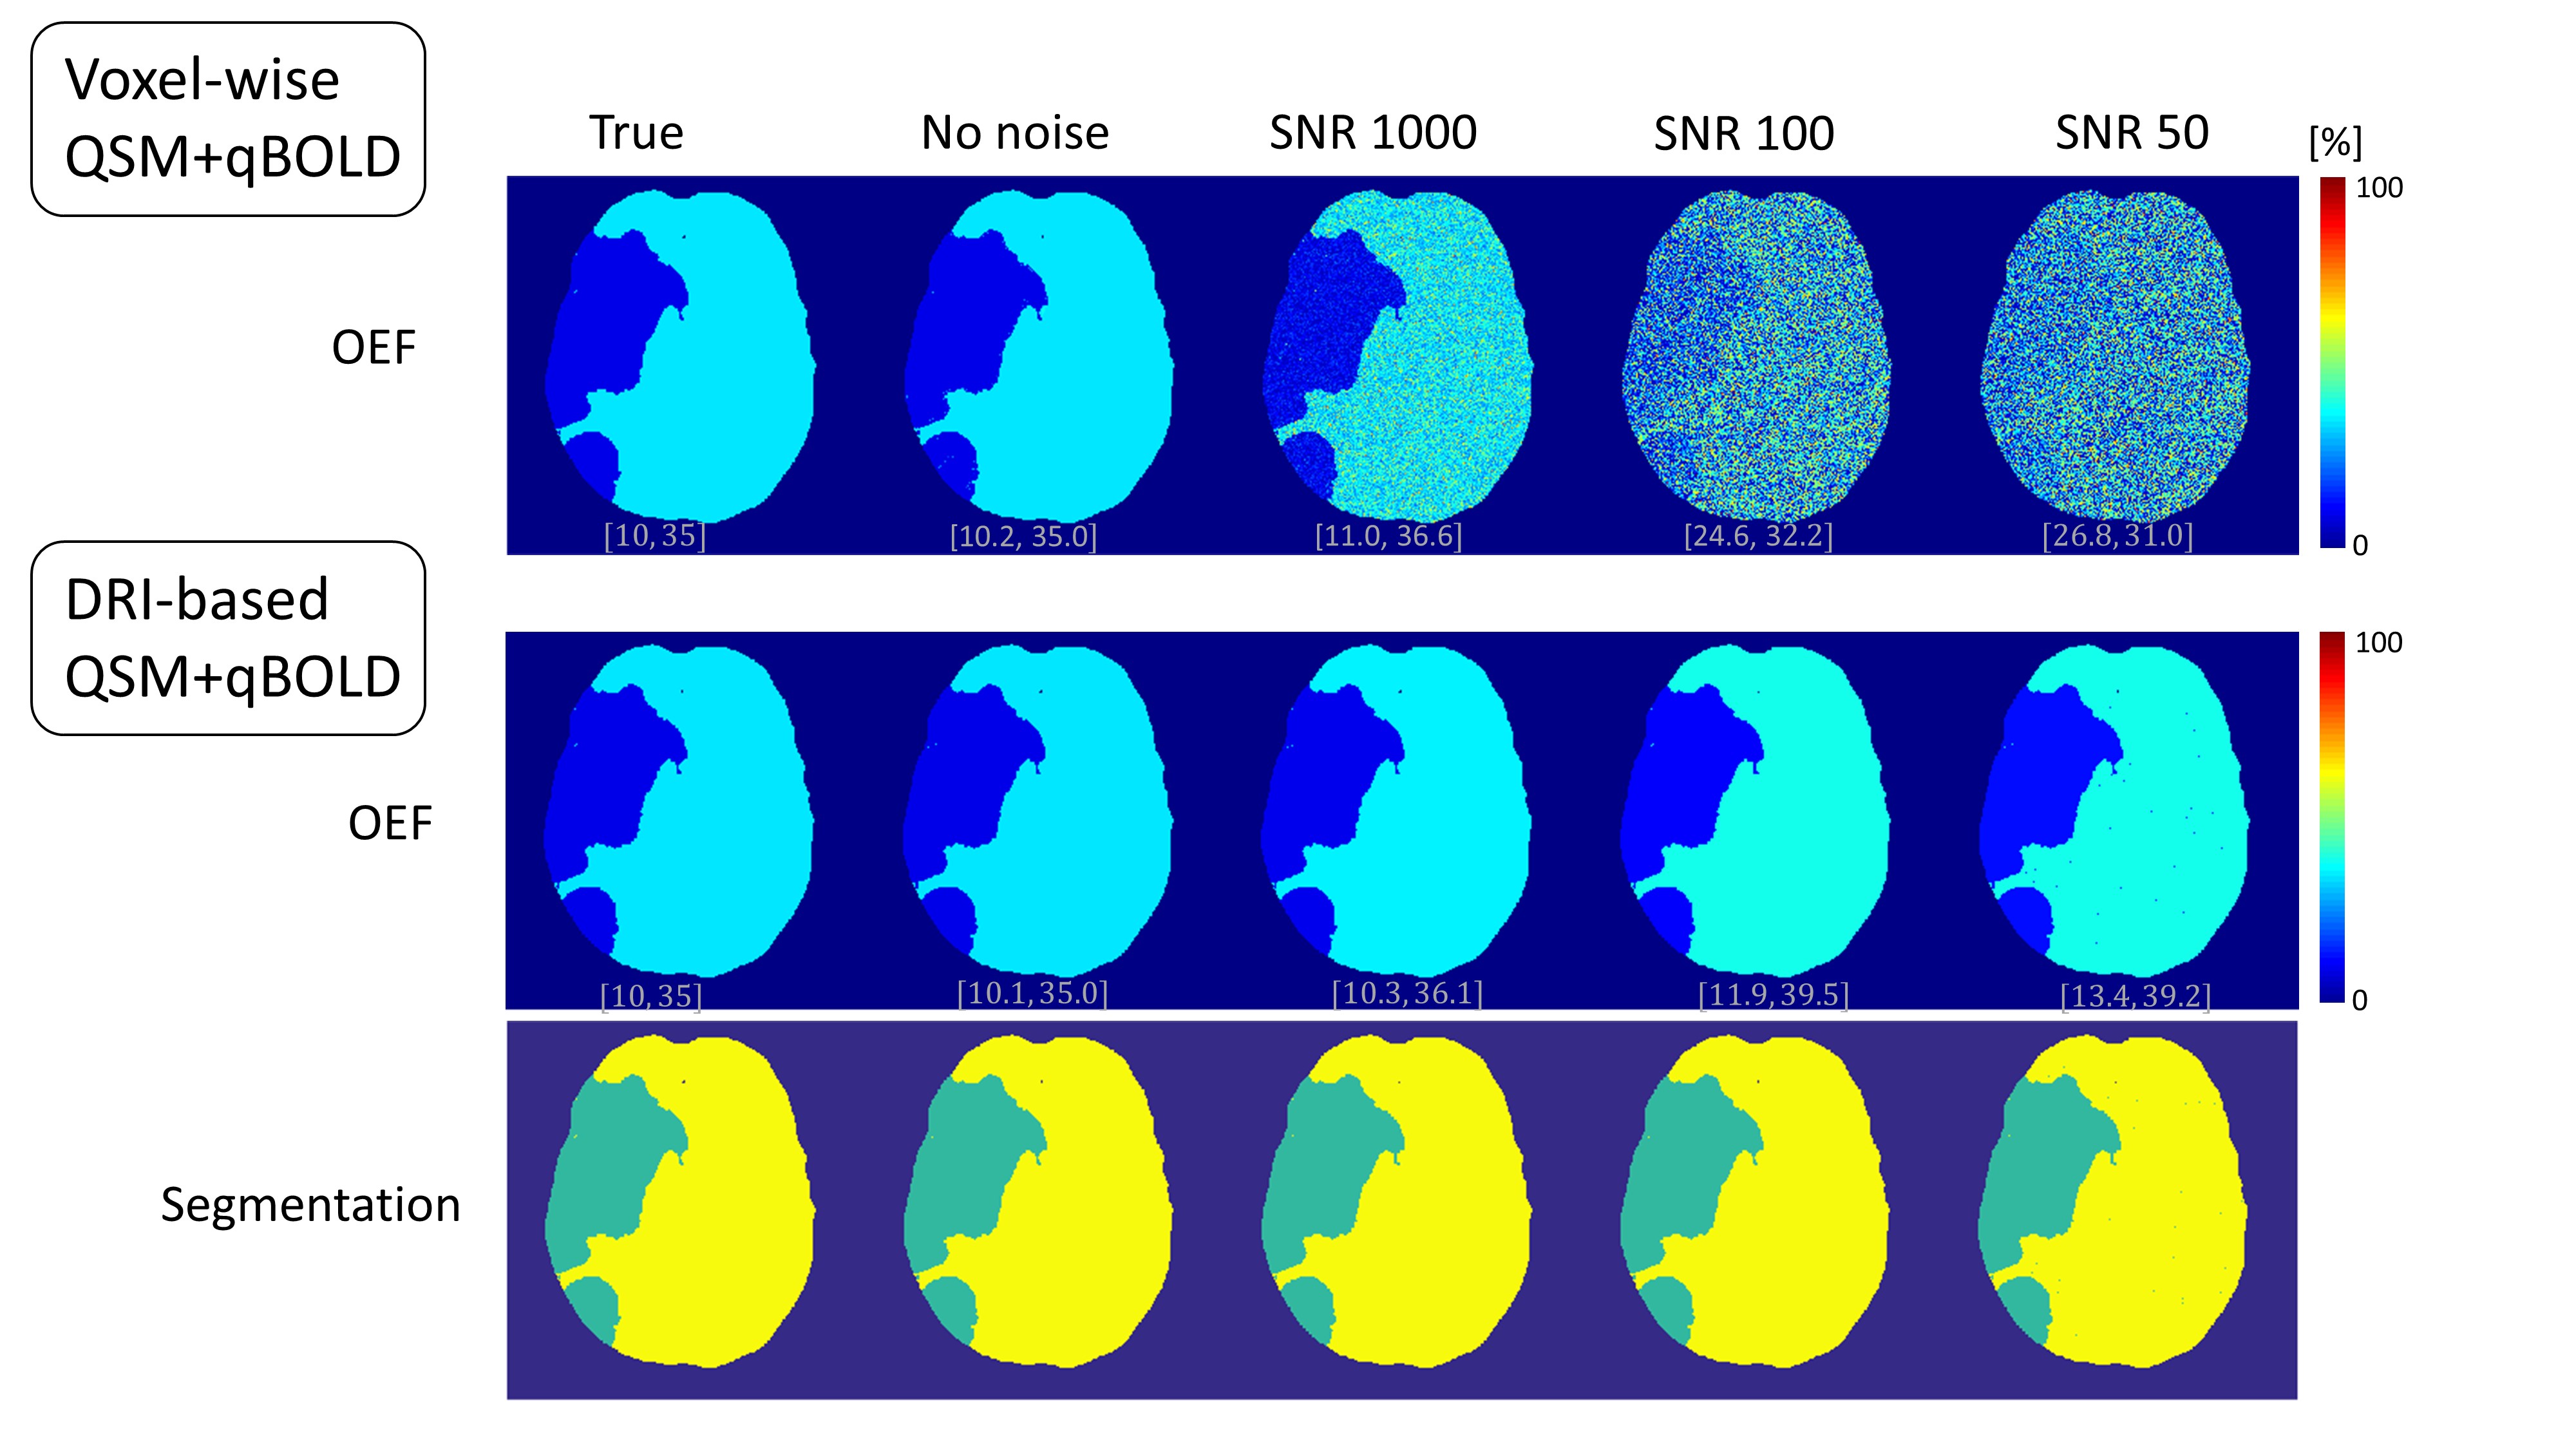
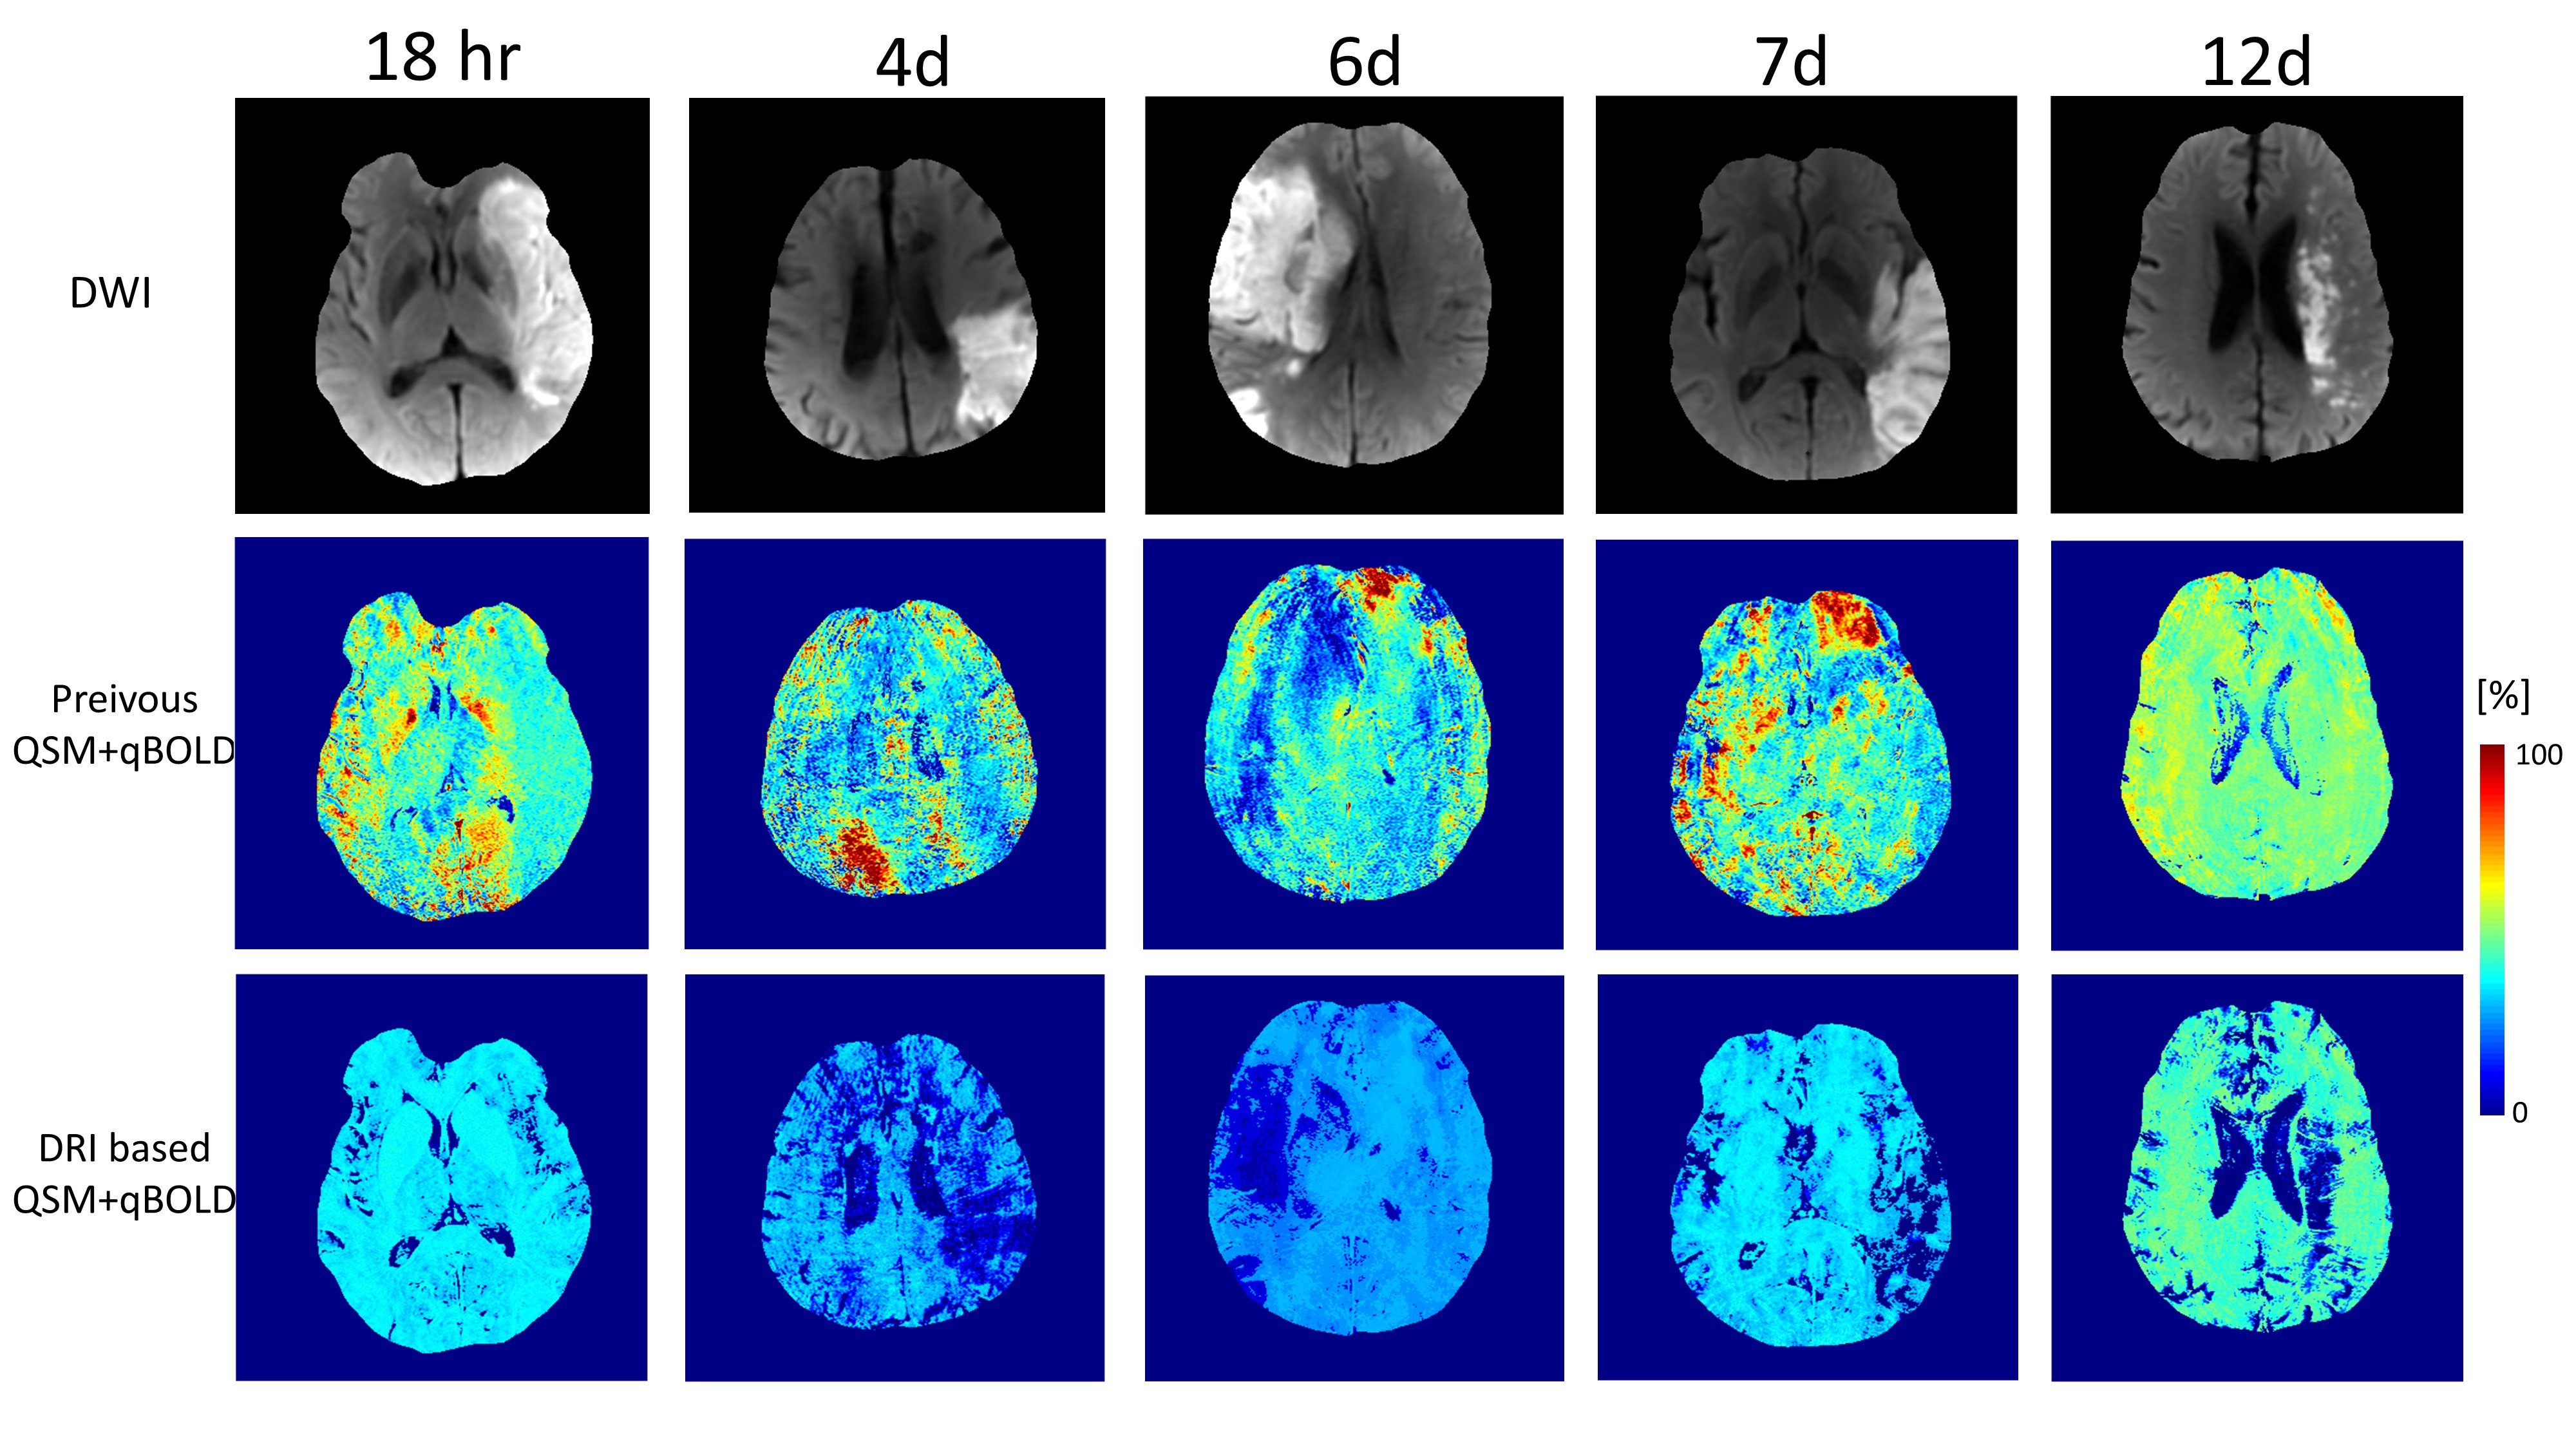
We propose the use of machine-learning to improve the accuracy of a QSM+qBOLD model based Cerebral metabolic rate of oxygen (CMRO2) and oxygen extraction fraction (OEF) mapping. The proposed method, data-driven regularized inversion or DRI, significantly outperformed, in simulation, the current method at all SNR levels. In n=11 healthy subjects, uniform OEF maps were obtained as expected. In n=18 ischemic stroke patients, low OEF regions were clearly located within the lesion region as defined by DWI.
Introduction
The cerebral metabolic rate of oxygen (CMRO2) and oxygen extraction fraction (OEF), important markers of brain tissue viability and function1-3, can be obtained from gradient echo (GRE) data using a combined QSM modeling of signal phase and qBOLD modeling of signal magnitude (QSM+qBOLD)4. However, qBOLD and hence QSM+qBOLD suffer from substantial errors caused by measurement noise propagation in parameter estimation or from low signal to noise ratio (SNR)5,6. Assuming sparse representation of tissue in the signal parameter space, we introduce a data-driven regularized inversion (DRI) method to obtain OEF and CMRO2 with improved SNR.Methods
CMRO2 (μmol/100g/min) and OEF (%) can be expressed as $$CMRO2=CBF\cdot OEF\cdot [H]_a$$ $$OEF=1-\frac{Y}{Y_a}$$ where CBF is the cerebral blood flow, $$$[H]_a$$$ is the oxygenated heme molar concentration in the arteriole (7.377 μmol/ml)7, $$$Y$$$ and $$$Y_a$$$ are venous and arterial (0.98) oxygenation. The QSM+qBOLD model consists of solving $$Y^*,v^*,\chi^*_{nb},S^{0*},R^*_2=argmin_{Y,v,\chi_{nb},S^{0},R_2}|||S|-F_{qBOLD}(Y,v,\chi_{nb},S^{0},R_2)||_2^2$$ $$Y^*,v^*,\chi^*_{nb}=argmin_{Y,v,\chi_{nb}}||F_{QSM}(Y,v,\chi_{nb})-QSM||_2^2$$ where $$$S^0$$$ the GRE signal at TE=0 and $$$R_2$$$ the cellular contribution to signal decay. $$F_{qBOLD}(Y,v,\chi_{nb},S^{0},R_2)=S^0 \cdot e^{-R_2\cdot TE}\cdot F_{BOLD}(v,\delta \omega(Y,\chi_{nb}),TE)\cdot G(TE)$$ where $$$F_{BOLD}$$$ and $$$G$$$ are extravascular and macroscopic contribution to magnitude decay6,8. $$$\delta \omega(Y,\chi_{nb})$$$ is the frequency difference between deoxygenated blood and the surrounding tissue: $$\delta \omega(Y,\chi_{nb})=\frac{1}{3}\cdot \gamma \cdot B_0 \cdot [\Delta \chi\cdot (1-Y)+\chi_{ba}-\chi_{nb}]$$ $$$\gamma$$$ is the gyromagnetic ratio (267.513 MHz/T), $$$B_0$$$=3T, $$$\Delta \chi$$$ is the susceptibility difference between fully oxygenated and fully deoxygenated blood ($$$0.357\times 4\pi \times 0.27$$$ ppm)9, $$$\chi_{ba}$$$ is purely oxygenated blood susceptibility ( -108.3 ppb). $$F_{QSM}(Y,v,\chi_{nb})=\left[\frac{\chi_{ba}}{\alpha}+\psi_{Hb}\cdot \Delta \chi_{Hb}\cdot (-Y+\frac{1-(1-\alpha)\cdot Y_a}{\alpha})\right]\cdot v + \left(1-\frac{v}{\alpha}\right)\cdot \chi_{nb}$$ where $$$\alpha$$$ is the ratio between vein and total blood volume assumed (0.77), $$$\psi_{Hb}$$$ the hemoglobin volume fraction (0.0909 for tissue and 0.1197 for vein), $$$\Delta \chi_{Hb}$$$ the susceptibility difference between deoxy- and oxy-hemoglobin (12522 ppb)7,10,11.
Data-driven Regularized Inversion
The idea behind DRI is that voxels with similar GRE signal curves should have similar parameters ($$$Y,v,R_2$$$). To identify clusters of similar signal, k-means clustering was applied. Once clusters are obtained, the parameters ($$$Y,v,R_2$$$) are assumed to be uniform within each cluster, thereby effectively increasing SNR for inversion significantly.
Optimization
An initial guess for $$$Y_0$$$ was obtained from the sagittal sinus, $$$\chi_{nb,0}$$$ set to $$$\chi_{ba}$$$, and $$$R_{2,0}$$$ obtained from a mono-exponential fit against Eq. 5 with $$$Y_0,v_0,\chi_{nb,0}$$$.Three initial values for $$$v$$$ were selected (1, 2, and 3 %). The $$$Y,v,R_2$$$ were scaled by their initial guess: $$$x\mapsto \frac{x}{avg(x_0)+4\cdot std(x_0)}$$$. The L-BFGS-B algorithm12,13 was used for constrained optimization. At each iteration, $$$\chi_{nb}$$$ was updated from Eq. 4 and the other unknowns were updated from Eq. 3. The solution with the smallest residual across the three $$$v_0$$$ values was selected. After performing the optimization with ($$$Y,v,R_2$$$) constant within each cluster, the $$$Y,v,R_2$$$ values were updated voxel-to-voxel using the cluster-based result as initial guess.
Validation
The proposed DRI-based QSM+qBOLD was compared with voxel-wise QSM+qBOLD in a numerical simulation (Fig. 1) and with the previous QSM+qBOLD with the constant OEF initial guess4 in n=11 healthy subjects at 3T: 3D ASL (20 cm FOV, 1.56x1.56x3.5 mm3 voxel size, 1500 ms labeling period, 1525 ms post-label delay) and 3D spoiled Gradient Echo (SPGR, 0.78x0.78x1.2 mm3 voxel size, 7 echoes, TE1=2.3ms, 3.9 ms, 30.5 ms), and n=18 ischemic stroke patients at 3T: 3D ASL (24 cm FOV, 1.9x1.9x2.0 mm3 voxel size, 1500 ms labeling period, 1525 ms post-label delay) and 3D spoiled Gradient Echo (SPGR, 0.47x0.47x2 mm3 voxel size, 8 echoes, TE1=4.5ms, 4.9 ms, 42.8 ms).
Result
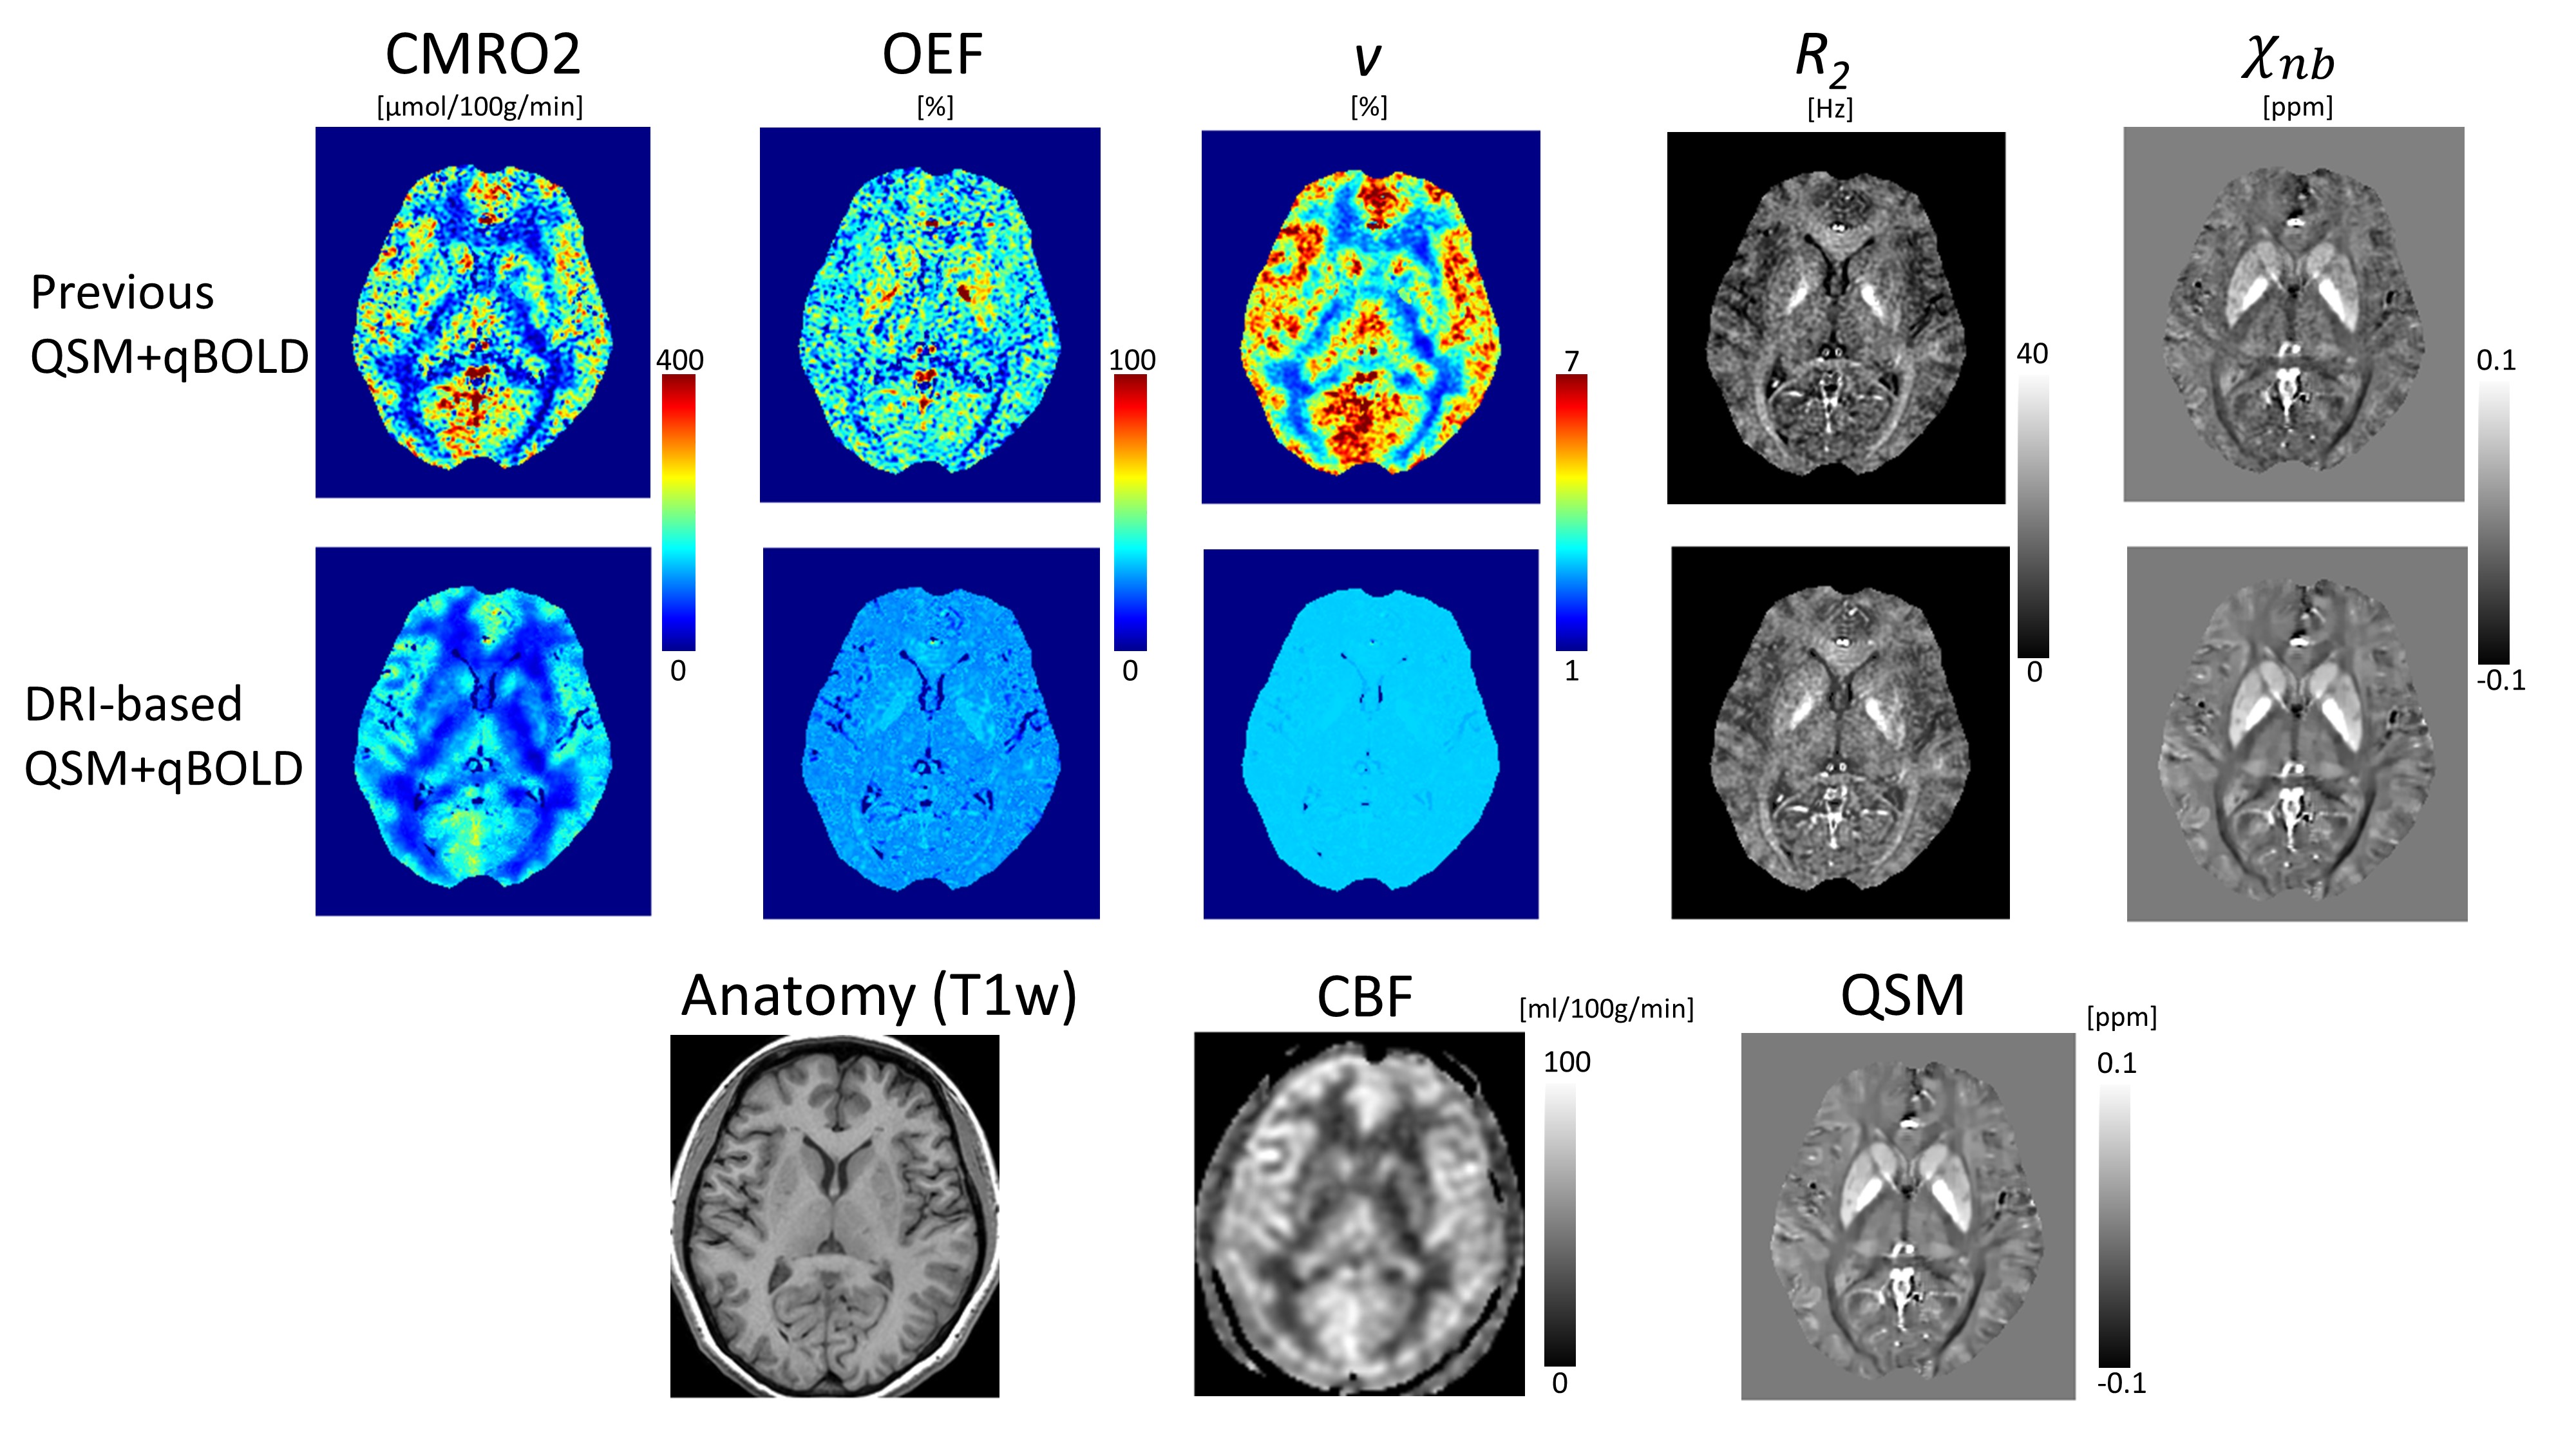
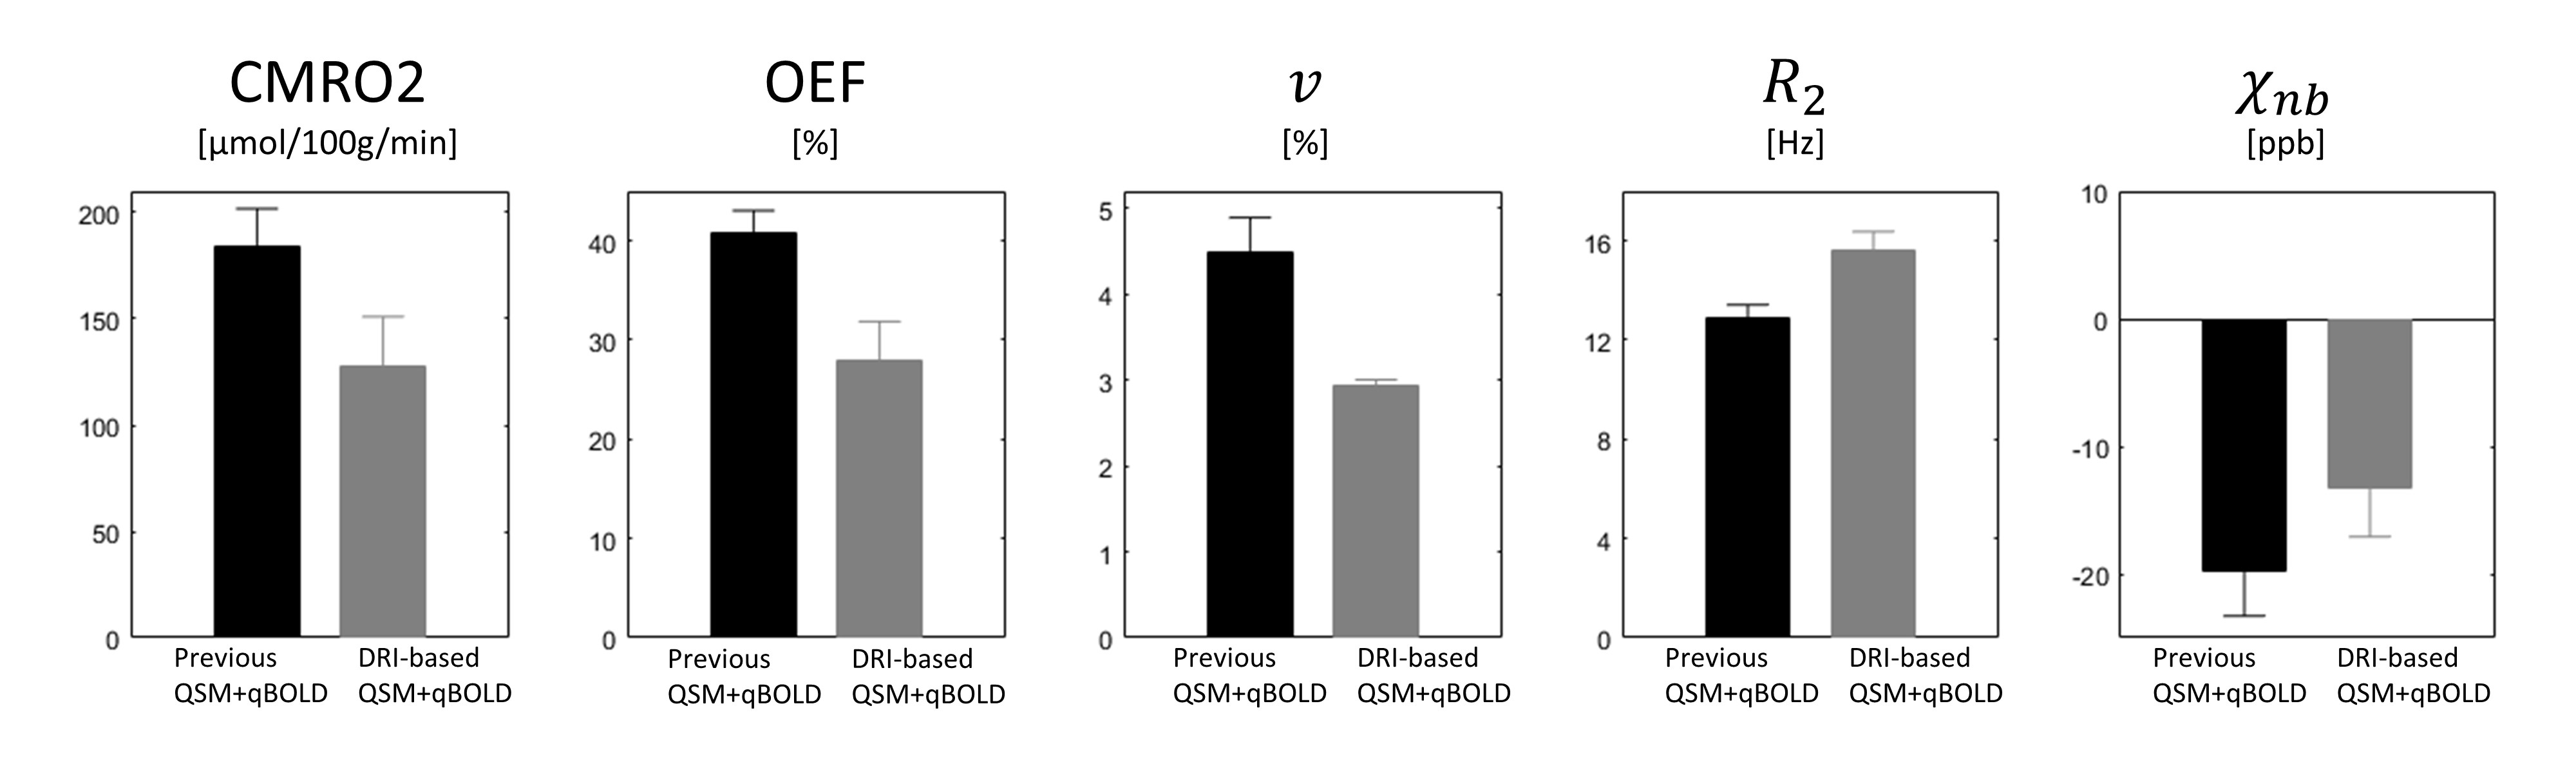
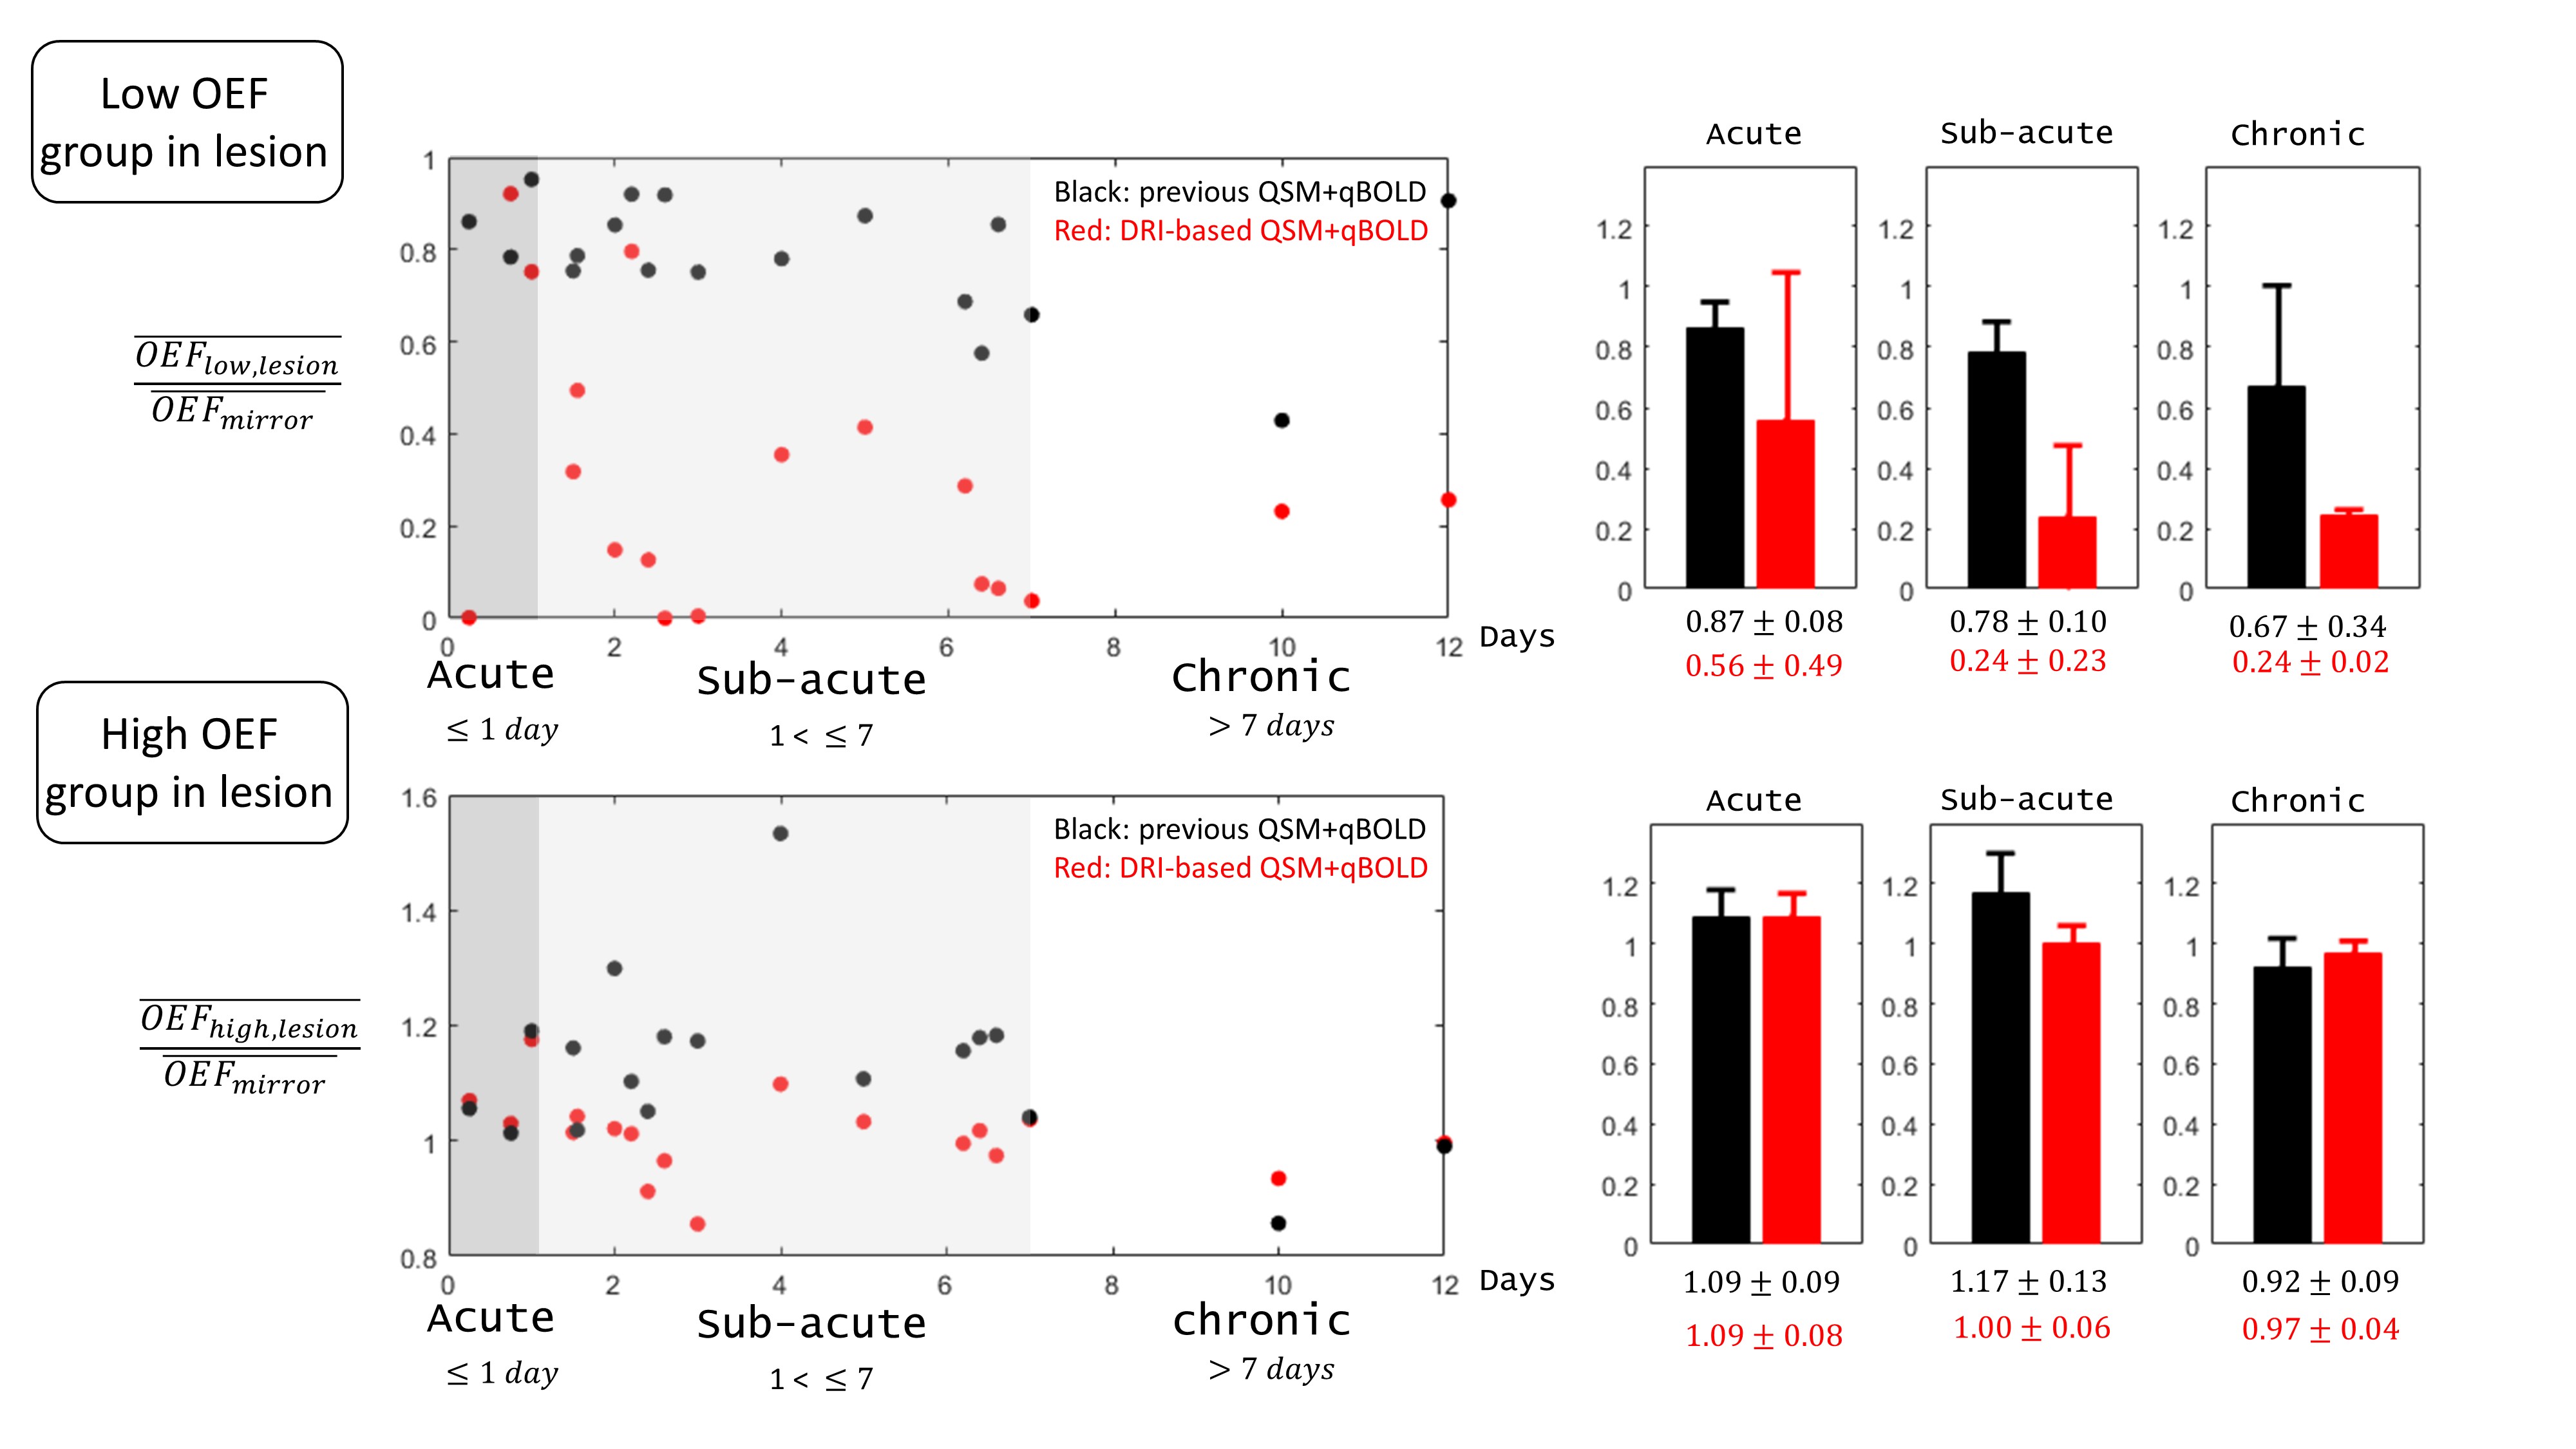
DRI-based QSM+qBOLD provides a more accurate OEF map than voxel-wise QSM+qBOLD in simulation especially at low SNRs (Fig. 1). In healthy volunteers, the DRI-based QSM+qBOLD shows uniform OEF, whereas the previous method provides higher OEF with extreme values in Globus pallidus (Figs. 2 and 3). In ischemic stroke patients, low OEF regions by DRI-based QSM+qBOLD are well within DWI defined lesions, which is not the case for the previous QSM+qBOLD method (Fig. 4). DRI-based QSM+qBOLD is sensitive to low OEF values in the lesion (Fig. 5).Discussion
Uniform OEF in healthy subjects (Fig. 2) and low lesion OEF values in the chronic stroke patients and large inter-subject OEF variation among the acute stroke patients (Figs. 4 and 5) from DRI-based QSM+qBOLD are consistent with prior PET studies14-16. More accurate OEF seems to result from increasing SNR effectively with DRI (Fig. 1). Both DRI-based QSM+qBOLD and previous QSM+qBOLD provided reasonable OEF values in healthy subjects (Fig. 3)17,18.Conclusion
This study shows the feasibility of the data-driven regularized inversion in QSM+qBOLD based CMRO2 mapping in both healthy subjects and stroke patients. With highly improved accuracy in simulation, DRI-based QSM+qBOLD may be readily applied to investigate tissue viability in various diseases, such as Alzheimer’s disease19,20, multiple sclerosis21, tumor22, and ischemic stroke23.Acknowledgements
This work was supported by NIH grant R01 NS095562, R01 NS060464, R01 CA181566, R21 EB024366, S10 OD021782.References
1. Derdeyn CP, Videen TO, Yundt KD, Fritsch SM, Carpenter DA, Grubb RL, Powers WJ. Variability of cerebral blood volume and oxygen extraction: stages of cerebral haemodynamic impairment revisited. Brain : a journal of neurology 2002;125(Pt 3):595-607.
2. Gupta A, Chazen JL, Hartman M, Delgado D, Anumula N, Shao H, Mazumdar M, Segal AZ, Kamel H, Leifer D, Sanelli PC. Cerebrovascular reserve and stroke risk in patients with carotid stenosis or occlusion: a systematic review and meta-analysis. Stroke 2012;43(11):2884-2891.
3. Gupta A, Baradaran H, Schweitzer AD, Kamel H, Pandya A, Delgado D, Wright D, Hurtado-Rua S, Wang Y, Sanelli PC. Oxygen Extraction Fraction and Stroke Risk in Patients with Carotid Stenosis or Occlusion: A Systematic Review and Meta-Analysis. American Journal of Neuroradiology 2014;35(2):250-255.
4. Cho J, Kee Y, Spincemaille P, Nguyen TD, Zhang J, Gupta A, Zhang S, Wang Y. Cerebral metabolic rate of oxygen (CMRO2) mapping by combining quantitative susceptibility mapping (QSM) and quantitative blood oxygenation level-dependent imaging (qBOLD). Magnetic resonance in medicine 2018;80(4):1595-1604.
5. Lee H, Englund EK, Wehrli FW. Interleaved quantitative BOLD: Combining extravascular R2' - and intravascular R2-measurements for estimation of deoxygenated blood volume and hemoglobin oxygen saturation. Neuroimage 2018;174:420-431.
6. Yablonskiy DA, Sukstanskii AL, He X. BOLD-based Techniques for Quantifying Brain Hemodynamic and Metabolic Properties – Theoretical Models and Experimental Approaches. NMR in biomedicine 2013;26(8):963-986.
7. Zhang J, Cho J, Zhou D, Nguyen TD, Spincemaille P, Gupta A, Wang Y. Quantitative susceptibility mapping-based cerebral metabolic rate of oxygen mapping with minimum local variance. Magn Reson Med 2017.
8. X. U, DA. Y. Enhancing image contrast in human brain by voxel spread function method. In Proceedings of the 22nd Annual Meeting of ISMRM;Milan, Italy, Abstract 3197.
9. Ulrich X, Yablonskiy DA. Separation of cellular and BOLD contributions to T2* signal relaxation. Magnetic resonance in medicine 2016;75(2):606-615.
10. Zhang J, Liu T, Gupta A, Spincemaille P, Nguyen TD, Wang Y. Quantitative mapping of cerebral metabolic rate of oxygen (CMRO2) using quantitative susceptibility mapping (QSM). Magnetic Resonance in Medicine 2015;74(4):945-952.
11. Zhang J, Zhou D, Nguyen TD, Spincemaille P, Gupta A, Wang Y. Cerebral metabolic rate of oxygen (CMRO2) mapping with hyperventilation challenge using quantitative susceptibility mapping (QSM). Magnetic resonance in medicine 2017;77(5):1762-1773.
12. Liu DC, Nocedal J. On the limited memory BFGS method for large scale optimization. Mathematical programming 1989;45(1):503-528.
13. Byrd RH, Lu P, Nocedal J, Zhu C. A limited memory algorithm for bound constrained optimization. SIAM Journal on Scientific Computing 1995;16(5):1190-1208.
14. Raichle ME, MacLeod AM, Snyder AZ, Powers WJ, Gusnard DA, Shulman GL. A default mode of brain function. Proceedings of the National Academy of Sciences 2001;98(2):676-682.
15. Grotta JC, Lo EH. Stroke: Pathophysiology, Diagnosis, and Management: Elsevier; 2015.
16. Guadagno JV, Warburton EA, Jones PS, Fryer TD, Day DJ, Gillard JH, Carpenter TA, Aigbirhio FI, Price CJ, Baron JC. The Diffusion-Weighted Lesion in Acute Stroke: Heterogeneous Patterns of Flow/Metabolism Uncoupling as Assessed by Quantitative Positron Emission Tomography. Cerebrovascular Diseases 2005;19(4):239-246.
17. Bolar DS, Rosen BR, Sorensen A, Adalsteinsson E. QUantitative Imaging of eXtraction of oxygen and TIssue consumption (QUIXOTIC) using venular‐targeted velocity‐selective spin labeling. Magnetic resonance in medicine 2011;66(6):1550-1562.
18. Stone AJ, Blockley NP. A streamlined acquisition for mapping baseline brain oxygenation using quantitative BOLD. Neuroimage 2017;147:79-88.
19. Sun X, He G, Qing H, Zhou W, Dobie F, Cai F, Staufenbiel M, Huang LE, Song W. Hypoxia facilitates Alzheimer's disease pathogenesis by up-regulating BACE1 gene expression. Proceedings of the National Academy of Sciences of the United States of America 2006;103(49):18727-18732.
20. Acosta-Cabronero J, Williams GB, Cardenas-Blanco A, Arnold RJ, Lupson V, Nestor PJ. In vivo quantitative susceptibility mapping (QSM) in Alzheimer's disease. PloS one 2013;8(11):e81093.
21. Trapp BD, Stys PK. Virtual hypoxia and chronic necrosis of demyelinated axons in multiple sclerosis. The Lancet Neurology 2009;8(3):280-291.
22. Stadlbauer A, Zimmermann M, Kitzwogerer M, Oberndorfer S, Rossler K, Dorfler A, Buchfelder M, Heinz G. MR Imaging-derived Oxygen Metabolism and Neovascularization Characterization for Grading and IDH Gene Mutation Detection of Gliomas. Radiology 2017;283(3):799-809.
23. Kudo K, Liu T, Murakami T, Goodwin J, Uwano I, Yamashita F, Higuchi S, Wang Y, Ogasawara K, Ogawa A, Sasaki M. Oxygen extraction fraction measurement using quantitative susceptibility mapping: Comparison with positron emission tomography. Journal of cerebral blood flow and metabolism : official journal of the International Society of Cerebral Blood Flow and Metabolism 2016;36(8):1424-1433.
Figures