2722
Direct reconstruction of arterial blood flow (aBF) from undersampled golden-angle radial non-contrast enhanced dynamic 4D MR angiography1Laboratory of Functional MRI Technology (LOFT), Stevens Neuroimaging and Informatics Institute, Department of Neurology, University of Southern California, Los Angeles, CA, United States, 2Ming Hsieh Department of Electrical Engineering, Viterbi School of Engineering, University of Southern California, Los Angeles, CA, United States
Synopsis
Quantification of hemodynamics benefits clinical diagnosis. Non-contrast enhanced MRA with golden-angle radial acquisition has capability of characterization of dynamic flow with high spatiotemporal resolution within a short scan time. Here, we proposed a direct reconstruction framework of arterial blood flow (aBF) from undersampled radial dMRA K-t space data, which mitigated streaking artifacts induced by image-based reconstruction. Both simulation and experimental data suggested that direct optimization method provides reliable aBF under different undersampling rates while preserving detailed delineation of vascular structures, compared to the conventional post-processing singular value decomposition (SVD) method.
Introduction
Evaluation of flow dynamics with quantitative hemodynamics provides important information in the diagnosis of cerebrovascular disease. Recently, a rapid non-contrast enhanced dynamic 4D MR angiography (NCE-dMRA) using golden-angle radial sampling has shown promise to depict dynamic flow information with good image quality.1, 2 The modern techniques for arterial blood flow(aBF) quantification mainly rely on post-processing methods after image reconstruction, e.g. truncated singular value decomposition (t-SVD). However, the quantification accuracy is highly affected by the deconvolution procedure accompanied by potential noise and artifacts introduced during reconstruction. The purpose of this study is to develop and evaluate a direct reconstruction method by which aBF map is directly estimated from under-sampled golden-angle radial NCE-dMRA K-t space data.
Theory
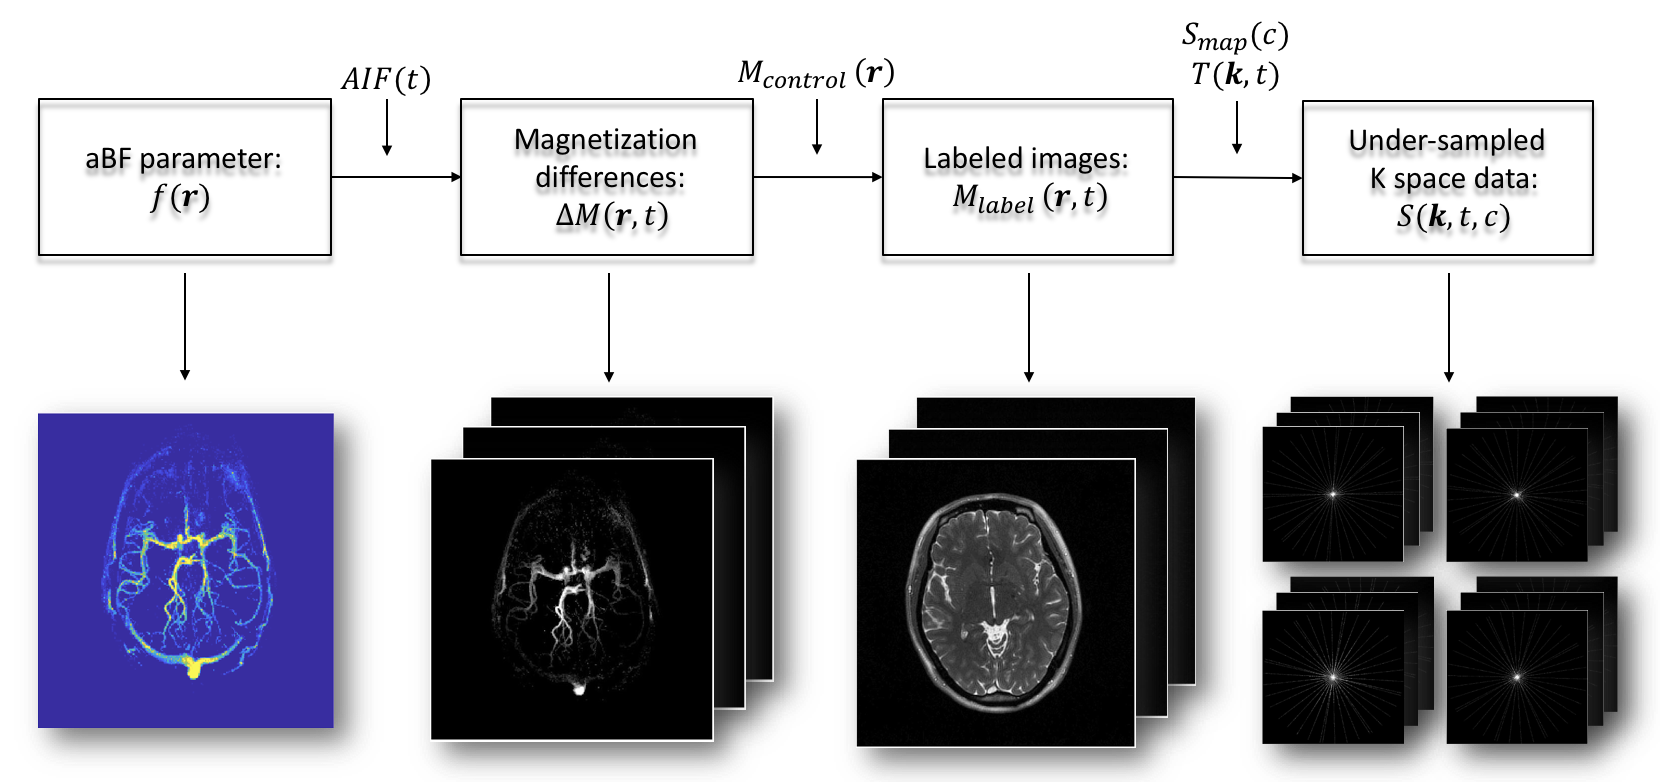
The forward flowchart of aBF reconstruction using under-sampled K-t space data can be illustrated by three steps(Figure 1). Specifically, the vectors $$$\mathbf{r} \in (x,y,z)$$$ and $$$\mathbf{k} \in ( k_x, k_y, k_z)$$$ represent image domain spatial coordinates and K-space frequency domain coordinates, respectively. $$$\it t$$$, $$$\it c$$$ are time and coil dimensions.
Step1, the time series of subtracted blood signals $$$\Delta M(\mathbf{r},t_j)$$$ can be generated by the convolution of arterial input function (AIF) and residual function (R) using a general kinetic model 3 (Eq.[1]): $$\Delta M(\mathbf{r},t_j) = \Delta TI \cdot aBF(\mathbf{r})\cdot\sum_{i=0}^j AIF(t_j)\cdot R(\mathbf{r},t_{j-i}) \tag{1}$$ where $$$aBF(\mathbf{r})$$$ is arterial blood flow of each voxel, and $$$\Delta TI$$$ is the time interval between phases. By setting $$$R'(t) = aBF \cdot R(t)$$$, the formula can be rewritten as (Eq.[2]): $$\Delta M(\mathbf{r},t_j) = \Delta TI \cdot\sum_{i=0}^j AIF(t_j)\cdot R'(\mathbf{r},t_{j-i}) \tag{2}$$ Step2, dynamic labeled images are calculated by subtracting from fully-sampled control image (Eq.[3]): $$M_{label}(\mathbf{r},t) = M_{control}(\mathbf{r}) - \Delta M(\mathbf{r},t) \tag{3}$$ Step3, the under-sampled raw (k-t) data is obtained from labeled images $$$M_{label}(\mathbf{r},t)$$$ combining with coil sensitivities $$$C(\mathbf{r},c)$$$ and under-sampling Fourier operator $$$F_u$$$ (Eq.[4]): $$S(\mathbf{k},t,c) = F_uC(\mathbf{r},c)M_{label}(\mathbf{r},t) \tag{4}$$ Combining the 3 steps above, the overall transformation function, denoted by $$$f$$$, shows a general relationship between $$$aBF(\mathbf{r})$$$ and under-sampled K-t space data $$$S(\mathbf{r},t,c)$$$ (Eq.[5]): $$S(\mathbf{r},t,c)=f(aBF(\mathbf{r}),R(\mathbf{r},t);AIF(t),\Delta TI,M_{control}(\mathbf{r}),C(\mathbf{r},c)) \tag{5}$$ Instead of solving $$$aBF(\mathbf{r})$$$, we solve residue function $$$R'(\mathbf{r},t)$$$ by least-square optimization using compressed sensing method with additional sparsity constrains, after which $$$aBF(\mathbf{r})$$$ parameters can be achieved by taking the maximum value of $$$R'(\mathbf{r},t)$$$.4 The optimization problem with additional regularization parameters is formulated as follows (Eq.[6]): $$\underset{R'(\mathbf{r},t)}{\mathrm{argmin}} \| S’(\mathbf{k},t,c) - F_u C(\mathbf{k},c)(M_{control}(\mathbf{r})-\Delta TI \cdot AIF(t) \ast R'(\mathbf{r},t))\|^2_2 +\lambda _1\|\psi R'(\mathbf{r},t)\|_1+\lambda _2\|\psi' R'(\mathbf{r},t)\|_1 \tag{6}$$ where $$$S’(\mathbf{k},t,c)$$$ is raw (k-t)-space data of labeled images. For sparsity terms, we use spatial $$$(\psi)$$$ and temporal $$$(\psi ')$$$ total variation(TV) terms with corresponding regularization parameters $$$\lambda _1$$$ and $$$\lambda _2$$$. This nonlinear optimization problem is solved by Nonlinear Conjugate Gradient method.
Methods
Simulation
Radial NCE-dMRA data was simulated with known aBF on a virtual phantom generated from TOF images to evaluate the robustness of aBF quantification under different under-sampling rates and noise levels. A global AIF was simulated by a gamma-variate function.5 Residual function of each voxel was an exponential decay by incorporating blood arrival time $$$\tau _r$$$. aBF values were calculated by directed reconstruction with under-sampling rate R = 10, 20, 40, 80 at SNR = 5, 10, 15, 20 and 25, respectively.
In-vivo MRI scan
All experiments were performed on a Siemens Prisma 3T scanner with a 20-channel head coil. Golden-angle radial NCE-dMRA data were collected on two healthy volunteers (FOV=256x256mm2, voxel size=1x1x1.5mm3, 500 views per slice). No pre-saturation was applied before ASL inversion pulse.
Results and Discussion
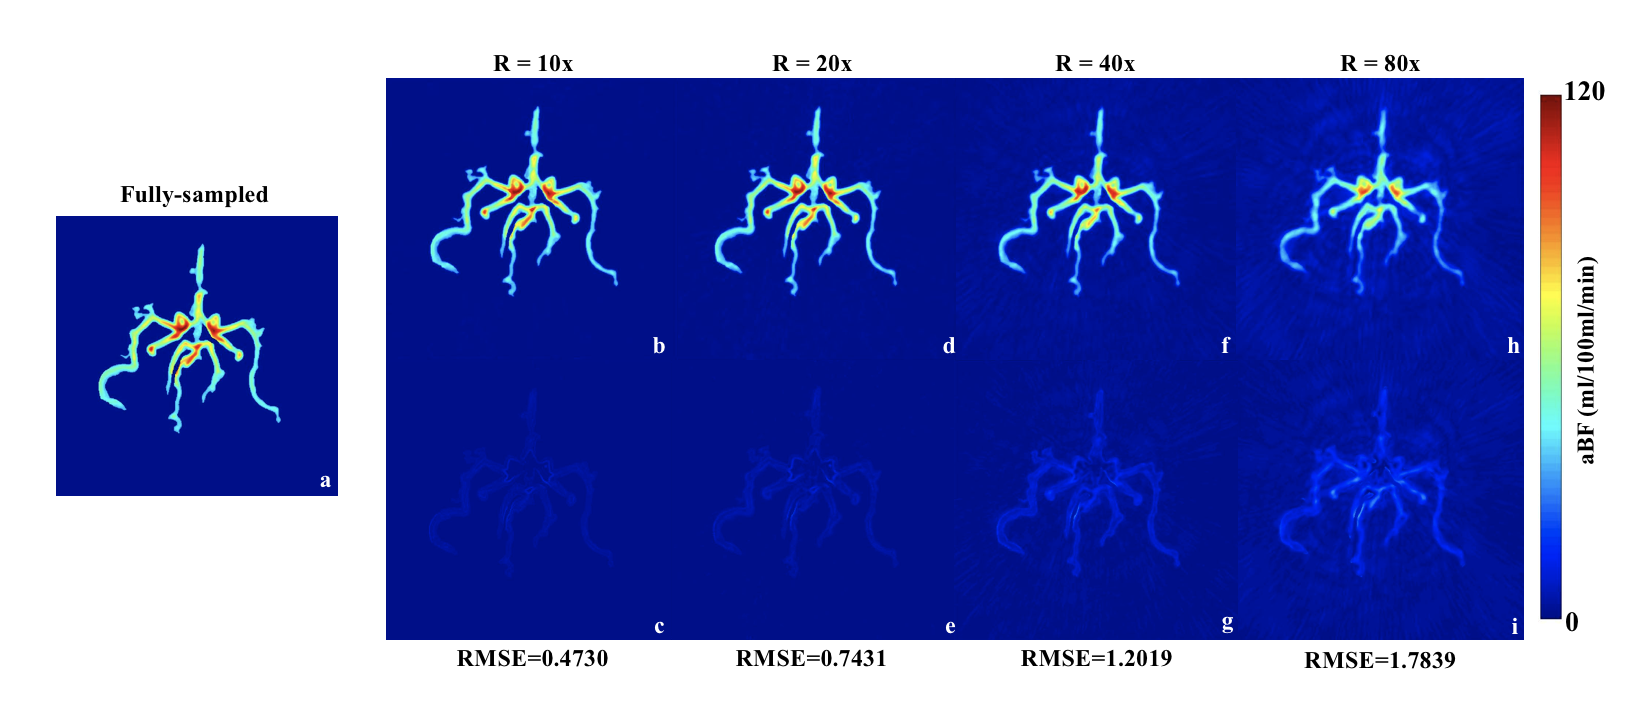
Figure 2 shows simulated aBF reconstruction and corresponding error maps (RMSE = 0.4730, 0.7431, 1.2019 and 1.7839) with different under-sampling rates (R = 10, 20, 40, 80). Directed reconstruction method preserved reliable estimation accuracy even under large under-sampling rates up to 80, while maintaining an average low noise level.
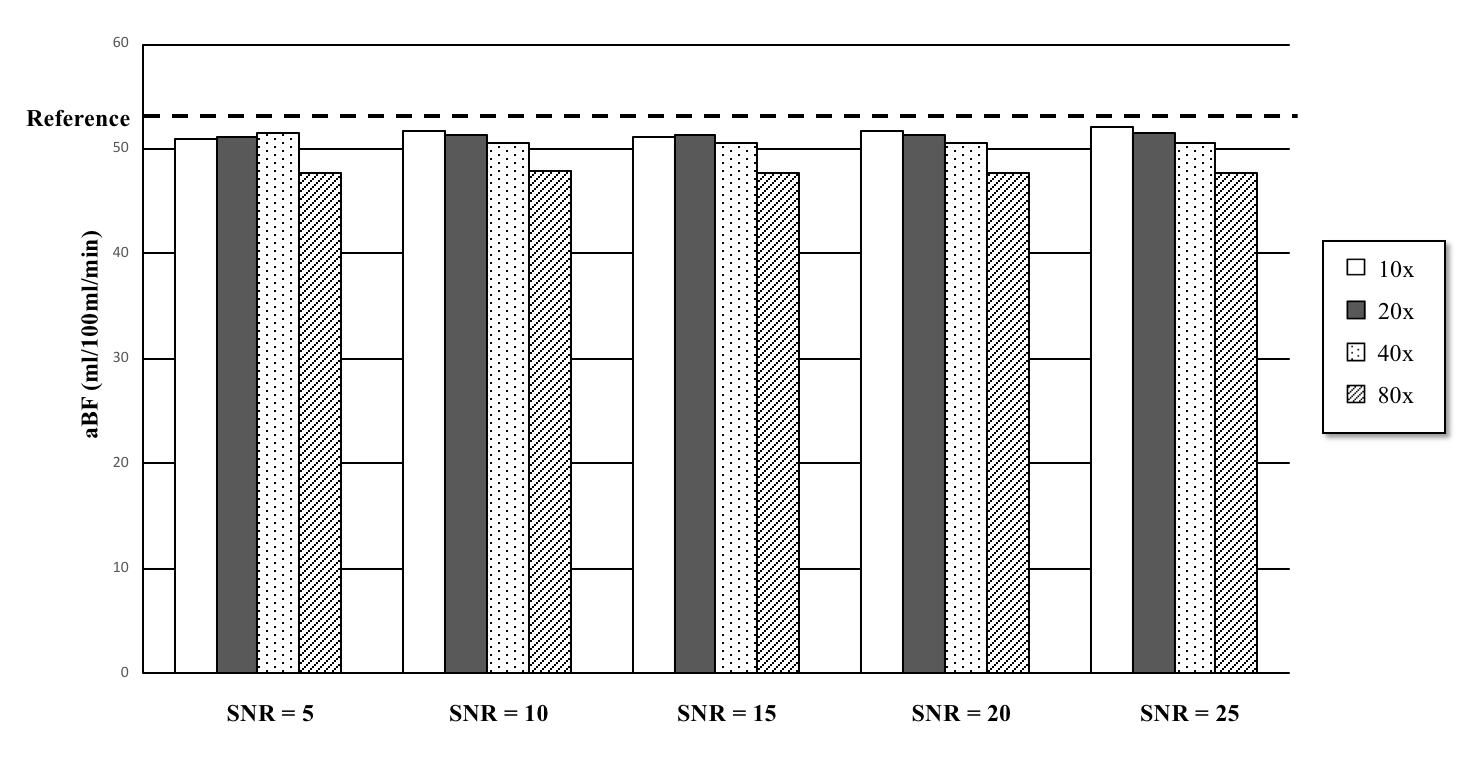
Figure 3 shows simulated average aBF with different under-sampling rates and different noise levels. Underestimated aBF is noticed when the under-sampling rate increases due to the energy spreading out. Nevertheless, the aBF quantification is more tolerant to different noise levels.
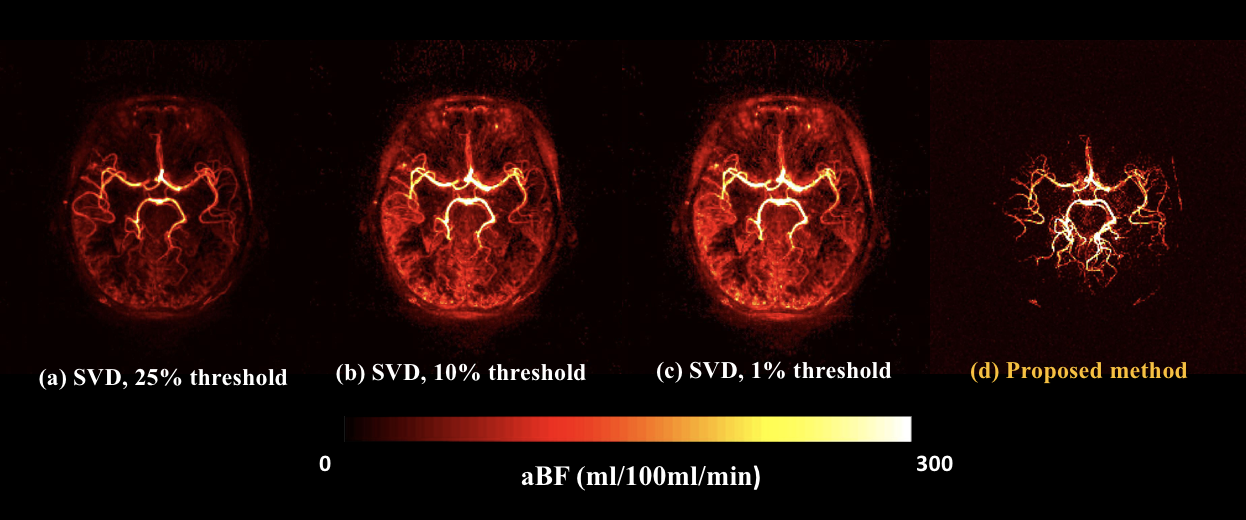
Figure 4 shows aBF maps from two subjects with direct reconstruction compared with the indirect t-SVD method(threshold: 1%, 10%, 25%). Significant intensity variation of aBF with different thresholds was observed in SVD results. However, the evaluation from proposed method is more reliable and robust, overcoming the uncertainty and noise introduced by the indirect method.
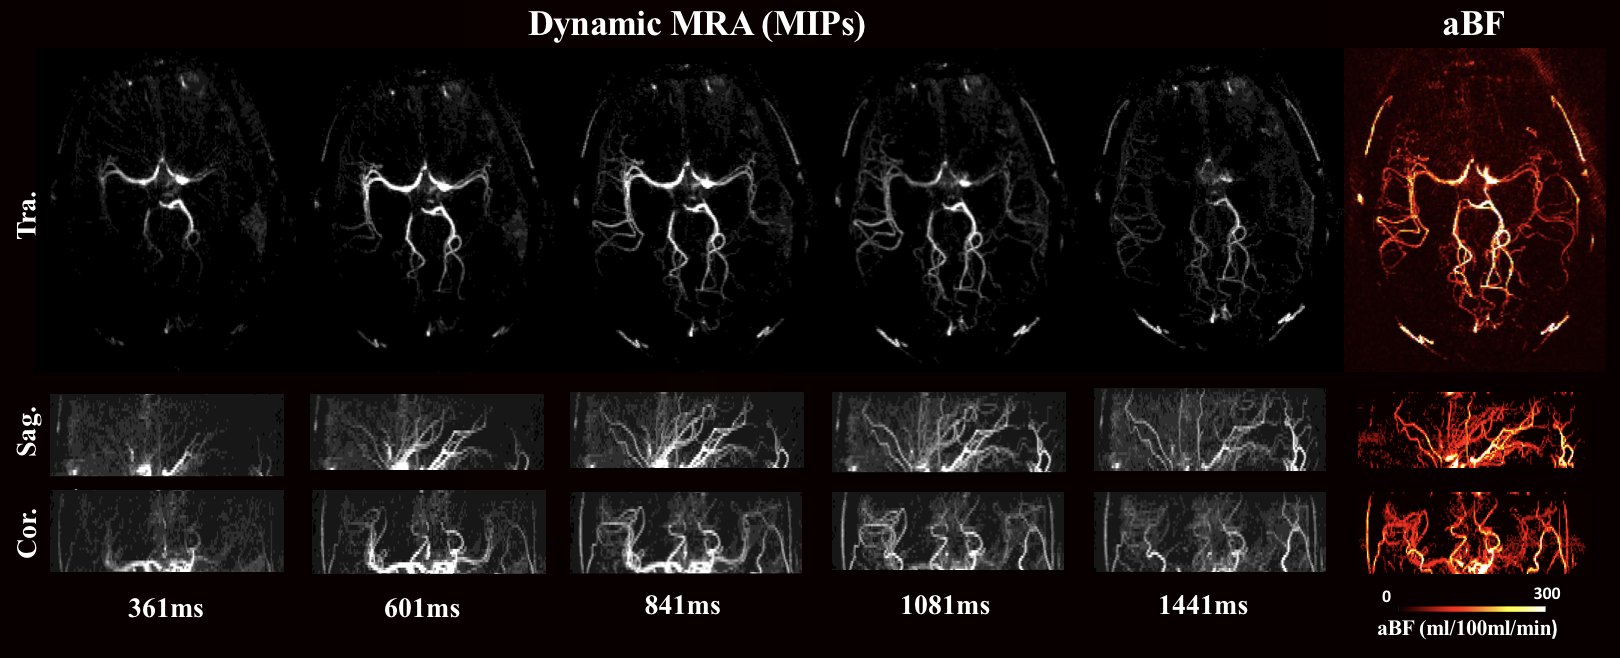
Figure 5 displays the reconstructed aBF maps from another subject along three orthogonal directions. One can appreciate a good vessel delineation with quantitative flow information.
Conclusion
We proposed a direct reconstruction of arterial blood flow from NCE-dMRA with radial sampling. It shows the robustness to different level of noise and the tolerance for different under-sampling rates. Compared to the post-processing method, the direct reconstruction method allows reliable aBF values while preserving good delineation of vessel structures.Acknowledgements
This work is supported by grants of AHA16SDG29630013 and NIH K25AG056594.References
[1]. Song HK, Yan L, Smith RX, et al. Noncontrast enhanced four‐dimensional dynamic MRA with golden angle radial acquisition and k‐space weighted image contrast (KWIC) reconstruction. Magn Reson Med. 2014; 72(6): 1541-1551.
[2]. Zhou Z, Han F, Yu S, et al. Accelerated noncontrast‐enhanced 4‐dimensional intracranial MR angiography using golden‐angle stack‐of‐stars trajectory and compressed sensing with magnitude subtraction. Magn Reson Med. 2018; 79(2): 867-878.
[3]. Buxton RB, Frank LR, Wong EC, et al. A general kinetic model for quantitative perfusion imaging with arterial spin labeling. Magn Reson Med 2005; 40(3): 383-396.
[4]. Petersen ET, Lim T, Golay X. Model‐free arterial spin labeling quantification approach for perfusion MRI. Magn Reson Med 2005; 55(2): 219-232.
[5]. Calamante F, Gadian DG, Connelly A. Delay and dispersion effects in dynamic susceptibility contrast MRI: simulations using singular value decomposition. Magn Reson Med 2000; 44(3): 466-473.
Figures