2719
Quantitative Analysis of Punctate White Matter Lesions Using Quantitative Susceptibility Mapping and R2* Relaxation1Children’s Hospital of Chongqing Medical University, Chongqing, China, 2UBC MRI Research Centre, University of British Columbia, Vancouver, BC, Canada
Synopsis
Objectives: Our aim was to distinguish PWMLs and focal hemorrhage lesions using quantitative measures. Materials and Methods: In the current study, we acquired multi-echo gradient echo MRI data in neonates with hypoxic ischemic encephalopathy, and post-processed them as R2* relaxation maps and quantitative susceptibility maps (QSM). Manually drawing regions of interest (ROIs) on R2* maps, we measured R2* and susceptibility values of the lesions. Results: We found that R2* and susceptibility values are significantly increased in focal hemorrhage lesions, compared to PWMLs. Conclusions: R2* and QSM can be used to help clinicians distinguish and measure these lesions.
Introduction
Non-cystic punctate white matter lesions (PWMLs) are detected by MRI in one-third of preterm neonates, and are not accurately detected by ultrasound. 1-5 Histological and MRI studies suggest that PWMLs have intense macrophage and microglial infiltration and reduced astroglia, which coincide with microscopic necrosis and early gliosis. 6,7 Whether these multi-focal PWMLs in neonatal brain injuries are associated with neuro-developmental outcomes is still a matter of debate. 8-11
Previous MRI studies were based on T1 weighted images, and evaluated PWMLs by the features like the number, diameter and location of lesions, but the signal intensity of these lesions were underestimated, which we speculate may underestimate the degree of injury of the lesions. 9-11 On the other hand, it is difficult to distinguish PWMLs from focal hemorrhage on conventional MRI, since both kinds of lesions show increased signal intensity on T1 weighted images, and frequently decreased signal on T2 weighted images. Accurate predictive tools are essential to clinicians to identify and quantify brain injury, and take early intervention to improve clinical outcomes of these neonates.
R2* relaxometry is a semi-quantitative magnetic resonance technique which is influenced by iron and myelin content across different brain regions 12, QSM is a relatively new technique, derived from the same scan as R2*, which quantifies magnetic susceptibility using the phase data from the same gradient echo (GRE) scans. 13 In the current paper, we acquired multi-echo GRE scans in preterm and term neonates to investigate PWML injuries with R2* and QSM maps. We hypothesized that these GRE based MRI maps would allow us to distinguish PWMLs from hemorrhage lesions with higher precision than conventional MRI scans.
Methods
In the current study, we acquired multi-echo gradient echo MRI data in neonates with hypoxic ischemic encephalopathy, and post-processed them as R2* relaxation maps and quantitative susceptibility maps (QSM). R2* maps were calculated from the multi gradient-echo scans by fitting a mono-exponential function to the magnitude signal decay in each voxel. QSM images of all five echoes were post-processed from the phase data. Phase unwrapping was achieved using a 3D Laplacian algorithm 14, while the background field was removed using the varial SHARP method. 15 Lastly, a Gaussian filter (σ = 0.5) was applied to the normalized field maps in order to smooth out high frequency errors originating from the reconstruction steps before the inversion. A two-step dipole inversion algorithm 16 was used to solve the dipole inversion problem. Finally, QSM images were then averaged across echoes three, four and five.
Regions of interest (ROIs) encompassing PWMLs and focal hemorrhage lesions were defined manually on R2* maps. Three ROIs of each subject were defined within the corpus callosum as normal white matter. For each ROI, the R2* and susceptibility values were measured.
Results
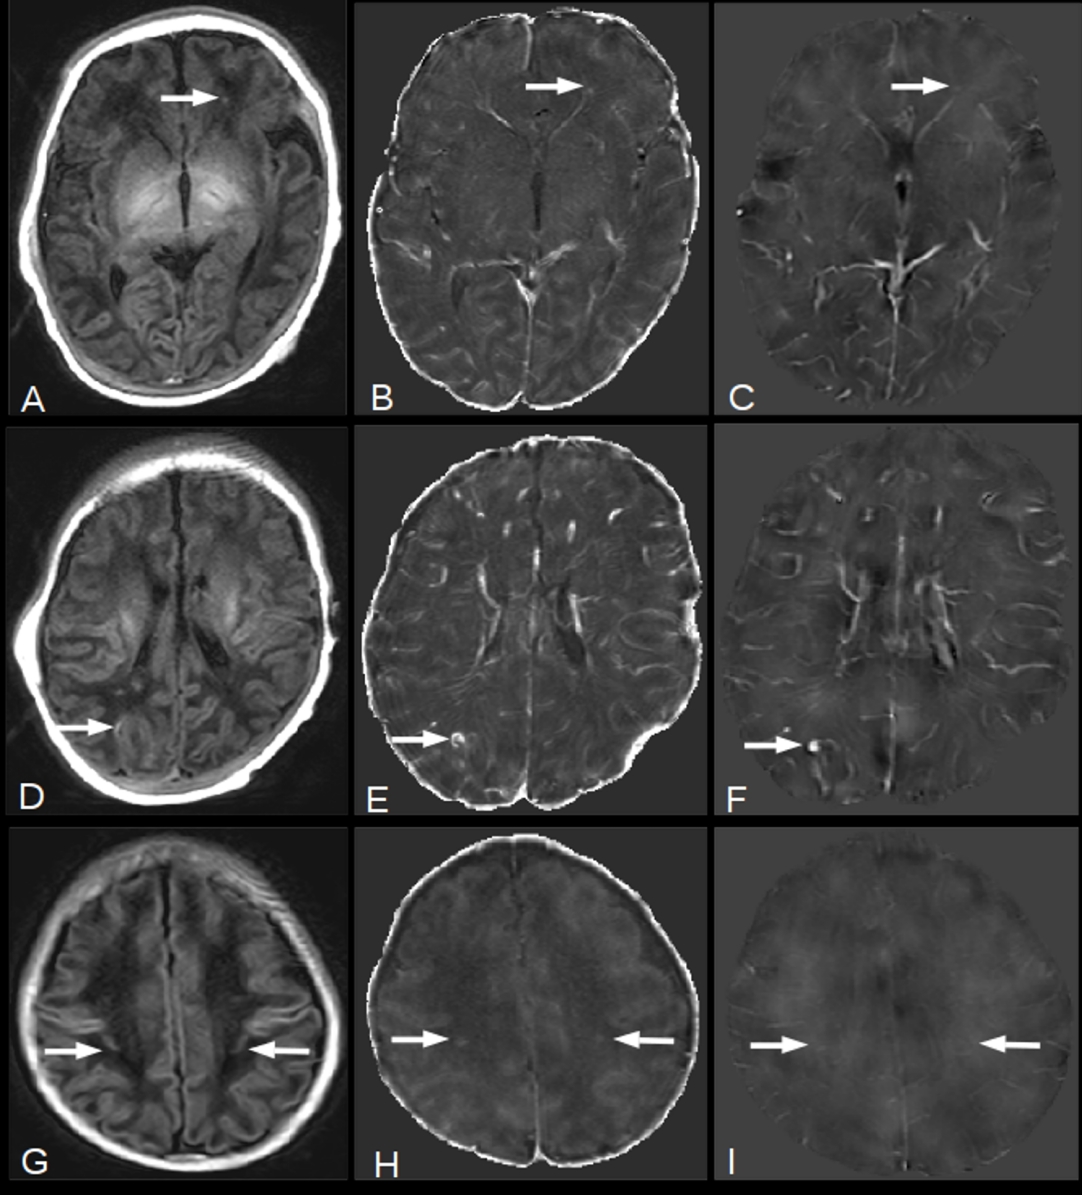
24 newborn infants with a median gestational age at birth of 39 weeks (interquartile range, 33.25 week to 40 week) were initially examined. Six subjects were found to have multi-focal PWMLs and focal hemorrhage lesions on R2* map and QSM, with one patient with large MRI artifacts being excluded. This resulted in a total of five subjects being used (n=5). In all, 18 PWMLs, 8 focal hemorrhage lesions and 15 normal white matter ROIs (3 ROIs within corpus callosum of each subject) were identified in these five subjects (Fig 1).
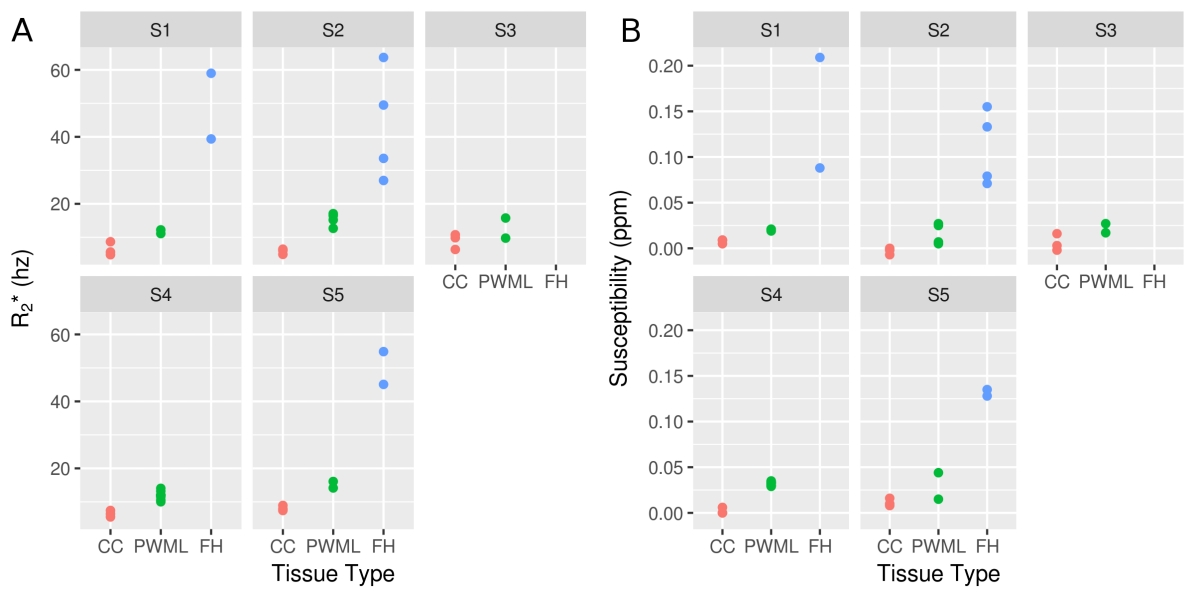
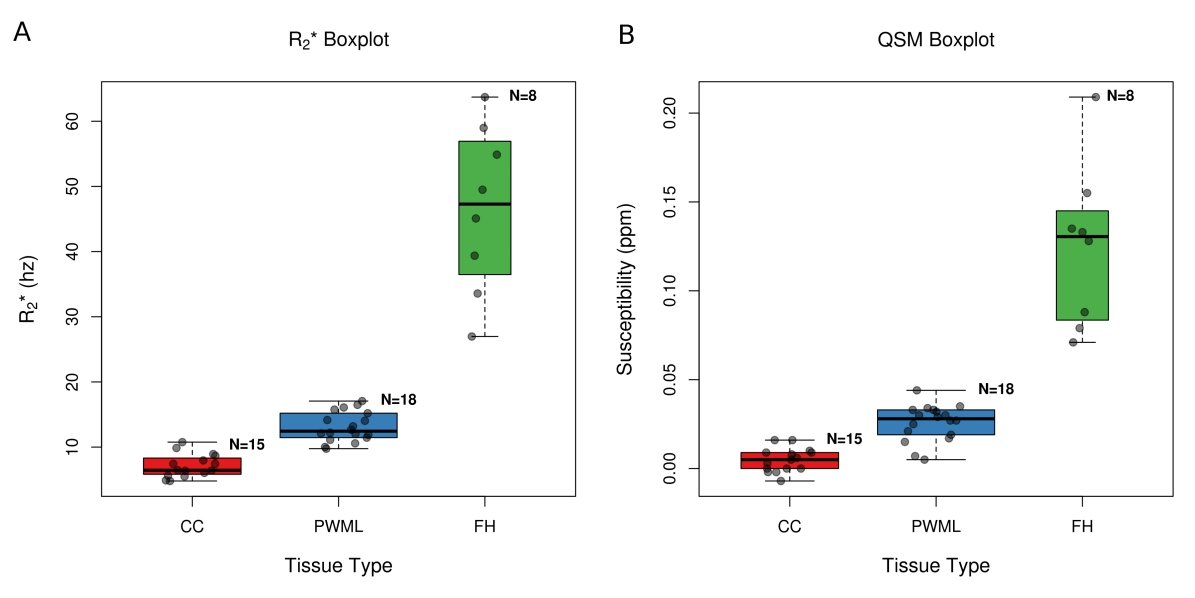
The R2* and susceptibility values for the three tissue types for each subject are shown in Fig 2. R2* and susceptibility boxplots are shown in Fig 3. The average and standard deviation of R2* values of the ROIs within corpus callosum, PWMLs and focal hemorrhage lesions are 7.14±1.80, 13.10±2.27, 46.51±12.72 hz respectively. The average and standard deviation of susceptibility values of the ROIs within corpus callosum, PWMLs and focal hemorrhage lesions are 0.005±0.007, 0.026±0.010, 0.125±0.046 ppm respectively. The R2* and susceptibility values were found to be significantly different (p<0.05), with a large Hedge's g, between each group.
Discussion
Paramagnetic hemorrhage products can significantly increase lesion relaxation rates and magnetic susceptibility. 17-20 In our study, we have shown that R2* values of focal hemorrhage lesions were significantly increased compared to PWMLs. In a previous study, some PWMLs of preterm neonates were absent or decreased near term-equivalent age, whereas some were worse on the follow-up MRI. 21 Thus, changes in R2* may provide a biomarker of disease progression.Conclusion
R2* relaxometry and QSM can be used to distinguish PWMLs from focal hemorrhage lesions, and may be used as quantitative predictive tools to evaluate the correlation between PWMLs and neuro-developmental outcomes in future studies.Acknowledgements
No acknowledgement found.References
1. Maalouf EF, Duggan PJ, Counsell SJ, et al. Comparison of findings on cranial ultrasound and magnetic resonance imaging in preterm infants. Pediatrics. 2001;107(4):719-727.
2. Inder TE, Anderson NJ, Spencer C, Wells S, Volpe JJ. White matter injury in the premature infant: a comparison between serial cranial sonographic and MR findings at term. AJNR Am J Neuroradiol. 2003;24(5):805-809.
3. Inder TE, Wells SJ, Mogridge NB, Spencer C, Volpe JJ. Defining the nature of the cerebral abnormalities in the premature infant: a qualitative magnetic resonance imaging study. J Pediatr. 2003;143(2):171-179.
4. Miller SP, Cozzio CC, Goldstein RB, et al. Comparing the diagnosis of white matter injury in premature newborns with serial MR imaging and transfontanel ultrasonography findings. AJNR Am J Neuroradiol. 2003;24(8):1661-1669.
5. Debillon T, N’Guyen S, Muet A, Quere MP, Moussaly F, Roze JC. Limitations of ultrasonography for diagnosing white matter damage in preterm infants. Arch Dis Child Fetal Neonatal Ed. 2003;88(4):F275-279.
6. Schouman-Claeys E, Henry-Feugeas MC, Roset F, et al. Periventricular leukomalacia: correlation between MR imaging and autopsy findings during the first 2 months of life. Radiology. 1993;189(1):59-64.
7. Riddle A, Dean J, Buser JR, et al. Histopathological correlates of magnetic resonance imaging-defined chronic perinatal white matter injury. Ann Neurol. 2011;70(3):493-507.
8. Jeon TY, Kim JH, Yoo S-Y, et al. Neurodevelopmental outcomes in preterm infants: comparison of infants with and without diffuse excessive high signal intensity on MR images at near-term-equivalent age. Radiology. 2012;263(2):518-526.
9. Miller SP, Ferriero DM, Leonard C, et al. Early brain injury in premature newborns detected with magnetic resonance imaging is associated with adverse early neurodevelopmental outcome. J Pediatr. 2005;147(5):609-616.
10. Dyet LE, Kennea N, Counsell SJ, et al. Natural history of brain lesions in extremely preterm infants studied with serial magnetic resonance imaging from birth and neurodevelopmental assessment. Pediatrics. 2006;118(2):536-548.
11. Cornette LG, Tanner SF, Ramenghi LA, et al. Magnetic resonance imaging of the infant brain: anatomical characteristics and clinical significance of punctate lesions. Arch Dis Child Fetal Neonatal Ed. 2002;86(3):F171-177.
12. Yablonskiy DA, Haacke EM. Theory of NMR signal behavior in magnetically inhomogeneous tissues: the static dephasing regime. Magn Reson Med. 1994;32(6):749-763.
13. Deistung A, Schweser F, Reichenbach JR. Overview of quantitative susceptibility mapping. NMR Biomed. 2017;30(4).
14. Schofield MA, Zhu Y. Fast phase unwrapping algorithm for interferometric applications. Opt Lett. 2003;28(14):1194-1196.
15. Li W, Wu B, Liu C. Quantitative susceptibility mapping of human brain reflects spatial variation in tissue composition. Neuroimage. 2011;55(4):1645-1656.
16. Kames C, Wiggermann V, Rauscher A. Rapid two-step dipole inversion for susceptibility mapping with sparsity priors. Neuroimage. 2018;167:276-283.
17. Nandigam RNK, Viswanathan A, Delgado P, et al. MR imaging detection of cerebral microbleeds: effect of susceptibility-weighted imaging, section thickness, and field strength. AJNR Am J Neuroradiol. 2009;30(2):338-343.
18. Niwa T, de Vries LS, Benders MJNL, Takahara T, Nikkels PGJ, Groenendaal F. Punctate white matter lesions in infants: new insights using susceptibility-weighted imaging. Neuroradiology. 2011;53(9):669-679.
19. Haacke EM, Liu S, Buch S, Zheng W, Wu D, Ye Y. Quantitative susceptibility mapping: current status and future directions. Magn Reson Imaging. 2015;33(1):1-25.
20. Fazekas F, Kleinert R, Roob G, et al. Histopathologic analysis of foci of signal loss on gradient-echo T2*-weighted MR images in patients with spontaneous intracerebral hemorrhage: evidence of microangiopathy-related microbleeds. AJNR Am J Neuroradiol. 1999;20(4):637-642.
21. Gano D, Andersen SK, Partridge JC, et al. Diminished white
matter injury over time in a cohort of premature newborns. J
Pediatr. 2015;166(1):39-43.
Figures