2717
Exploiting MPRAGE phase to improve Globus Pallidus segmentation1Biomedical Engineering, University of Alberta, Edmonton, AB, Canada
Synopsis
A Quantitative Susceptibility Map can be generated from MPRAGE phase and used to improve Globus Pallidus segmentation. This proposal does not require an additional GRE scan and thus saves time and minimizes possible motion and intermodal registration/interpolation related errors.
INTRODUCTION
Three-dimensional Magnetization-Prepared Rapid Gradient-Echo (MPRAGE) is a T1-based imaging method that is widely used for brain segmentation and volume measurement1. With MPRAGE, the contrast distinction between Grey Matter (GM), White Matter (WM) and CSF makes segmentation relatively straightforward. However, certain areas of the Deep GM (DGM) have similar T1 contrast to neighboring WM, which can make accurate segmentation difficult or at times impossible based on only MPRAGE2. A particularly problematic region is the Globus Pallidus (GP), which is a critical structure in the basal ganglia. GP distinction with MPRAGE becomes increasingly difficult as field strength increases. Even at 3T, the boundary between GP and neighboring WM may vanish. Recent studies demonstrated that the segmentation of GP can be improved by utilizing its high contrast in Quantitative Susceptibility Mapping (QSM)3,4. However, this approach requires an additional multi-echo Gradient-Echo (mGRE) scan. In this study, we propose exploiting MPRAGE phase to generate an inherent QSM, which avoids the need for additional acquisitions. Then, we assess the feasibility of improving GP segmentation using this inherent QSM.METHODS
1- Data Acquisition: Two imaging sequences were acquired from a group of 20 healthy subjects using a 3T Siemens scanner with a 64-channel head coil: sagittal MPRAGE (288x288x208 matrix-size, 0.87x0.87x0.85mm3 resolution, 3.65 min acquisition time, 8° FA, 2.37ms/7.2ms TE/TS, 900ms/1800ms TI/TR, 200Hz/pixel BW, and 3 GRAPPA factor) and axial mGRE (216x256x88 matrix-size, 0.94x0.94x1.70mm3 resolution, 5.53 min acquisition time, 13° FA, 3.82ms/37ms TE1/TR, 260Hz/pixel BW, 2 GRAPPA factor, monopolar readouts, 6 echoes spaced by 5.49ms).
2- QSM Reconstruction: Phase images of both imaging sequences were unwrapped using PRELUDE in the FSL package5. Local field maps were obtained using RESHARP6, and then inverted into QSM using Total-Variation Dipole Inversion7.
3- Registration and Segmentation: Following Feng’s procedure4, mGRE data are affine registered to MPRAGE using ANTS tool8. Hybrid contrast (HC) magnitudes with enhanced GP contrast are then produced by a weighted sum of MPRAGE magnitude ($$$T1_w$$$) and QSM maps, as follows: $$HC_{mp} =w_{11}*T1_w+w_{12}*QSM_{mp}(1)$$
$$HC_{gre} =w_{21}*T1_w+w_{22}*QSM_{gre}(2)$$
Subscripts $$$mp$$$ and $$$gre$$$ refer to MPRAGE and GRE respectively. The weights $$$w_{ij}$$$ are determined as previously described4. $$$T1_w$$$, $$$HC_{mp}$$$, and $$$HC_{gre}$$$ are then registered to the FSL template using nonlinear SyN registration of ANTS tool. Finally, GP is segmented using FSL FIRST tool.
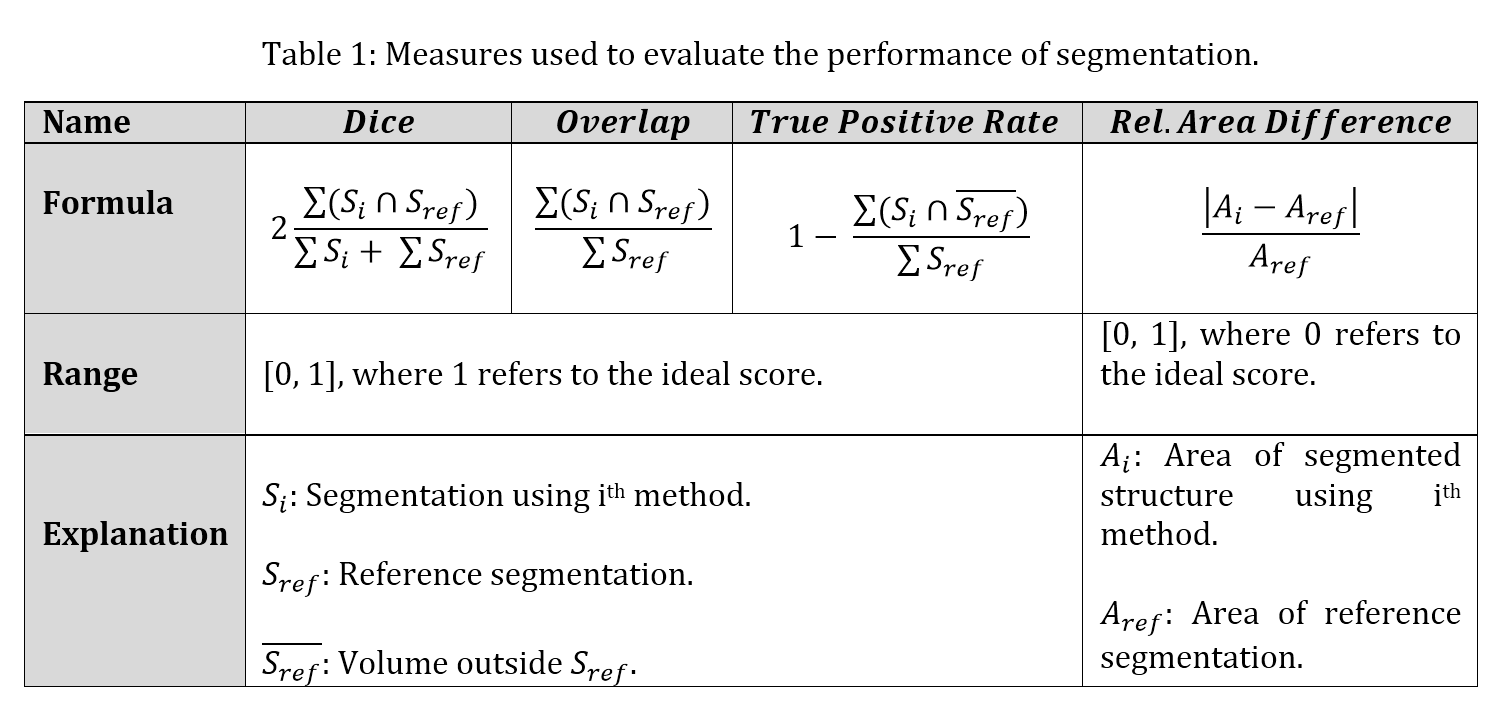
4- Performance Analysis: Table 1 lists the four measures that were used to evaluate the segmentation quality, namely: Dice coefficient, Volume Overlap, True-Positive-Rate, and the Relative-Area-Difference. In these measures, the FSL output with $$$HC_{gre}$$$ input is used as the reference. Additionally, the significance of the improvement in each of the above-mentioned measures was evaluated using paired t-test.
RESULTS
Fig.1a demonstrates the weak contrast of GP in MPRAGE at 3T, which is not the case in QSM (Fig.1b). Although the quality of the inherent QSM from MPRAGE (Fig.1d) is reduced from standard QSM, the highly iron-concentrated GP is adequately delineated, and thus its QSM contrast can be used to enhance GP contrast on MPRAGE magnitude (Fig.1c). Fig.2 illustrates the qualitative improvement in segmenting GP when $$$HC_{mp}$$$ is employed. Fig.3 provides quantitative results that indicate significant gain in performance (p<0.0015).
DISCUSSION
This study showed the feasibility of improving GP segmentation using QSM produced directly from MPRAGE phase, without requiring a separate QSM sequence. As such, it may be applied to any MPRAGE data set, provided MPRAGE phase images are saved. As well as no additional acquisition cost, this method eliminates the need for inter-modal registration between two separate scans (MPRAGE and mGRE) and avoids its associated errors. Furthermore, the spatial resolution of mGRE-based QSM is typically limited by time and therefore usually interpolation is needed to match the MPRAGE resolution. However, the inherent QSM from MPRAGE has the same resolution and thus avoids possible interpolation errors.
Inherent QSM from MPRAGE appears as a low-pass-filtered version of the conventional mGRE QSM, losing many details except those structures with high susceptibility. This is mainly due to the short TE (2.37ms) used in collecting MPRAGE, which is not sufficient to accumulate adequate phase difference in structures of low susceptibility. However, QSM from MPRAGE still can be useful for applications that involve extremely iron-rich structures like GP, as demonstrated here. Furthermore, GP is known to be extremely poorly segmented using only standard MPRAGE magnitude. This study used a 0.64 mm3 MPRAGE protocol that also utilized 3-fold parallel imaging leading to poor SNR in DGM regions. Further optimization is possible with influencing factors like echo-time and SNR, which are now under investigation.
CONCLUSION
Globus Pallidus segmentation can be substantially improved using inherent QSM from MPRAGE phase, requiring no additional acquisitions.Acknowledgements
Funding from Canadian Institutes of Health Research is acknowledged.References
1. Deichmann R, Good CD, Josephs O, et al. Optimization of 3-D MP-RAGE sequences for structural brain imaging. Neuroimage, 2000;12(1):112-127.
2. Derakhshan M, Caramanos Z, Giacomini PS, et al. Evaluation of automated techniques for the quantification of grey matter atrophy in patients with multiple sclerosis. Neuroimage, 2010;52(4):1261-1267.
3. Cobzas D, Sun H, Walsh AJ, et al. Subcortical gray matter segmentation and voxel‐based analysis using transverse relaxation and quantitative susceptibility mapping with application to multiple sclerosis. Journal of Magnetic Resonance Imaging, 2015;42(6):1601-1610.
4. Feng X, Deistung A, Dwyer MG, et al. An improved FSL-FIRST pipeline for subcortical gray matter segmentation to study abnormal brain anatomy using quantitative susceptibility mapping (QSM). Magnetic resonance imaging, 2017;39: 110-122.
5. Jenkinson, M. Fast, automated, N‐dimensional phase‐unwrapping algorithm. Magnetic Resonance in Medicine, 2003;49(1):193-197.
6. Sun H, Wilman AH. Background field removal using spherical mean value filtering and Tikhonov regularization. Magnetic resonance in medicine, 2014;71(3):1151-1157.
7. Bilgic B, Pfefferbaum A, Rohlfing T, et al. MRI estimates of brain iron concentration in normal aging using quantitative susceptibility mapping. Neuroimage, 2012;59(3):2625-2635.
8. Avants BB, Tustison NJ, Song G, et al. A reproducible evaluation of ANTs similarity metric performance in brain image registration. Neuroimage, 2011;54(3):2033-2044.
Figures
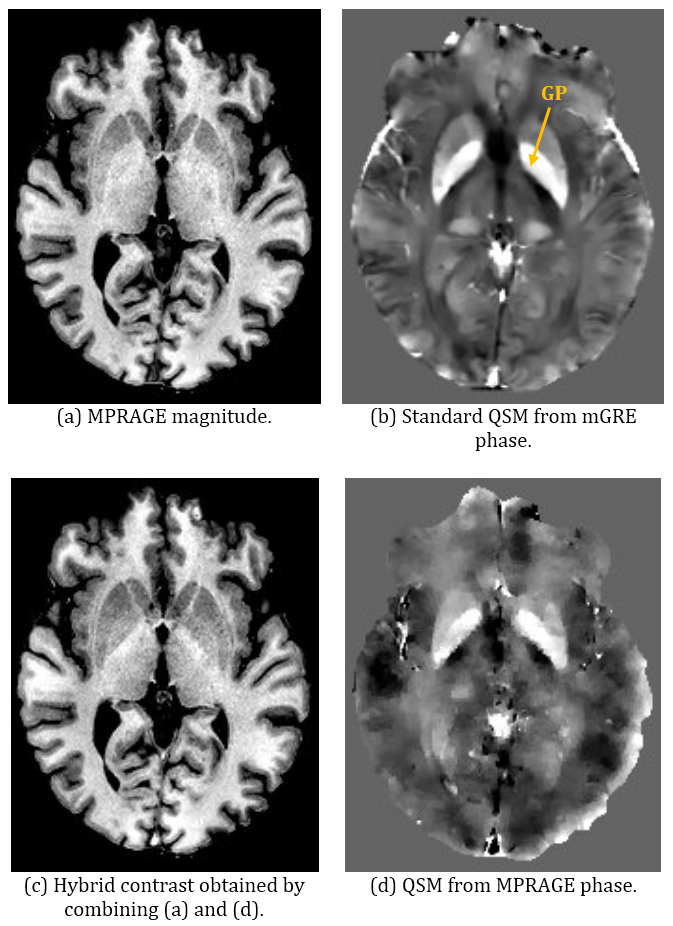
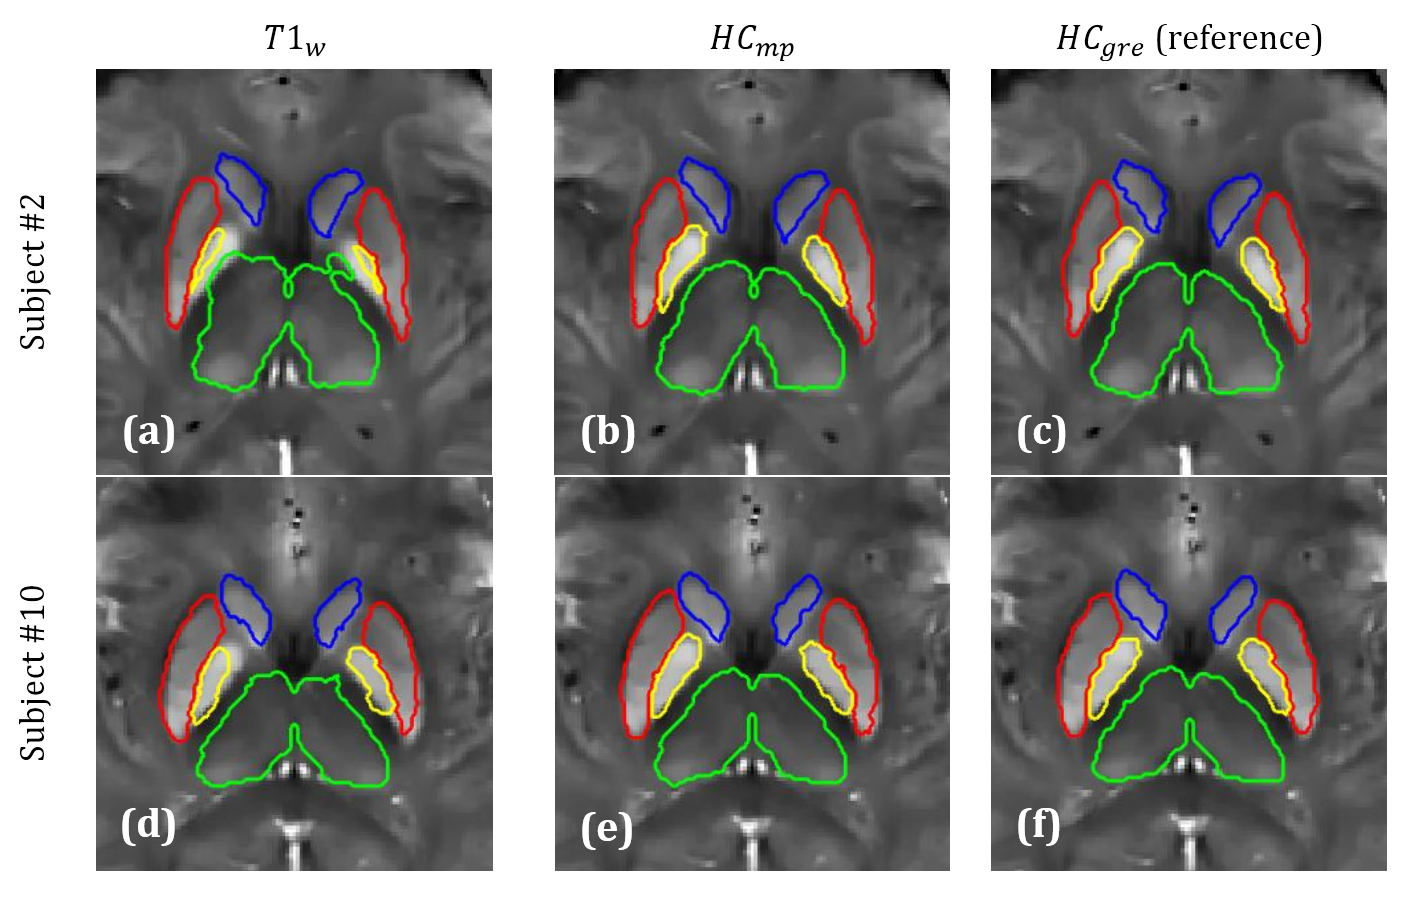
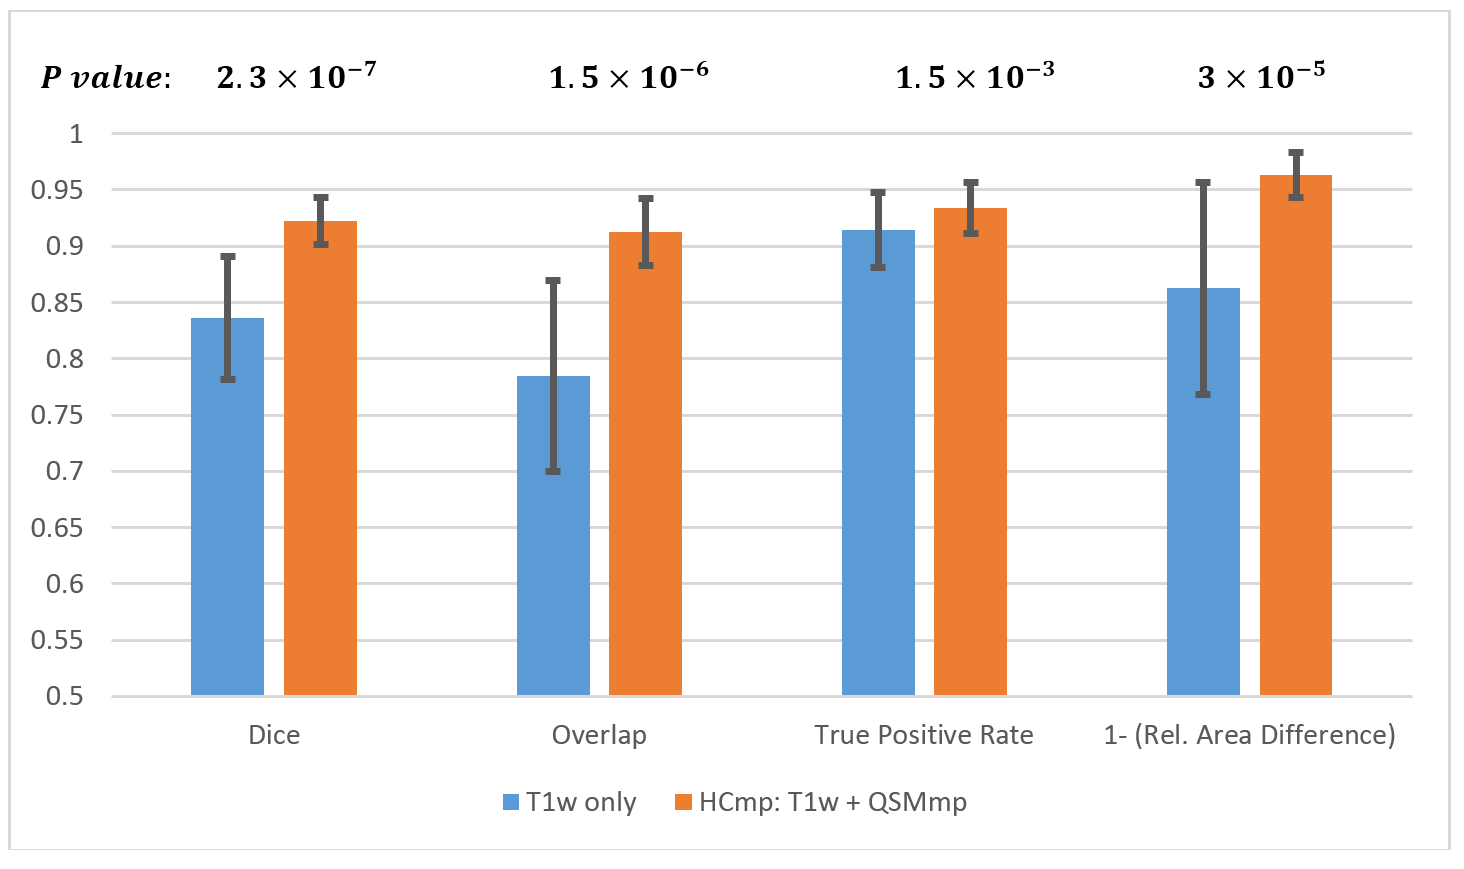
Figure 3: Performance assessment using all subjects: Segmentation of GP using $$$HC_{mp}$$$ significantly outperforms $$$T1_w$$$ on all measures, with significant p values listed above. In addition, deviation from the reference segmentation is less pronounced when $$$HC_{mp}$$$ is used. Relative Area Difference measure is given in complementary form (i.e., $$$1-x$$$ ) so that ideal scores are 1.0 for all measures.