2711
Towards Validating Structural Connectivity in the Human Language System: an Intraoperative Cortico-Cortical Stimulation Experiment1INRIA Sophia Antipolis-Méditerranée, Université Côte d'Azur, Valbonne, France, 2Centre Hospitalier Universitaire de Nice, Université Côte d'Azur, Nice, France, 3Sherbrooke Connectivity Imaging Lab (SCIL), University of Sherbrooke, Sherbrooke, QC, Canada, 4INRIA, CEA, Université Paris-Saclay, Paris, France
Synopsis
We validate
structural connectivity measures based on diffusion MRI with Electrical Stimulation (ES) of the human brain
cortex. For this, we combine white matter fiber tractography with
propagation of Cortico-Cortical Evoked Potentials (CCEPs) induced by
intrasurgical ES in the language system of brain tumor patients. Our
results show high correlation (Pearson's coefficient 0.5-0.9) between
delays of CCEPs and pathways connecting stimulation sites with
recording electrodes. Our approach outperforms
earlier study based on Diffusion Tensor Imaging. This potentially indicates that probabilistic tractography is an effective
tool to quantify cortico-cortical communication non-invasively.
Introduction
We validate structural connectivity measures based on diffusion Magnetic Resonance Imaging (dMRI) with Electrical Stimulation (ES) of the human brain cortex. For this, we combine probabilistic tractography with propagation of Cortico-Cortical Evoked Potentials (CCEPs) induced by intrasurgical ES in the language system of brain tumor patients. Our results show high correlation (Pearson's coefficient 0.5-0.9) between delays of CCEPs and pathways connecting stimulation sites with recording electrodes. Despite the use of low-current 2.0-3.5mA ES and a small-sized stimulating electrode, our findings are in accordance with the studies performed in different schemes1-4, where higher current intensities and larger electrodes ensured better signal-to-noise ratio.
Methods
We acquired pre-surgical multishell dMRI ($$$b\in\{400, 800, 1550, 3100\}[\mbox{s/mm}^2]$$$ with $$$\{6, 13, 29, 51\}$$$ directions, respectively), from which we obtained probabilistic tractography. We dissected Arcuate Fasciculus (AF) and Superior Longitudinal Fasciculus III (SLF3) with MI-Brain5 to plan the positioning of recording
electrocorticographic (ECoG) electrodes. Next, following the awake craniotomy procedure, a neurosurgeon performed brain cartography with high-frequency 50Hz ES
to identify functional
cortical sites related to AF and SLF3. Then, we placed the ECoG electrodes on the cortical terminations of those tracts determined with structural information from the dMRI-based tractography and functional information from the ES-based cartography, as illustrated in Figure 1.
In this work, we consider two patients with written consent to participate in our study: 46-year old male (Patient #1) and 25-year old female (Patient #2). For both of them, we performed the ECoG recording under general anesthesia, right after the tumor resection. We used biphasic, bipolar 3.5mA ES with the frequency 5Hz for Patient #1 and 2.0mA ES with the frequency 2Hz for Patient #2. We recorded the signal referenced to the average of all the electrodes, using the sampling frequency 2kHz. The stimulation sites were located in the proximity of the reachable recording electrodes as illustrated in Figures 1 and 2. Each stimulation was repeated about 20 times.
In the post-processing, we averaged the ECoG signal of each ES trial in order to decrease the noise. Next, we computed the delays of the observed CCEPs and correlated them with the probability that a white matter bundle connects the stimulation and electrode sites. For that, we considered seeds located in the points of interest identified with the clinical neuronavigation system, surrounded by spheres of the 5mm in diameter to account for a brain shift.
Results
Typically, an evoked potential consists of three consecutive voltage peaks named N1, P1, and N26. In most of our ECoG signals, we could identify the downward P1 peak propagating from the stimulation site, as illustrated in Figure 2.
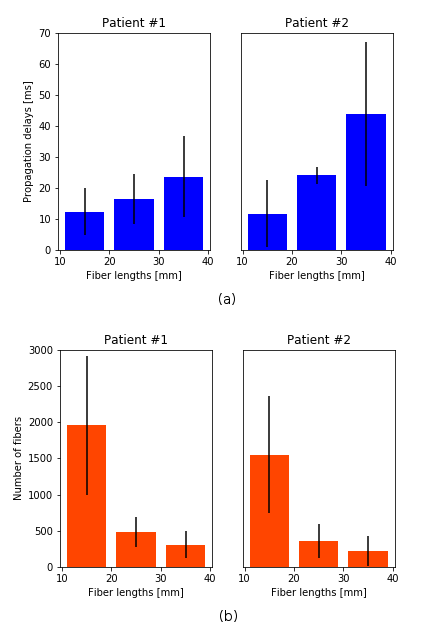
Figure 3a illustrates the means and standard deviations of delays of the P1 peaks aggregated by the lengths of the shortest fibers connecting a given stimulation-recording pair. The results for Patient #1 are less dispersed, reaching $$$23.6\pm13.0$$$ms delay on the fibers between 30- and 40-millimeter long, while for the Patient #2 we observed $$$43.7\pm23.2$$$ms delay for the same distance length. Figure 3b summarizes the number of fibers linking the examined pairs of points aggregated by the lengths. As expected, the majority of fibers connect neighboring sites located 10-20mm away from each other.
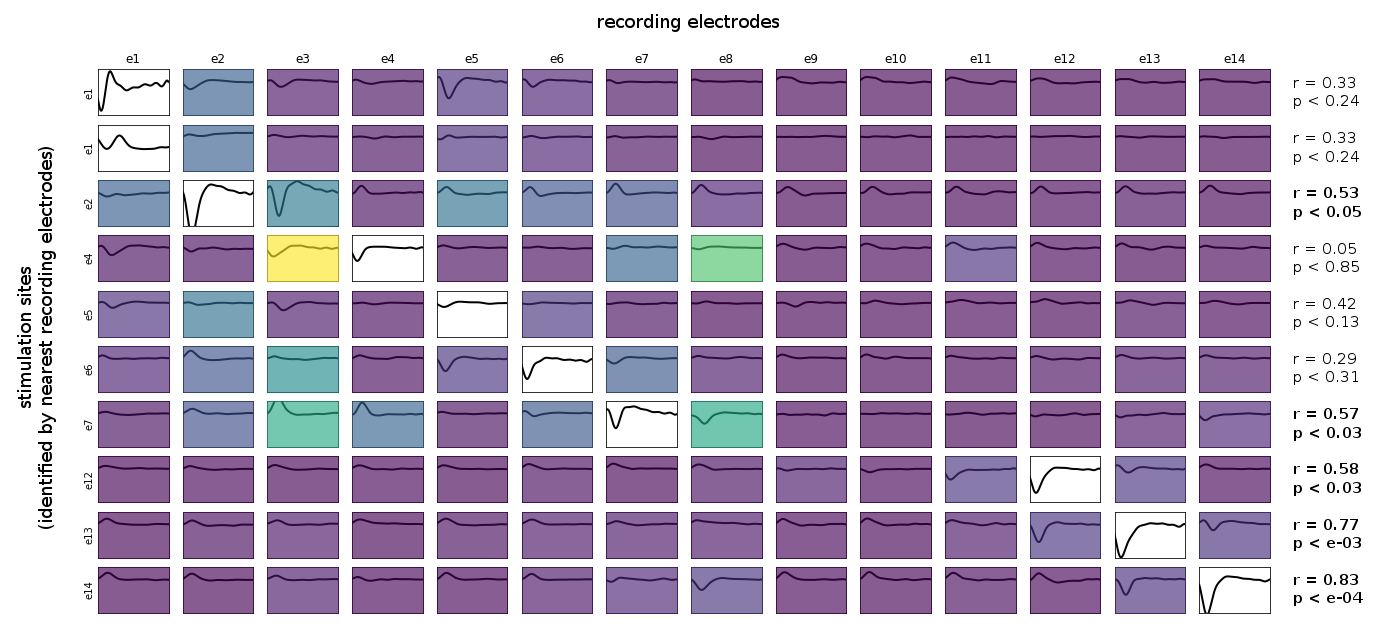
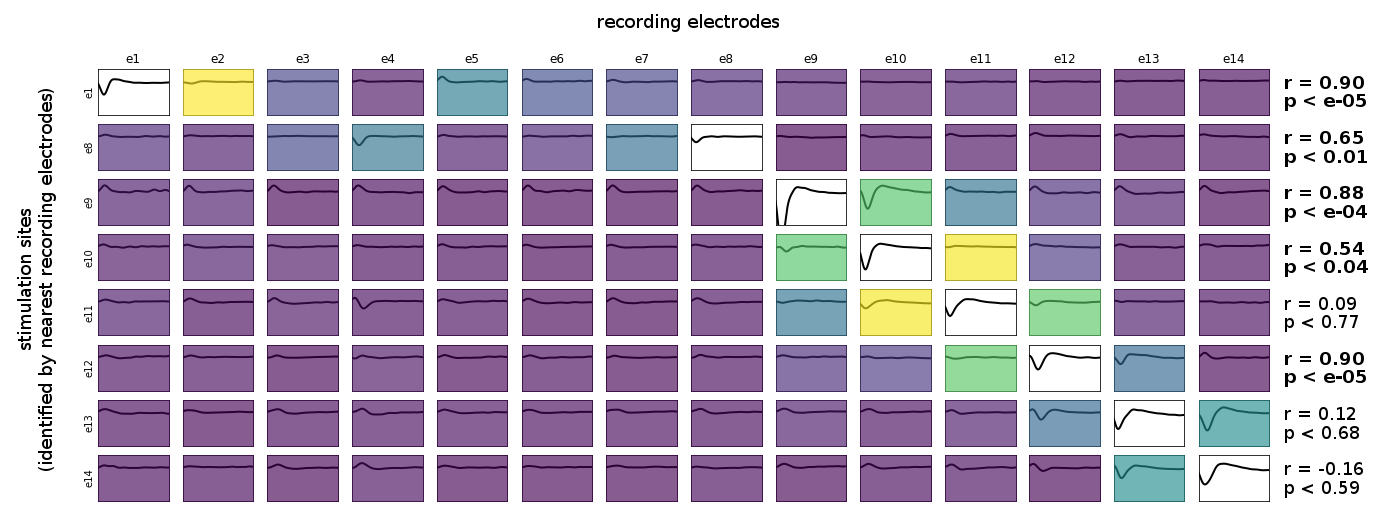
Figures 4 and 5 illustrate the correlation that we observed between delays of P1 and numbers of pathways connecting stimulation sites with recording electrodes. In most of the cases the Pearson's correlation coefficient laid between 0.5 and 0.9.
Discussion
Elucidating the relationship between structure and function of the brain is one of the main open questions in neuroscience7. In this work, we address an open question, whether tractography provides an index of cortico-cortical communication. We asses the relationship between structural connectivity, measured through probabilistic tractography, and cortico-cortical communication as measured by injected ES. Despite being criticized, the correspondance between probabilistic tractography and the probability of an axonal connection has been accumulating positive evidence (e.g. in animal models8). In our case, the observed high correlation provides initial evidence that our tested hypothesis is correct. Our results outperform the previous streamline tractography study2, where the Pearson's correlation coefficient 0.4 was reported for the pathways obtained from Diffusion Tensor Imaging. This potentially indicates that probabilistic tractography is an effective tool to quantify cortico-cortical communication non-invasively.
Conclusion
Our study validates the structural connectivity measures based on white matter tractography with the propagation of CCEPs. We believe that combining those two modalities will help understand the organization of cognitive functions and support neurosurgical planning.
Acknowledgements
This work has received funding from the ANR/NSF award NeuroRef; the MAXIMS grant funded by ICM's The Big Brain Theory Program and ANR-10-IAIHU-06.
References
1. Matsumoto, R., et al. "Functional connectivity in the human language system: A cortico-cortical evoked potential study." Brain 127.10 (2004): 2316-2330.
2. Conner, C.R., et al. "Anatomic and electro-physiologic connectivity of the language system: a combined DTI-CCEP study." Computers in Biology and Medicine 41.12 (2011): 1100-1109.
3. Keller, C.J., et al. "Mapping human brain networks with cortico-cortical evoked potentials." Phil. Trans. R. Soc. B 369.1653 (2014): 20130528.
4. Yamao, Y., et al. "Intraoperative dorsal language network mapping by using single‐pulse electrical stimulation." Human Brain Mapping 35.9 (2014): 4345-4361.
5. https://www.imeka.ca/mi-brain/
6. Vincent, M., et al. "Electrophysiological brain mapping: Basics of recording evoked potentials induced by electrical stimulation and its physiological spreading in the human brain." Clinical Neurophysiology 128.10 (2017): 1886-1890.
7. Jbabdi, S., et al. "Measuring macroscopic brain connections in vivo." Nature neuroscience 18.11 (2015): 1546.
8. Donahue, C.J., et al. "Using diffusion tractography to predict
cortical connection strength and distance: a quantitative comparison
with tracers in the monkey." Journal of Neuroscience 36.25 (2016): 6758-6770.
Figures
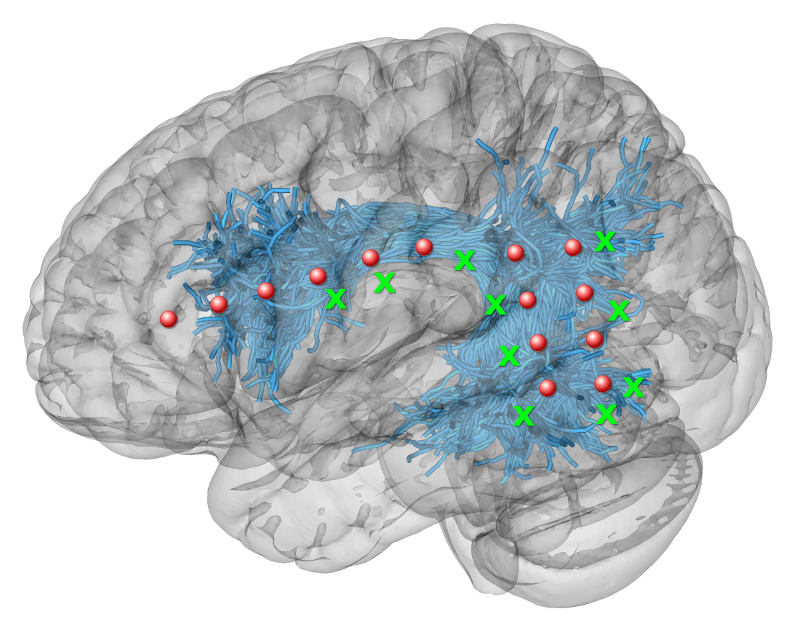
Figure 1. Tractography-based Arcuate Fasciculus and Superior Longitudinal Fasciculus III (marked as blue streamlines), ECoG electrode placements (red circles), and stimulation points (green crosses).
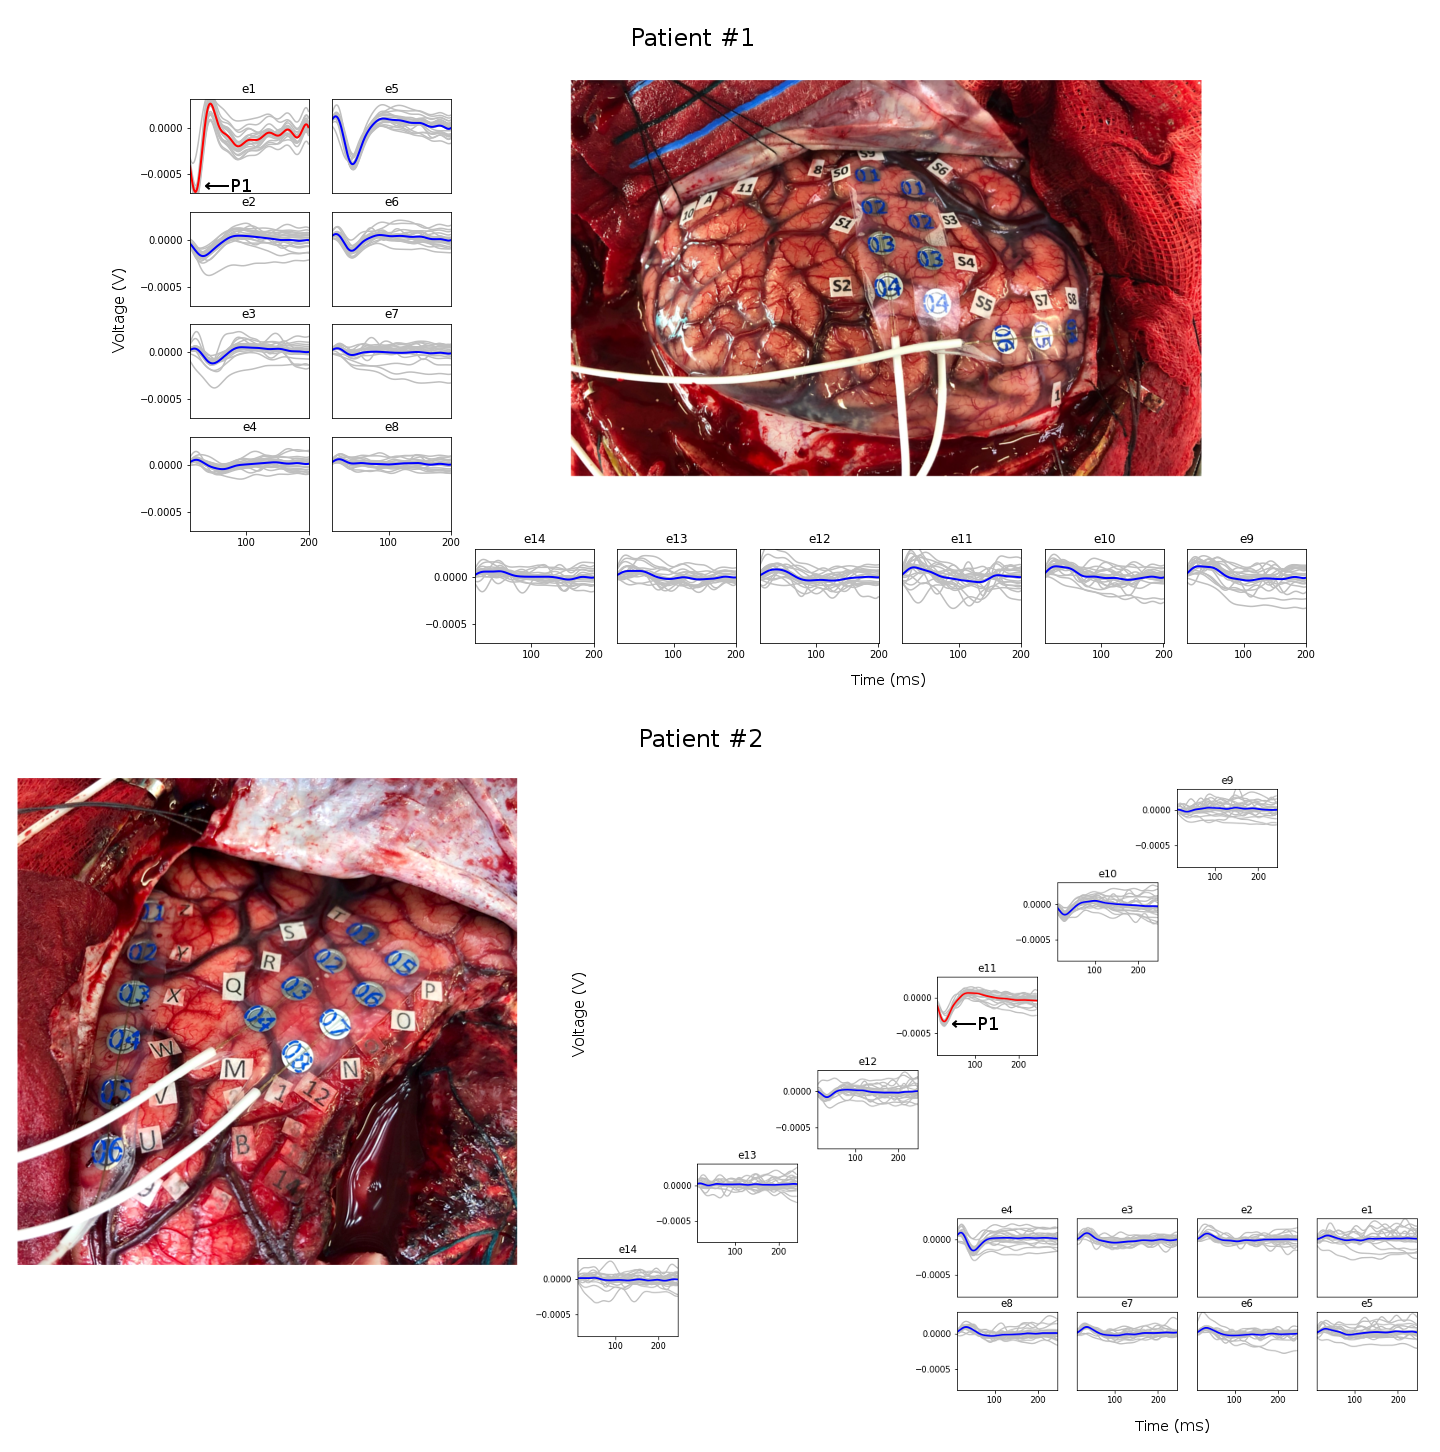
Figure 2. Placement of ECoG electrodes and sample recordings of the CCEP propagation. The signals from the electrodes nearest the stimulation site are printed in red. The P1s are visible as downward peaks recorded by the electrodes located up to 4cm away from the stimulation site.