2705
ExploreASL: a collaborative effort to process and explore multi-center ASL data1Amsterdam University Medical Center, Amsterdam, Netherlands, 2Helmholtz-Zentrum Dresden-Rossendorf, Institute for Radiopharmaceutical Cancer Research, Dresden, Germany, 3Schlegel-UW Research Institute for Aging, University of Waterloo, Waterloo, ON, Canada, 4University of Oslo, Oslo, Norway, 5University Medical Center Utrecht, Utrecht, Netherlands, 6Institute of Psychology, Kings College London, London, United Kingdom, 7Ghent University Hospital, Ghent, Belgium, 8University of Auckland, Auckland, New Zealand, 9Sunnybrook Research Institute, Toronto, ON, Canada, 10Lawson Health Research Institute, London, ON, Canada, 11University Medical Center Groningen, Groningen, Netherlands, 12Mevis Fraunhofer, Bremen, Germany, 13University College London, London, United Kingdom, 14Institute of Biomedical Engineering, University of Oxford, Oxford, United Kingdom, 15Leiden University Medical Center, Leiden, Netherlands, 16Kings College London, London, United Kingdom, 17Rochester Institute of Technology, Rochester, NY, United States
Synopsis
Arterial spin labeling (ASL) has undergone significant development since its inception; yet, standardized images processing procedures remain elusive. We present ExploreASL, a robust open source ASL image processing pipeline for clinical studies. Initiated through the European COST action ASL network, this joint effort provides integration and analysis of both single- and multi-center datasets across different operating systems. ExploreASL is optimized for both native- and standard-space analyses, and provides visual and automatic quality control on all intermediate and final images, allowing exploration of ASL datasets from multiple perspectives.
Background
The development of open source and standardized image processing pipelines is key for reproducible, robust and collaborative neuroscience1,2. Arterial spin labeling (ASL) perfusion magnetic resonance imaging (MRI)3 is rapidly maturing as a biomarker to diagnose diseases in early stages4 and monitor response to therapy5. Before ASL CBF can be used as a primary outcome measure in clinical trials, standardization of processing streams is needed6. To this end, we introduce ExploreASL: a software package designed as a comprehensive pipeline for robust multicenter ASL image processing7,8. Initiated by the European COST action “ASL in Dementia”9, ExploreASL focuses on improving compatibility between data from different MRI vendors and ASL sequences. To date, ExploreASL has been developed from more than 30 clinical studies including more than 8000 ASL scans from three MRI vendors - i.e. GE, Philips, Siemens - with different pulsed and (pseudo-)continuous ASL sequences, 2D and 3D readouts, and a variety of populations7,8,10–13. This allowed fine-tuning of ExploreASL’s versatility with the aims of: 1) increasing the comparability of perfusion studies; 2) enabling pooling of multi-center ASL datasets; and 3) encouraging validation of new methods and their translation to clinical research. This abstract provides an overview of ExploreASL.Software methods
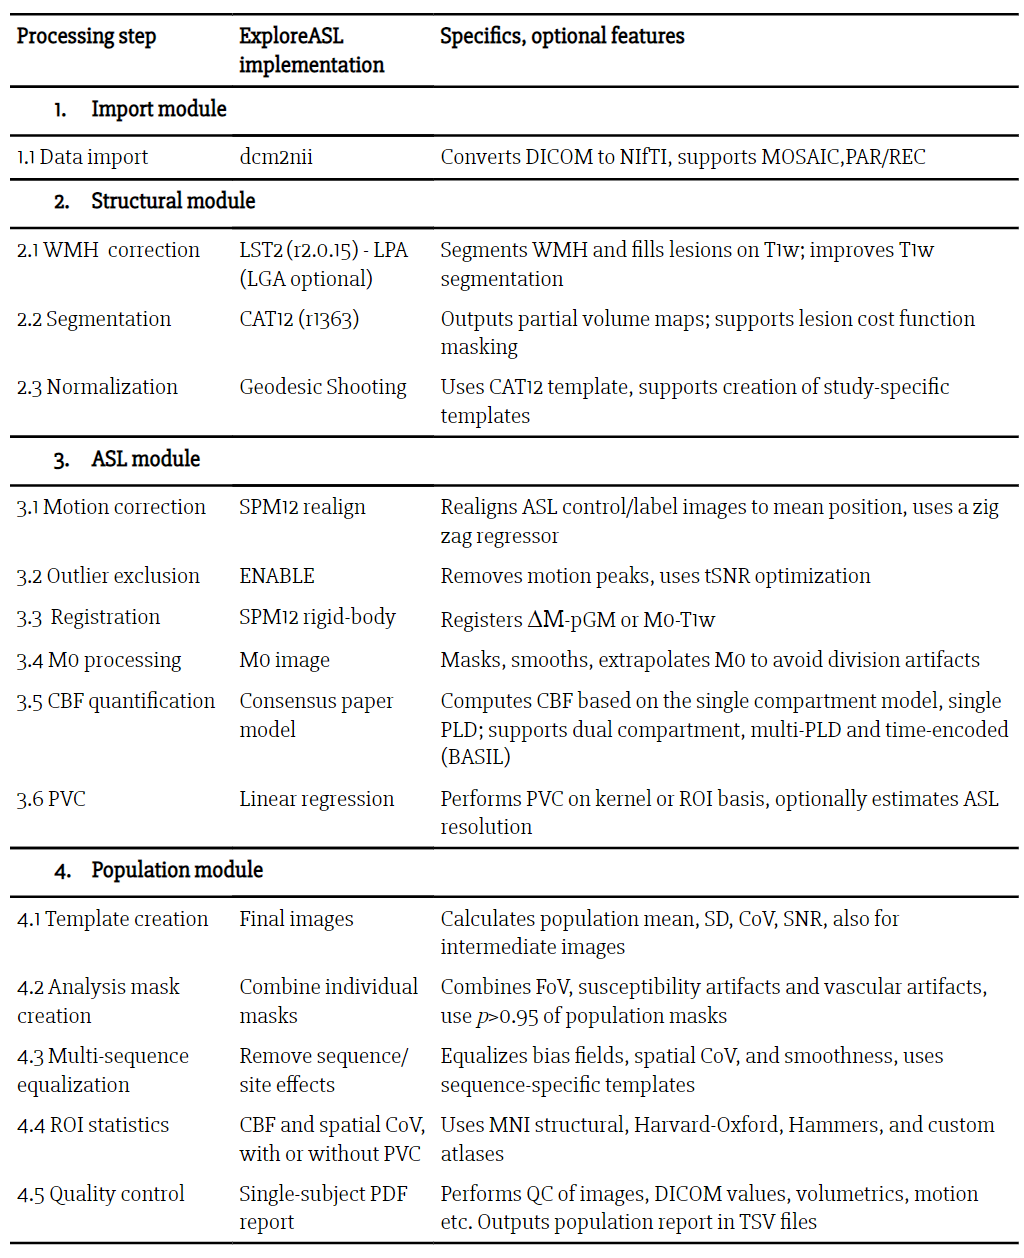
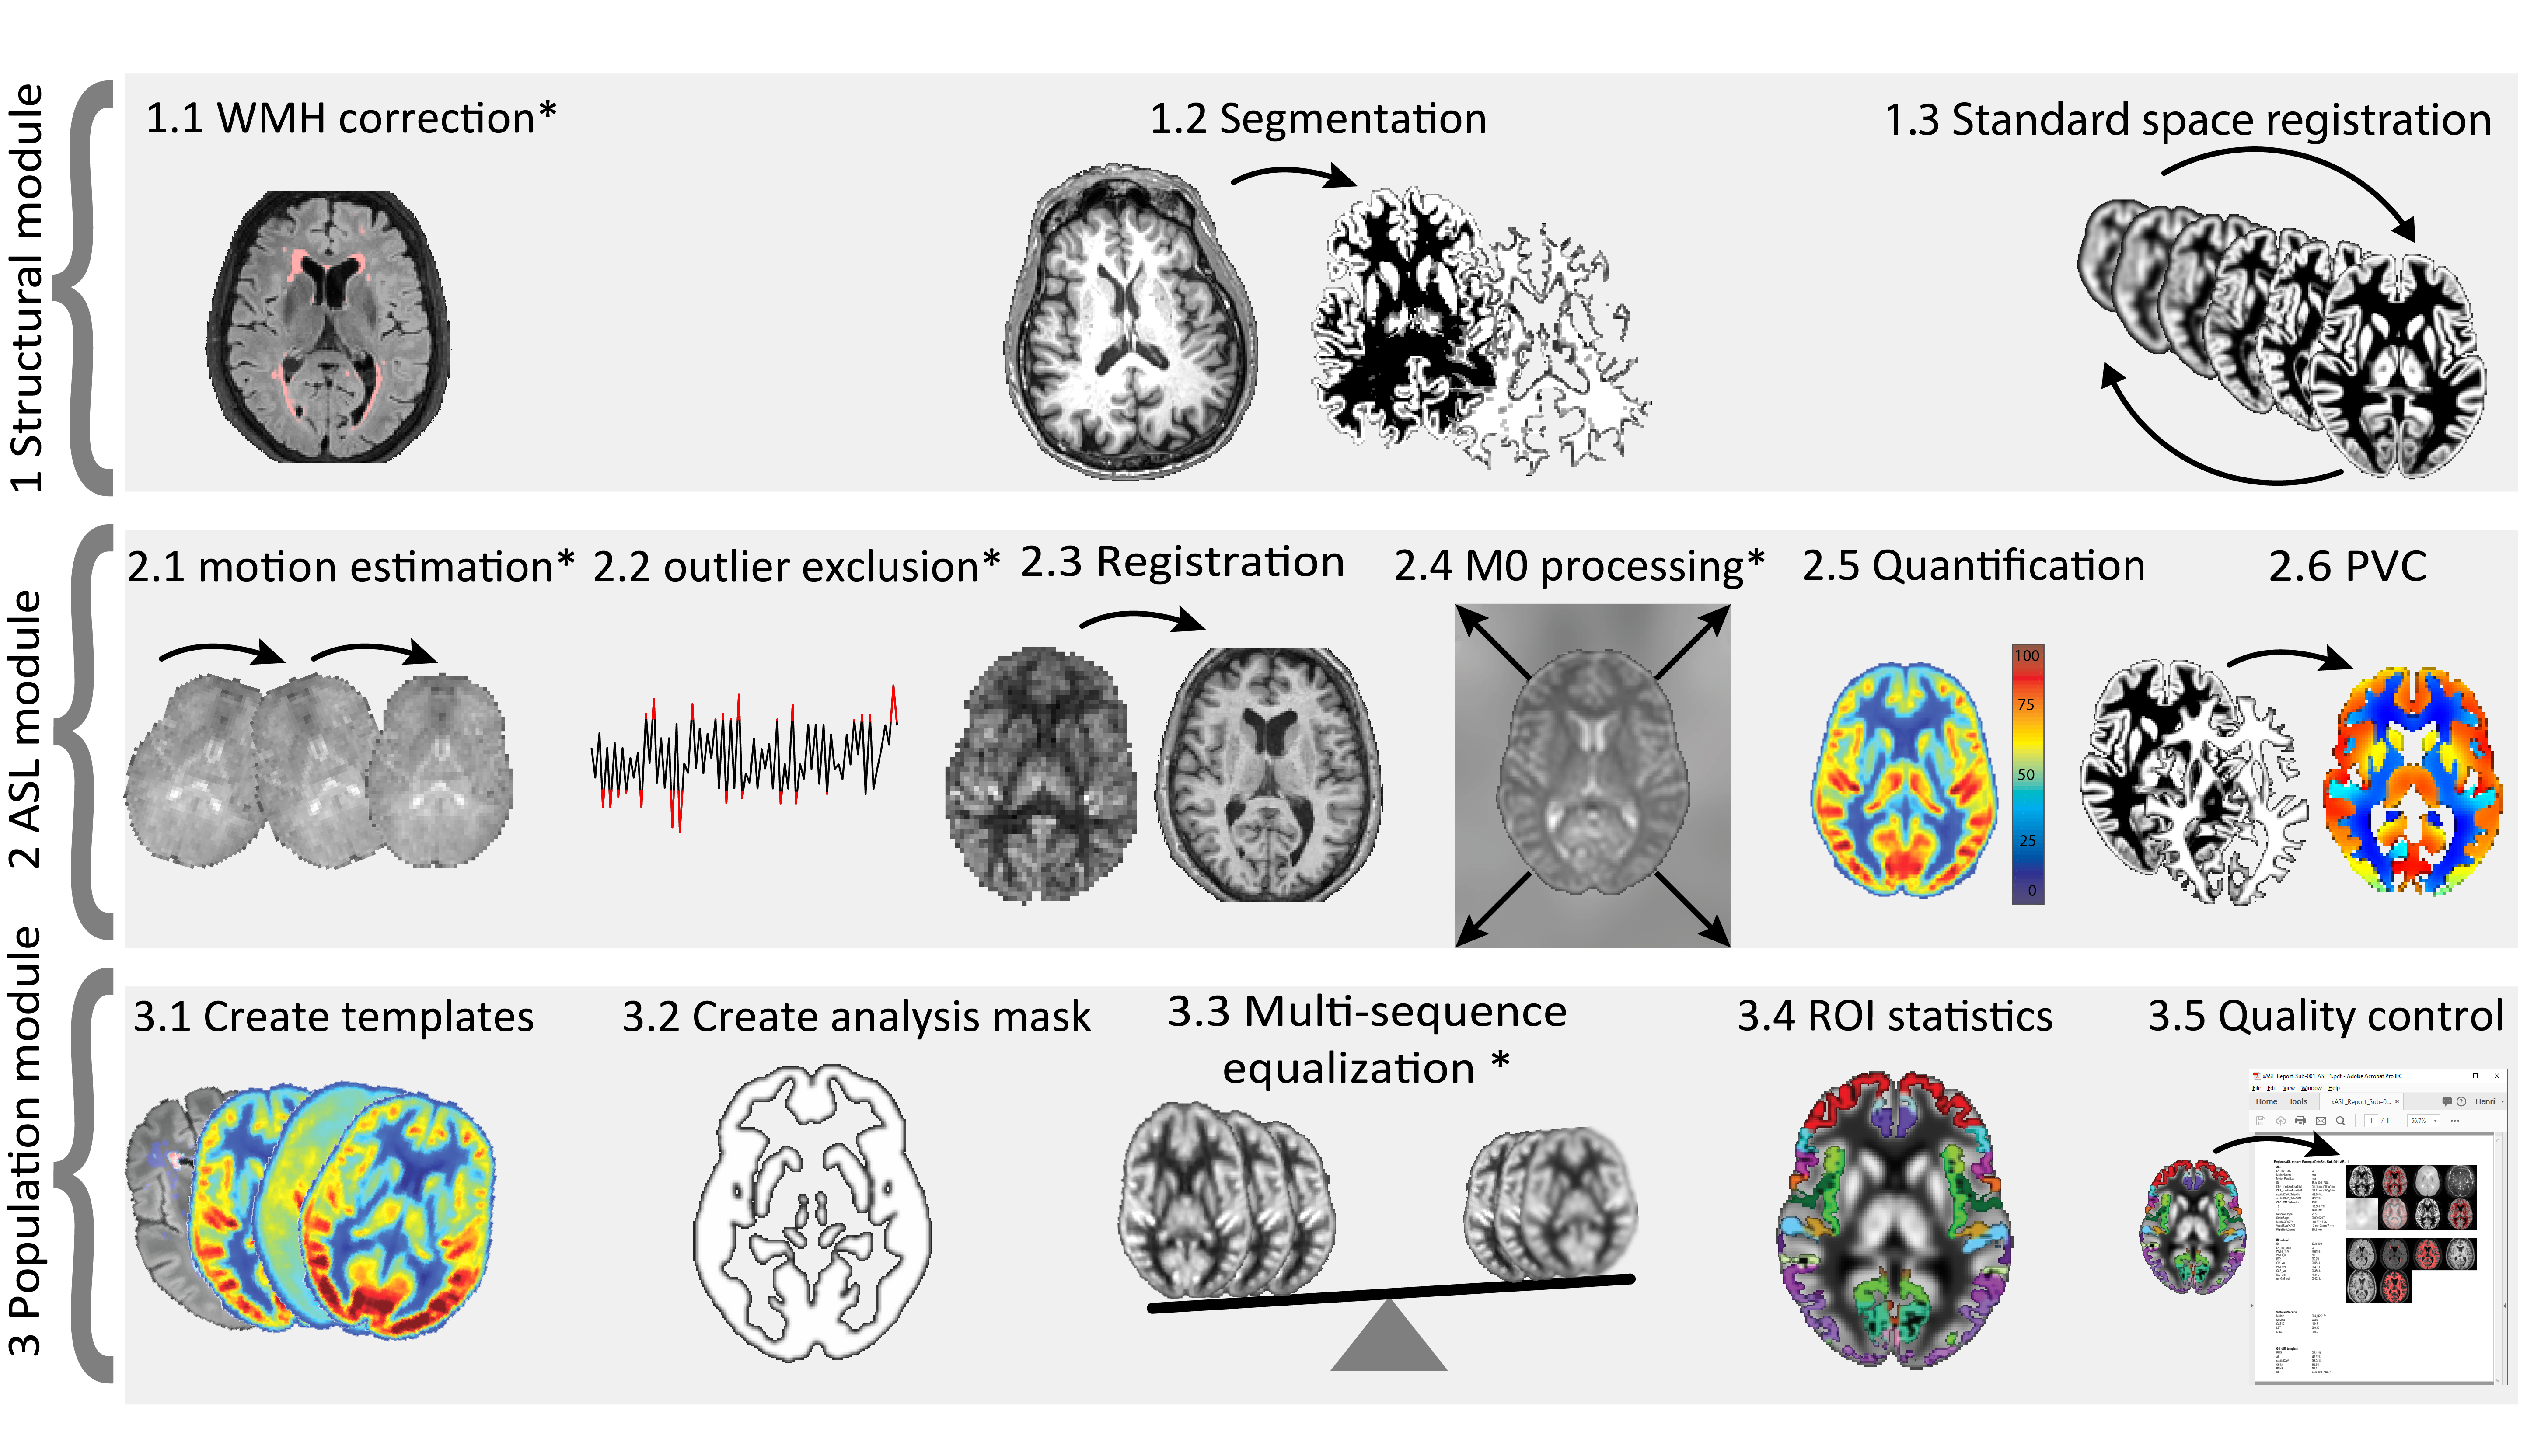
ExploreASL encompasses a fully automated pipeline from import and structural image processing to cerebral blood flow (CBF) quantification and statistical analyses, and automatically handles heterogeneous multicenter data. ExploreASL is written in Matlab (MathWorks, MA, USA), based on SPM1214, and structured in a modular fashion to allow easy incorporation of third-party modules (Table 1, Figure 1). Significant efforts were also made to allow for robust tissue segmentation and spatial registration, which is critical for partial volume correction15 and for the creation of ASL-based atlases16. The full pipeline is summarized in Table 1. Key features of ExploreASL include:
- self-contained software suite, without the need to install third party toolboxes outside Matlab; compatible with Linux, MacOS and Windows operating systems;
- flexible data import: different formats (DICOM, PAR/REC, MOSAIC)17, control-label order detection, support for the standardized Brain Imaging Data Structure (BIDS) format18;
- flexible optimization of settings for clinical studies through a study configuration file;
- extensive data management: anonymization, defacing, compression;
- modular design: automatic iteration over all available participants and scans; allows to suspend and resume processing at any point;
- image processing optimized for both native- and standard-space analyses, advanced ASL markers, such as spatial CoV10, and partial volume correction15.
Quality control results
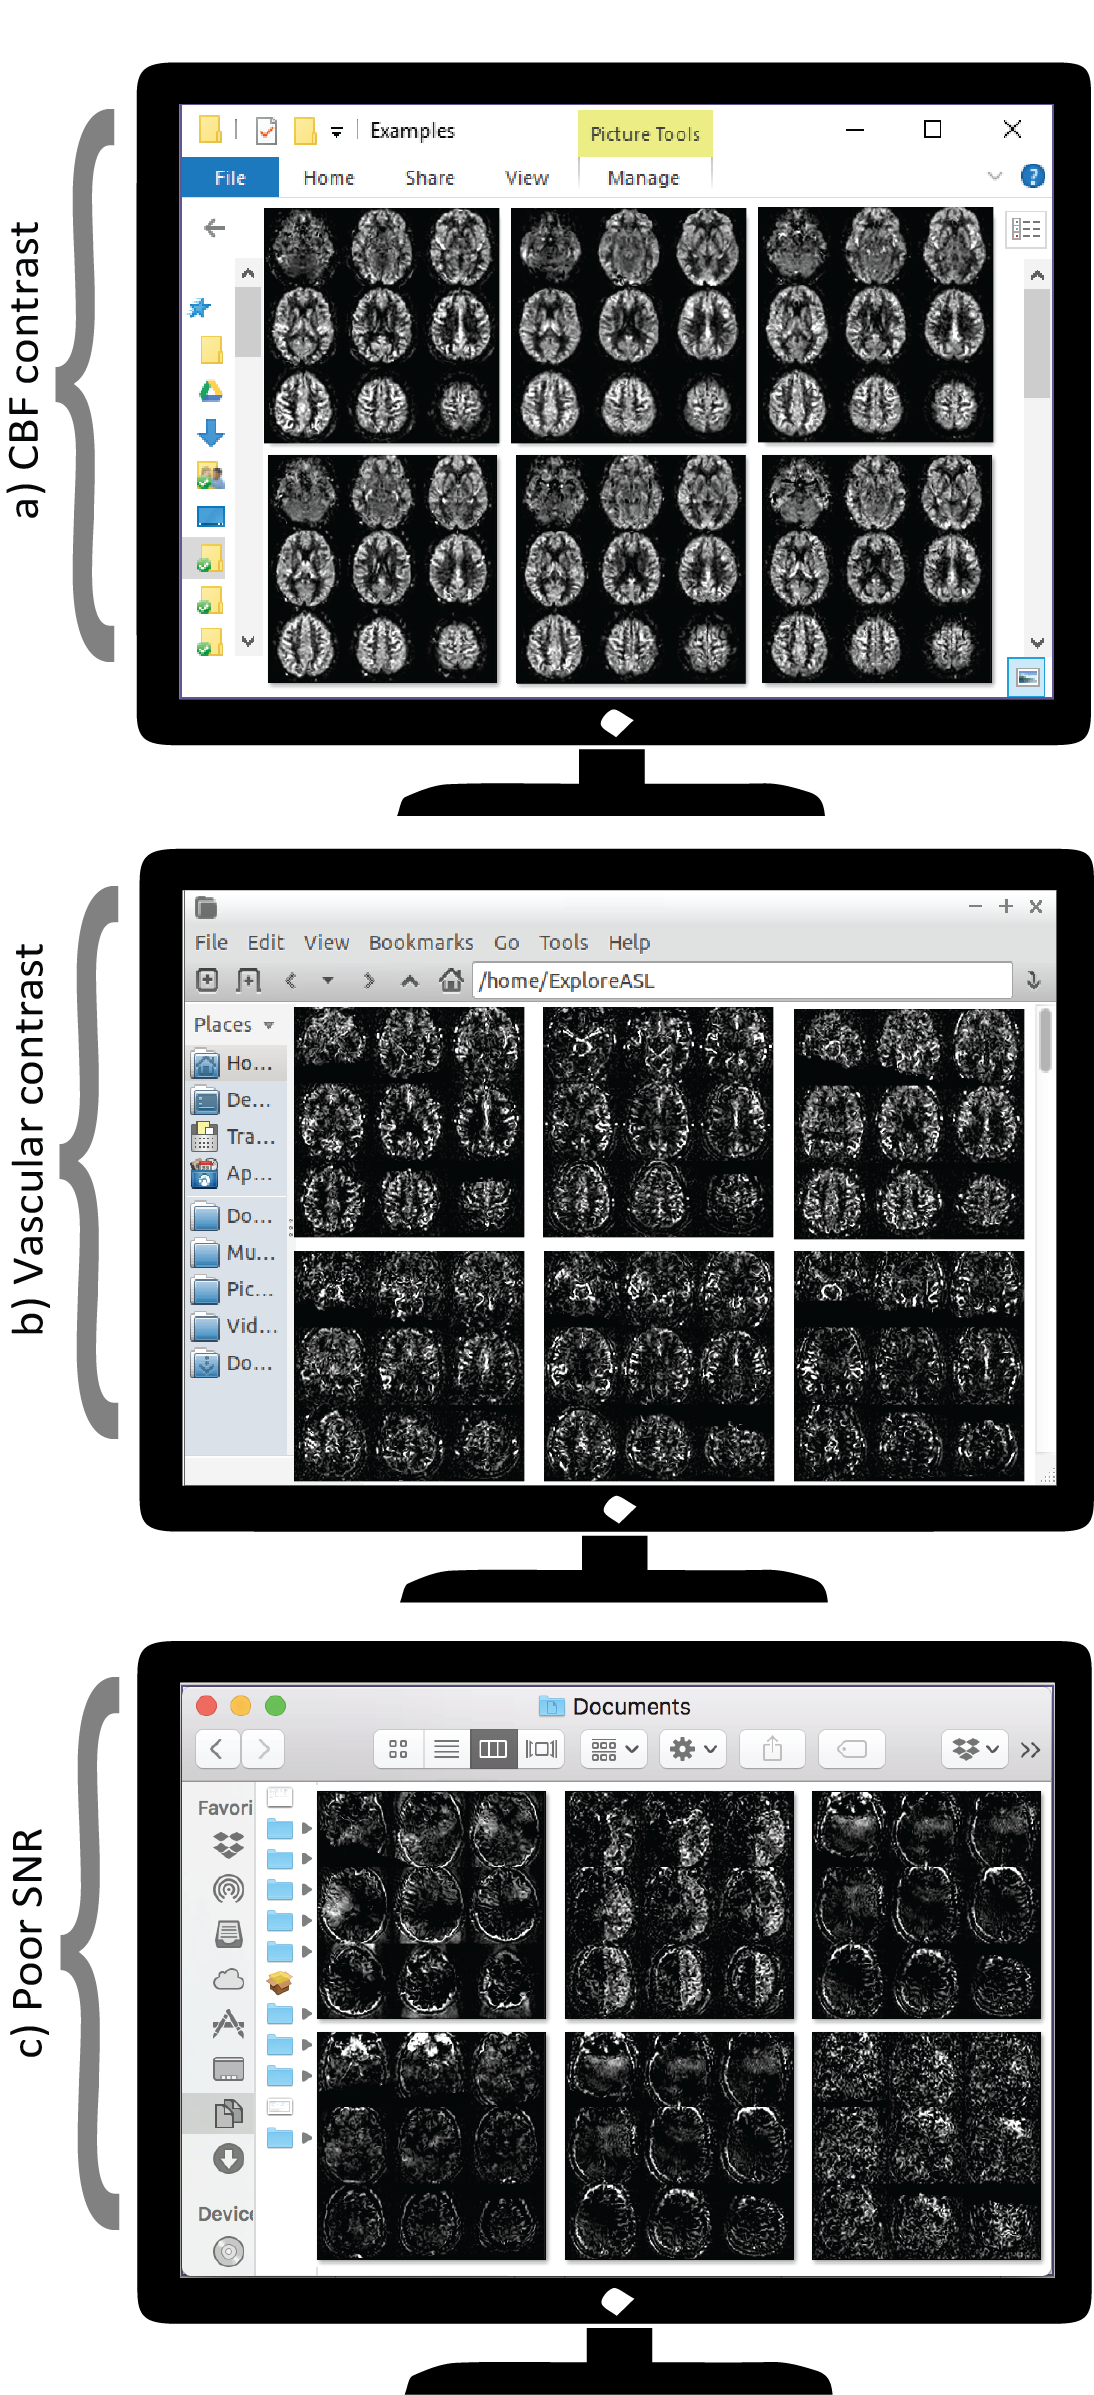
ExploreASL is available through GitHub, and regular releases will be available at www.ExploreASL.com. The software allows for quick data exploration and visual QC of intermediate and final ASL images saved in individual NIfTI and JPG images (Figure 2). Individual and group statistics are saved in PDF and spreadsheets, respectively, for anatomical and vascular regions-of-interest (ROIs)19,20. Furthermore, the QC of ExploreASL includes:
- Overview of missing and unprocessed files;
- Logging of history, details and errors;
- Checks the DICOM tags of TR, TE and scale factors/slopes across individuals. Deviations can hint to software updates or different scanners;
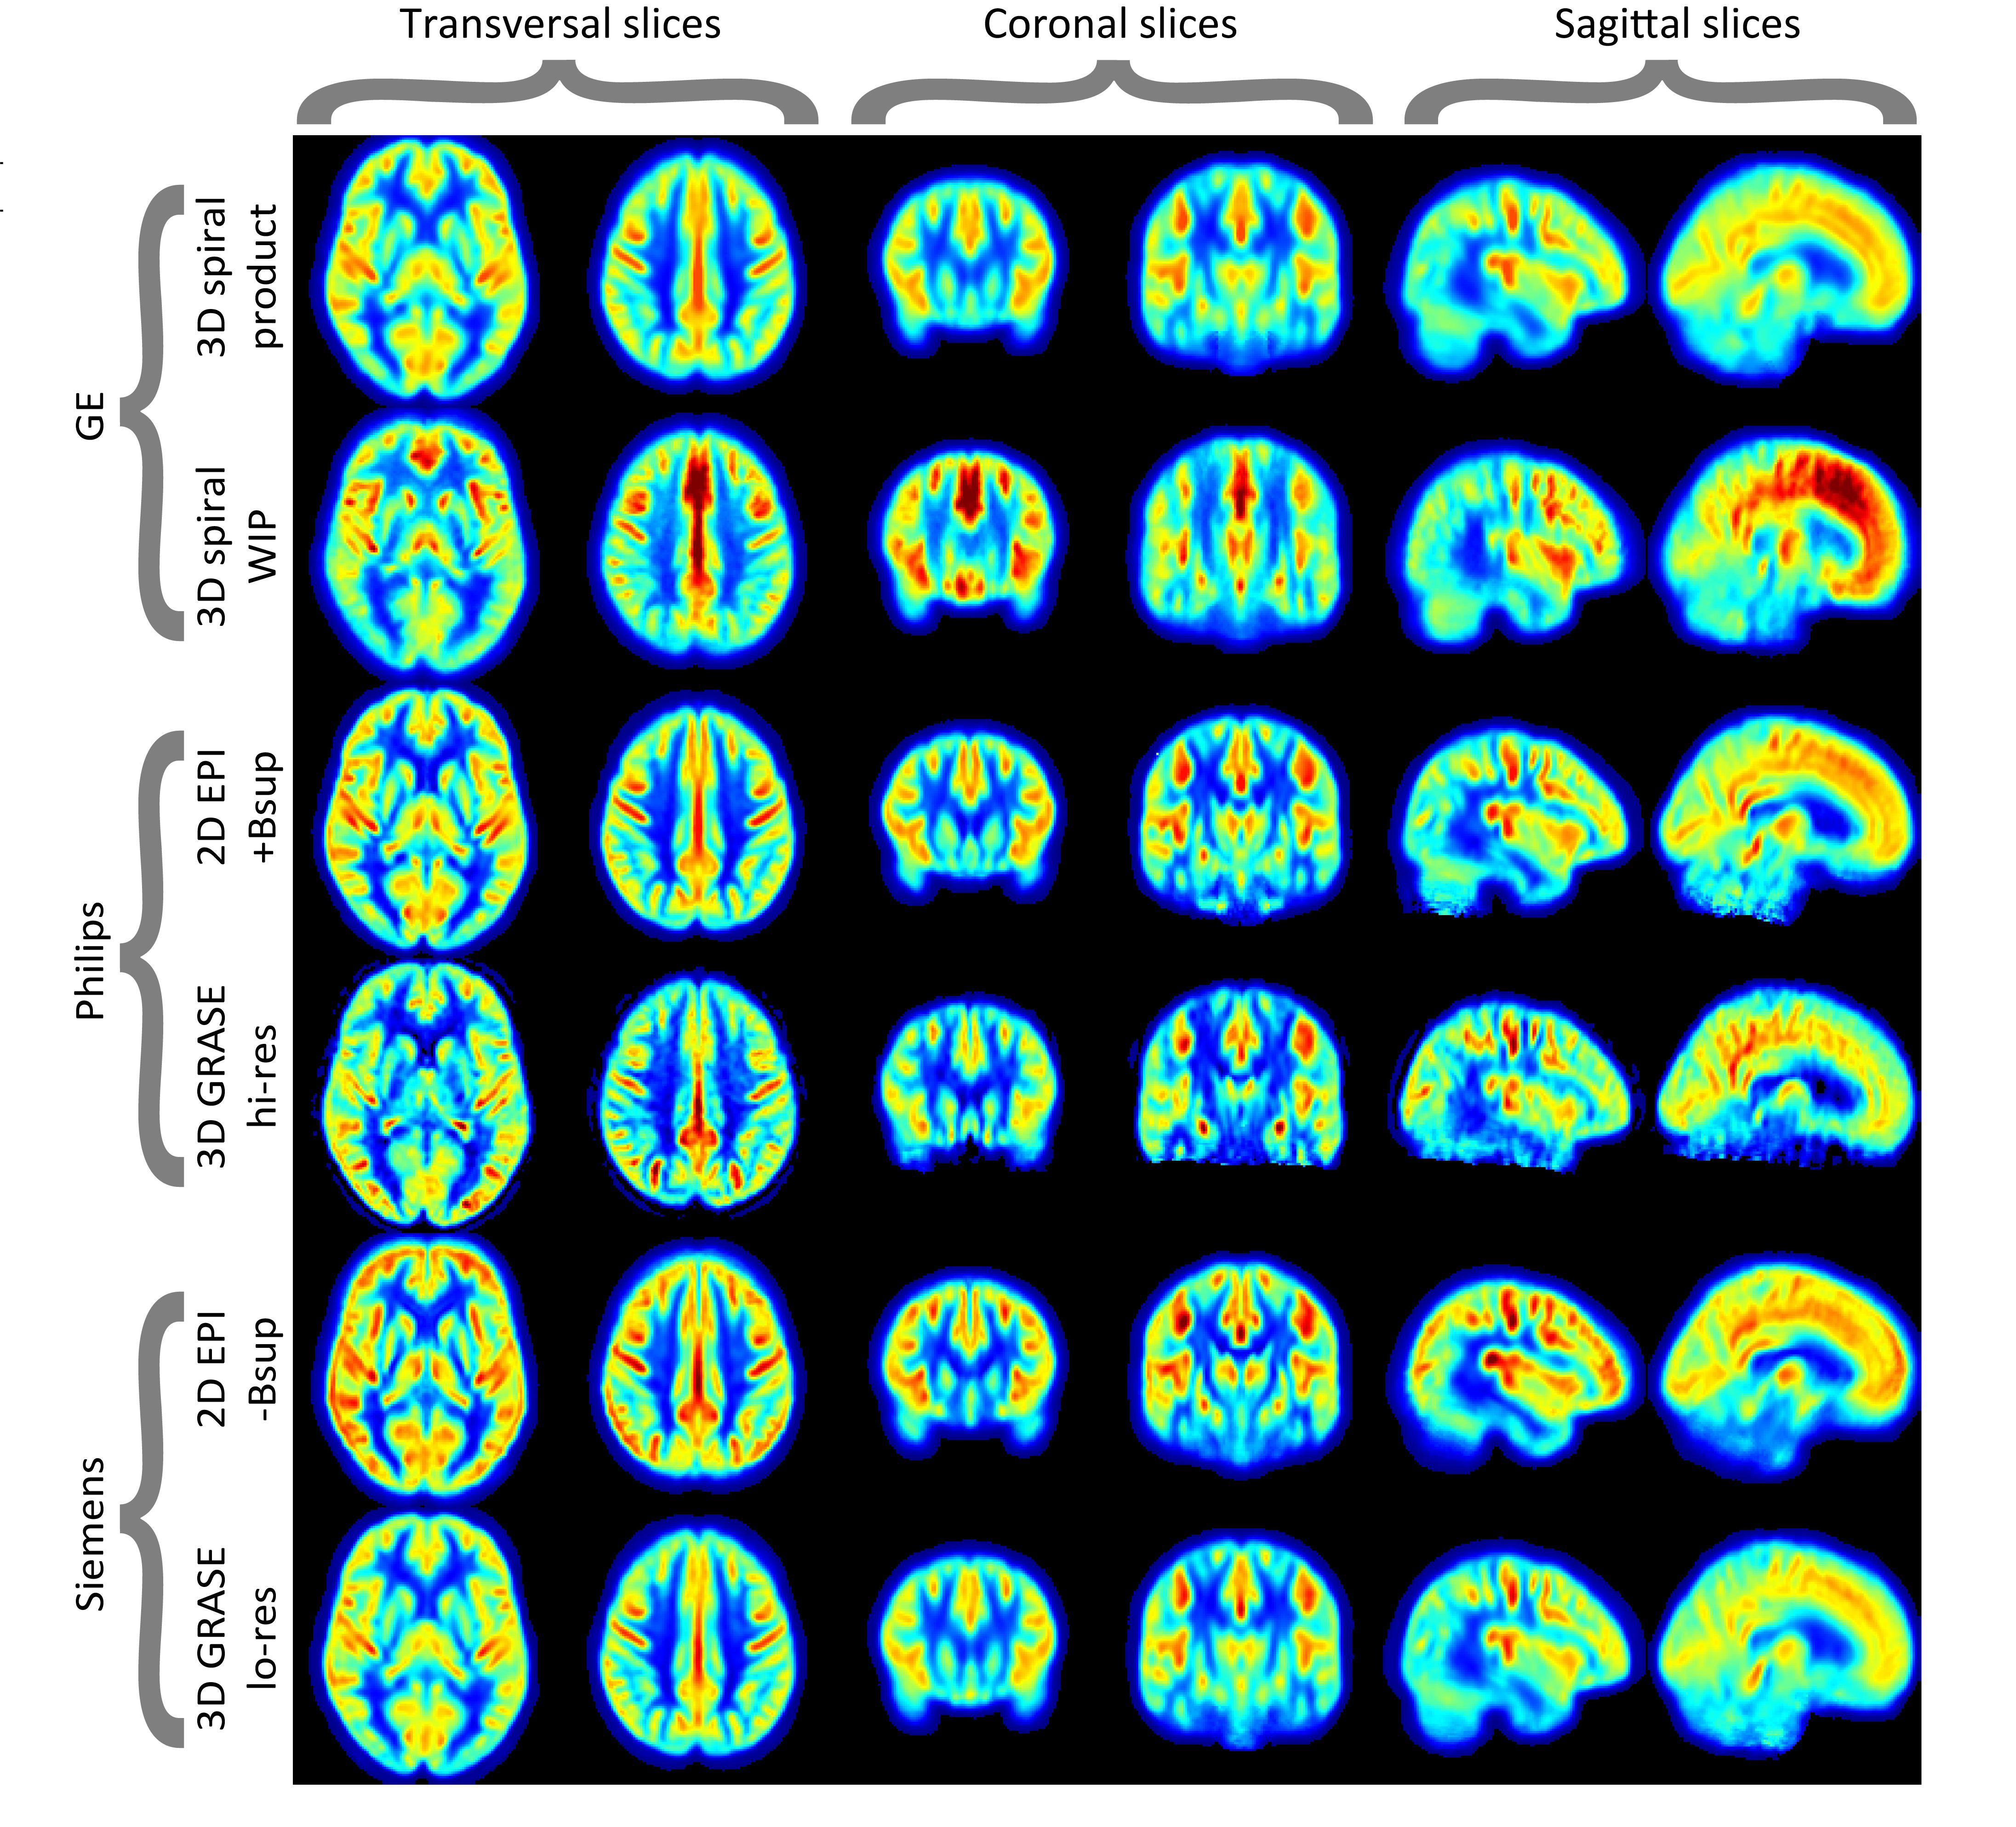
- Automatically compares individual ASL images with an atlas, a group average, or an average from a previous study (Figures 3-4). Whole-brain or regional differences (e.g. CBF) larger than 2-3 SD are indicated and should be visually inspected for artifacts;
- Compares motion statistics with a fixed threshold and the population average;
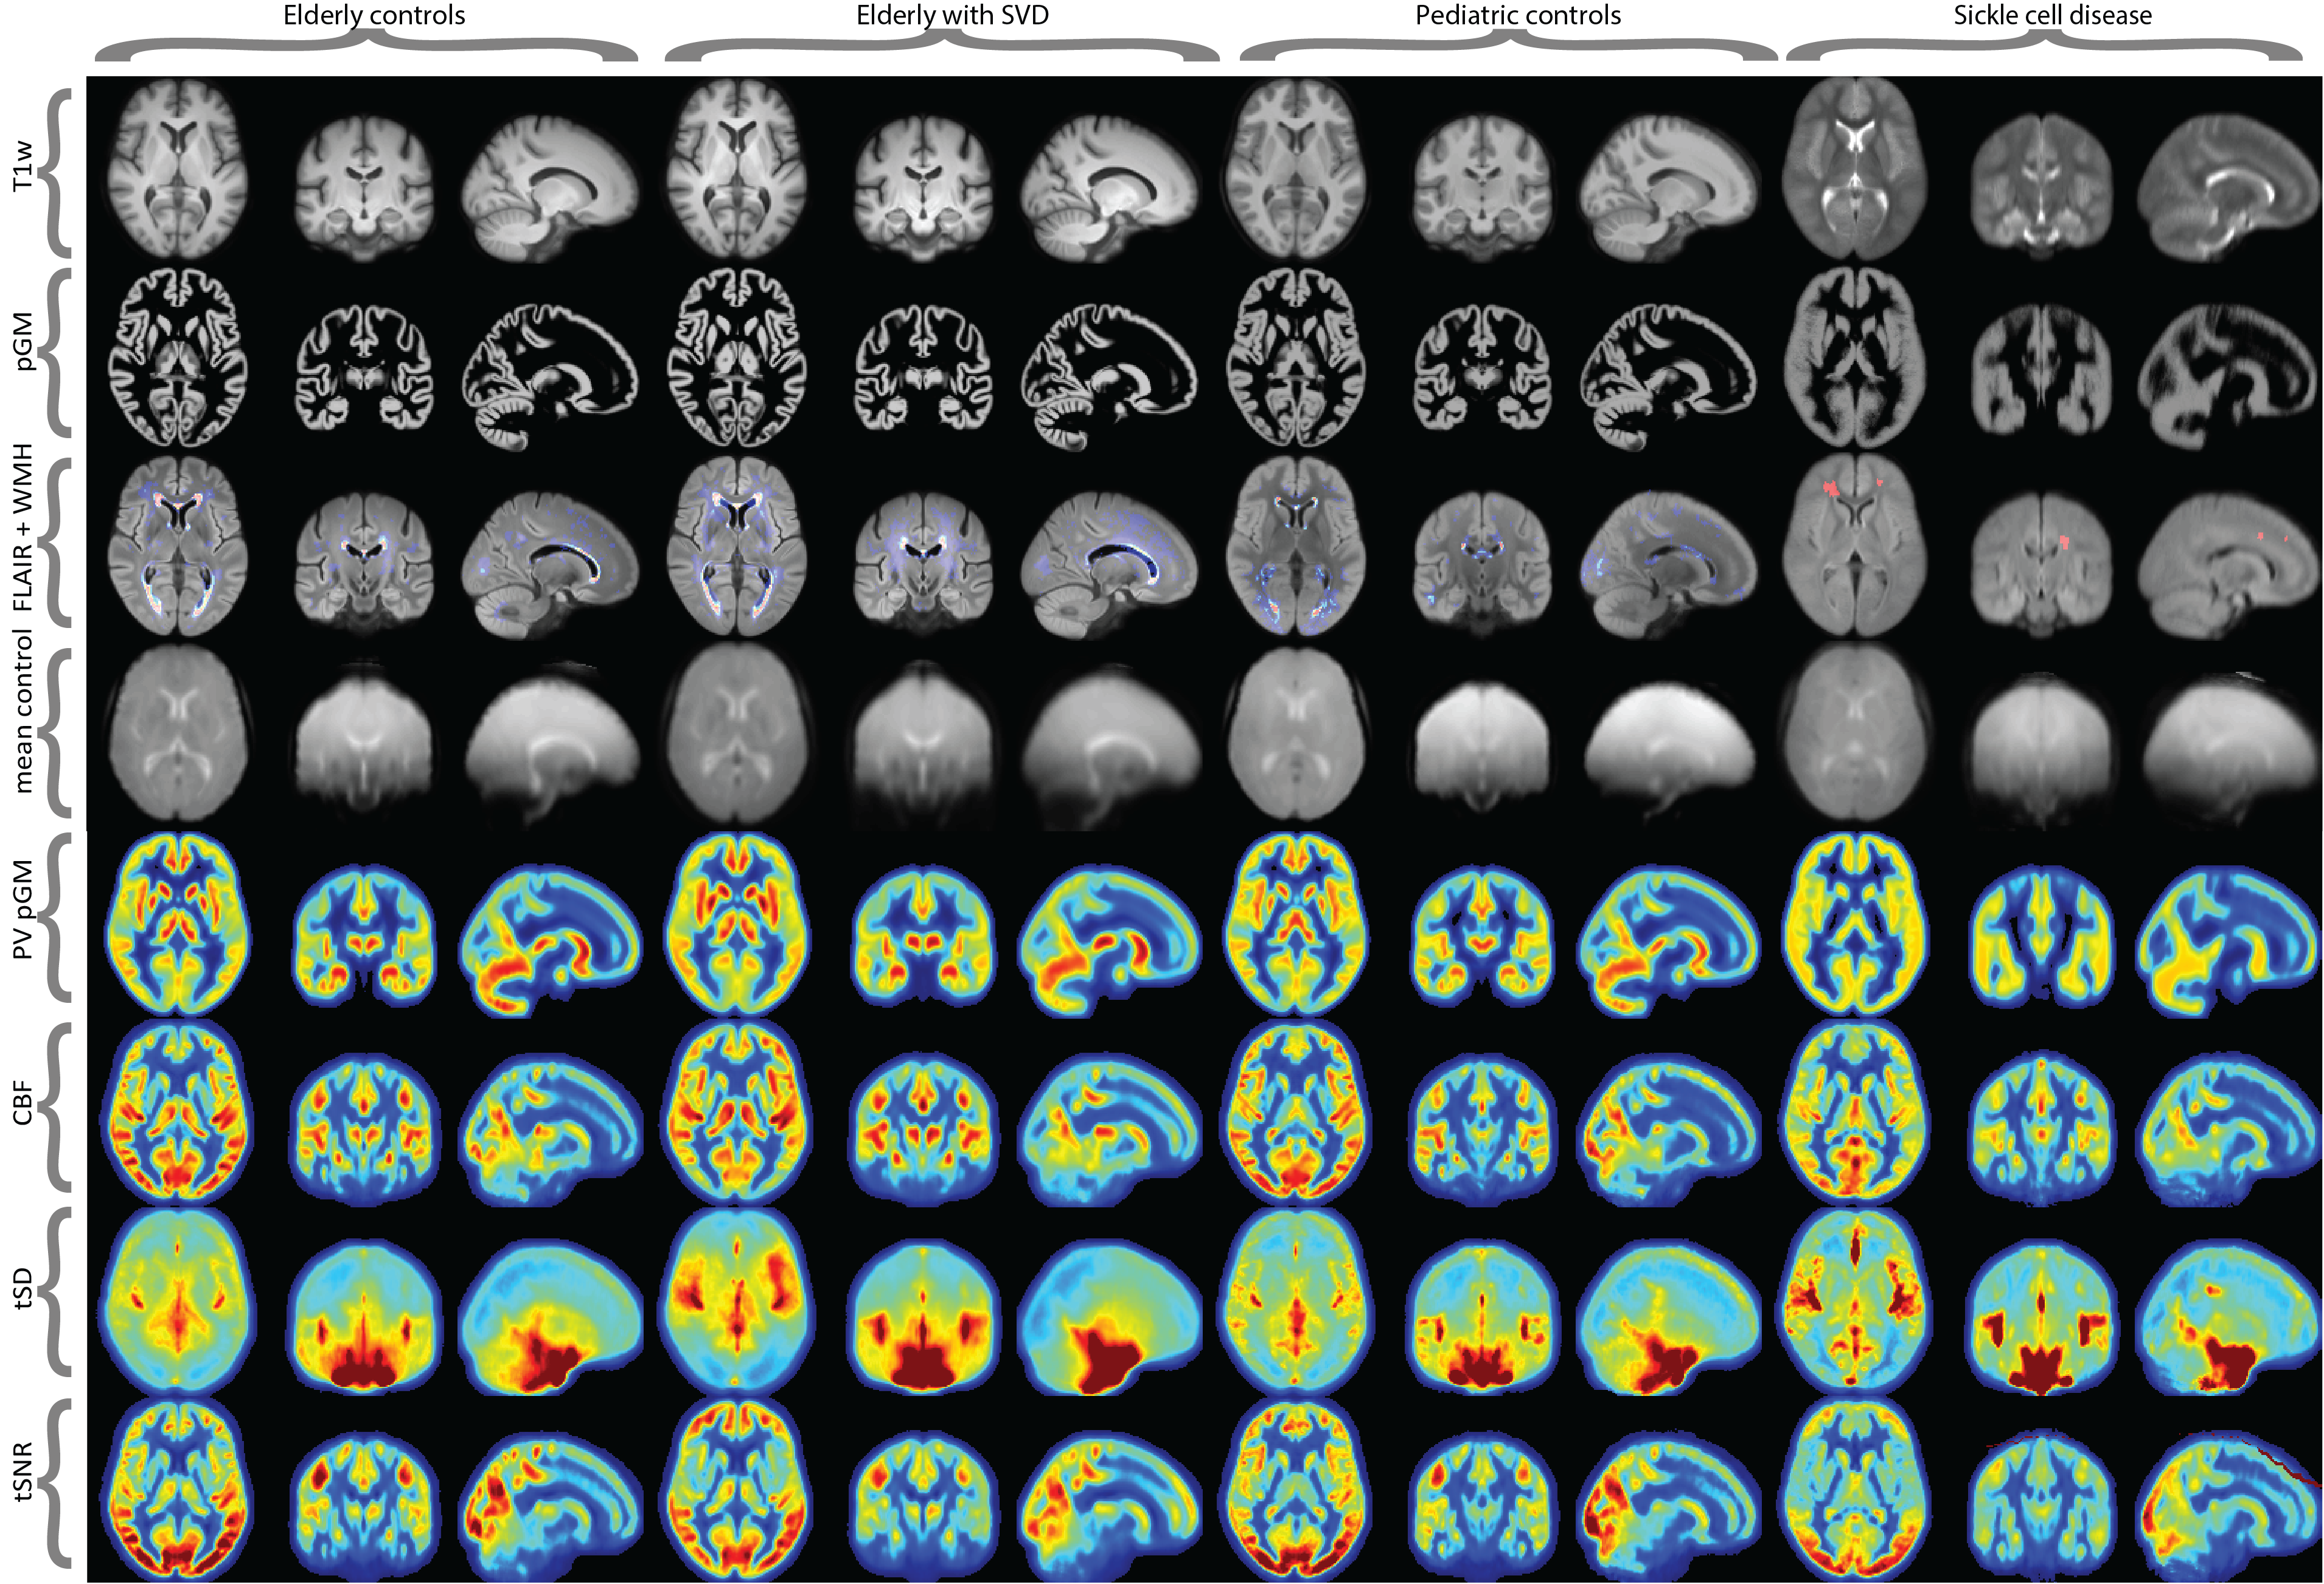
- Visual inspection of individual and population-average images in the same standard space, for structural images, segmentations, intermediate images, M0, and CBF images (Figure 4).
Discussion & future developments
While several ASL image processing pipelines are freely available, ExploreASL is to our knowledge the most complete open-source ASL image processing solution. Its agile development through a growing team of international scientists increases the flexibility, generalization and robustness of the pipeline1 and encourages inter-institutional cross-pollination through standardized exploration of new methods and clinical questions. Future development includes full BIDS compatibility18, a graphical user interface (GUI), and the quantification of advanced ASL schemes such as time-encoded or velocity-selective ASL21. We anticipate that ExploreASL can lay a foundation for collaboration of clinicians and scientists from various backgrounds, to facilitate and accelerate validation of ASL image processing approaches, as well as their translation to clinical research and practice.Acknowledgements
This work has received support from the EU/EFPIA Innovative Medicines Initiative Joint Undertaking EPAD grant agreement n° 115736.. Additionally, this work received support from the EU-EFPIA Innovative Medicines Initiatives Joint Undertaking (grant No 115952). FB and XG are supported by NIHR UCLH biomedical research funding. DLT is supported by the UCL Leonard Wolfson Experimental Neurology Centre (PR/ylr/18575). EDV is supported by the Wellcome/EPSRC Centre for Medical Engineering [WT 203148/Z/16/Z]. The authors acknowledge Guillaume Flandin, Robert Dahnke, and Paul Schmidt for reviewing the structural module for its implementation of SPM12, CAT12, and LST, respectively. We acknowledge Krzysztof Gorgolewksi for his advice on the BIDS implementation. HM is supported by Amsterdam Neuroscience funding.
We acknowledge the EU-funded COST action ASL In Dementia (COST-AID) for initiating ExploreASL.
References
1. Nichols, T. E. et al. Best practices in data analysis and sharing in neuroimaging using MRI. Nat. Neurosci. 20, 299–303 (2017).
2. Poldrack, R. A. et al. Scanning the horizon: Towards transparent and reproducible neuroimaging research. Nat. Rev. Neurosci. 18, 115–126 (2017).
3. Alsop, D. C. et al. Recommended implementation of arterial spin-labeled perfusion MRI for clinical applications: A consensus of the ISMRM perfusion study group and the european consortium for ASL in dementia. Magnetic Resonance in Medicine (2014). doi:10.1002/mrm.25197
4. Steketee, R. M. E. et al. Early-stage differentiation between presenile Alzheimer’s disease and frontotemporal dementia using arterial spin labeling MRI. Eur. Radiol. 26, 244–253 (2016).
5. Wang, D. J. J. et al. Potentials and challenges for arterial spin labeling in pharmacological magnetic resonance imaging. J. Pharmacol. Exp. Ther. 337, 359–366 (2011).
6. ten Kate, M. et al. Secondary prevention of Alzheimer’s dementia: neuroimaging contributions. Alzheimers. Res. Ther. 10, 112 (2018).
7. Mutsaerts, H. et al. Comparison of arterial spin labeling registration strategies in the multi-center GENetic frontotemporal dementia initiative (GENFI). J. Magn. Reson. Imaging 47, 131–140 (2018).
8. Mutsaerts, H. J. M. M. et al. Multi-vendor reliability of arterial spin labeling perfusion MRI using a near-identical sequence: Implications for multi-center studies. Neuroimage 113, (2015).
9. Golay, X. & Guenther, M. Arterial spin labelling: final steps to make it a clinical reality. MAGMA. 25, 79–82
10. Mutsaerts, H. et al. The spatial coefficient of variation in arterial spin labeling cerebral blood flow images. J. Cereb. Blood Flow Metab. 37, 3184–3192 (2017).
11. Blokhuis, C. et al. Higher subcortical and white matter cerebral blood flow in perinatally HIV-infected children. Medicine 96, e5891 (2017).
12. Cole, J. H. et al. No Evidence for Accelerated Aging-Related Brain Pathology in Treated Human Immunodeficiency Virus: Longitudinal Neuroimaging Results From the Comorbidity in Relation to AIDS (COBRA) Project. Clin. Infect. Dis. 66, 1899–1909 (2018).
13. Schrantee, A. et al. Age-dependent effects of methylphenidate on the human dopaminergic system in young vs adult patients with attention-deficit/hyperactivity disorder: A randomized clinical trial. JAMA Psychiatry 73, 955–962 (2016).
14. Ashburner, J. SPM: A history. Neuroimage 62, 791–800 (2012).
15. Asllani, I., Borogovac, A. & Brown, T. R. Regression algorithm correcting for partial volume effects in arterial spin labeling MRI. Magn. Reson. Med. 60, 1362–1371 (2008).
16. Maumet, C., Maurel, P., Ferré, J.-C. & Barillot, C. Automatic detection of perfusion abnormalities based on an Arterial Spin Labeling template. 66, 35043 (2012).
17. Li, X., Morgan, P. S., Ashburner, J., Smith, J. & Rorden, C. The first step for neuroimaging data analysis: DICOM to NIfTI conversion. J. Neurosci. Methods 264, 47–56 (2016).
18. Gorgolewski, K. J. et al. The brain imaging data structure, a format for organizing and describing outputs of neuroimaging experiments. Scientific Data 3, 160044 (2016).
19. Mazziotta, J. et al. A probabilistic atlas and reference system for the human brain: International Consortium for Brain Mapping (ICBM). Philos. Trans. R. Soc. Lond. B Biol. Sci. 356, 1293–1322 (2001).
20. Tatu, L., Moulin, T., Bogousslavsky, J. & Duvernoy, H. Arterial territories of the human brain: cerebral hemispheres. Neurology 50, 1699–1708 (1998).
21. Schmid, S. et al. Comparison of velocity- and acceleration-selective arterial spin labeling with [15O]H2O positron emission tomography. J. Cereb. Blood Flow Metab. 35, 1–8 (2015).
Figures