2704
Deep learning-based diffusion method alleviates spurious group differences due to head motion1Center for Brain Imaging Science and Technology, Key Laboratory for Biomedical Engineering of Ministry of Education, College of Biomedical Engineering and Instrumental Science, Zhejiang University, Hangzhou, China, 2Department of Instrument Science & Technology, Zhejiang University, Hangzhou, China, 3Department of Imaging Sciences, University of Rochester, Rochester, NY, United States
Synopsis
Head motion occurring during the acquisition of diffusion-weighted (DW) images will cause deterioration in quality of diffusion model reconstruction, which could lead to spurious group differences of DW measures when there is difference in head motion for different groups. We have previously developed a method for robust diffusion kurtosis mapping of motion-contaminated data. In this study, we applied it in a group level, and the results demonstrated its ability in ameliorating spurious group differences due to head motion. The method can be applied to data with different motion level thus improving the utilization and statistic power of some valuable but motion-corrupted DW data.
Introduction
Head motion is inevitable in diffusion imaging. Severe motion can simply make data unusable. Moreover, small group differences in head motion could also introduce false positive group differences in diffusion measures.1 In our previous study, we have developed a hierarchical convolutional neural network (H-CNN) that can help robust diffusion parametric mapping, and showed its power in data with large motion using quantitative measures from individual subjects.2 In this study, we apply this method to image datasets of children with attention deficit hyperactivity disorder (ADHD) to investigate its use at group level.Method
Dataset
We employed data from 18 children diagnosed with ADHD (5 females and 13 males; age: 10.45±2.94) from the Healthy Brain Network Database.3 The data were collected on a Siemens 3T Prisma scanner (Siemens, Erlangen, Germany) with 32-channel head coil. The diffusion data were acquired at 1.7 mm isotropic resolution with the diffusion weighting of b = 1500, and 3000 s/mm2 applied in 64 directions in each shell, and one b=0 s/mm2 images, resulting in a total of 129 diffusion-weighted image (DWI) volumes. A field map was also acquired.
Preprocess and motion assessment
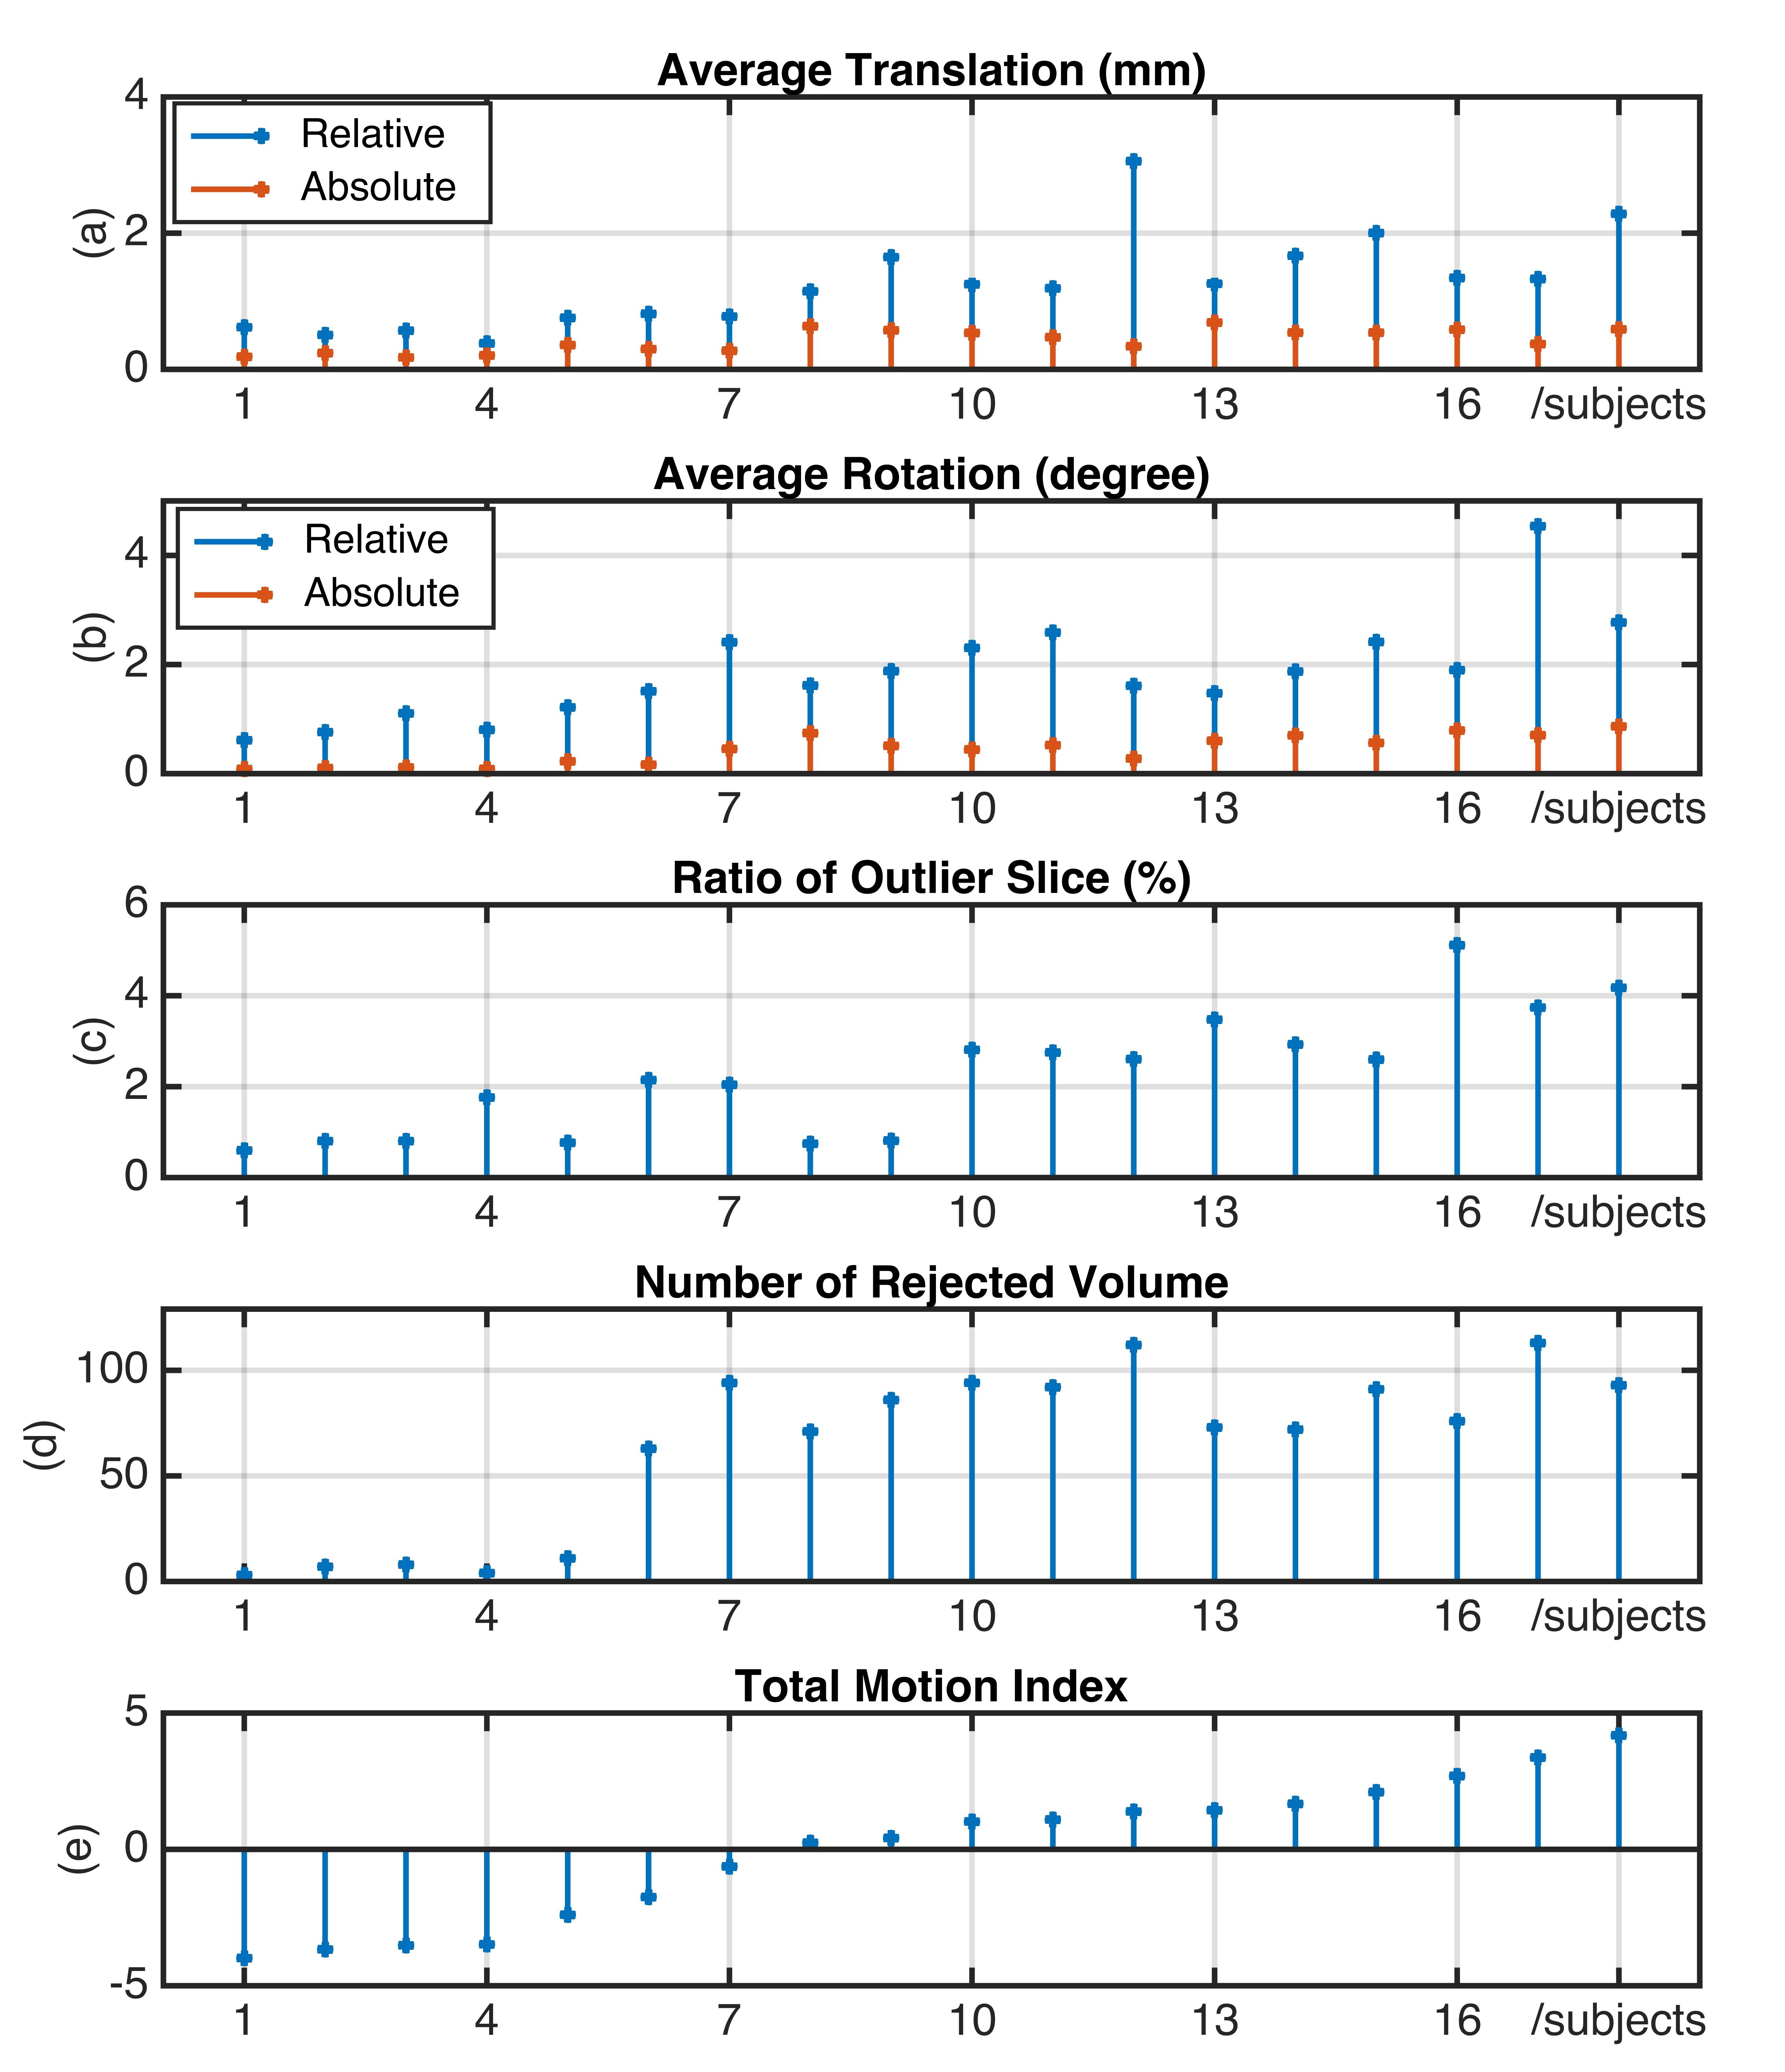
For each subject, all the DWIs were preprocessed for the integrated correction of motion (between-volume) and distortion.4 We also apply outlier replacement algorithms to detect and replace within-volume outliers.5 Then, motion assessment measures for each DWI volume were calculated, including relative translations (t0) and rotation (r0) to the first volume, absolute translations (t1) and rotation (r1) to its previous volume, and ratio of outlier slices (Ro). Those measures were used as volume rejection criteria for H-CNN reconstruction.
Image reconstruction
For the purpose of comparison, conventional model reconstruction 6 was firstly used, with all the DWIs reserved for diffusion kurtosis estimation based on the finding that removing DW volumes would cause detrimental impact when estimating the diffusion measures.7 For H-CNN method, data from two subjects with very small motion were used as training dataset and the training labels were from the model reconstruction. For each subject, only DWIs fulfills restriction of motion measures were reserved for testing and corresponding DWIs in the training dataset were used for training.
Group analysis
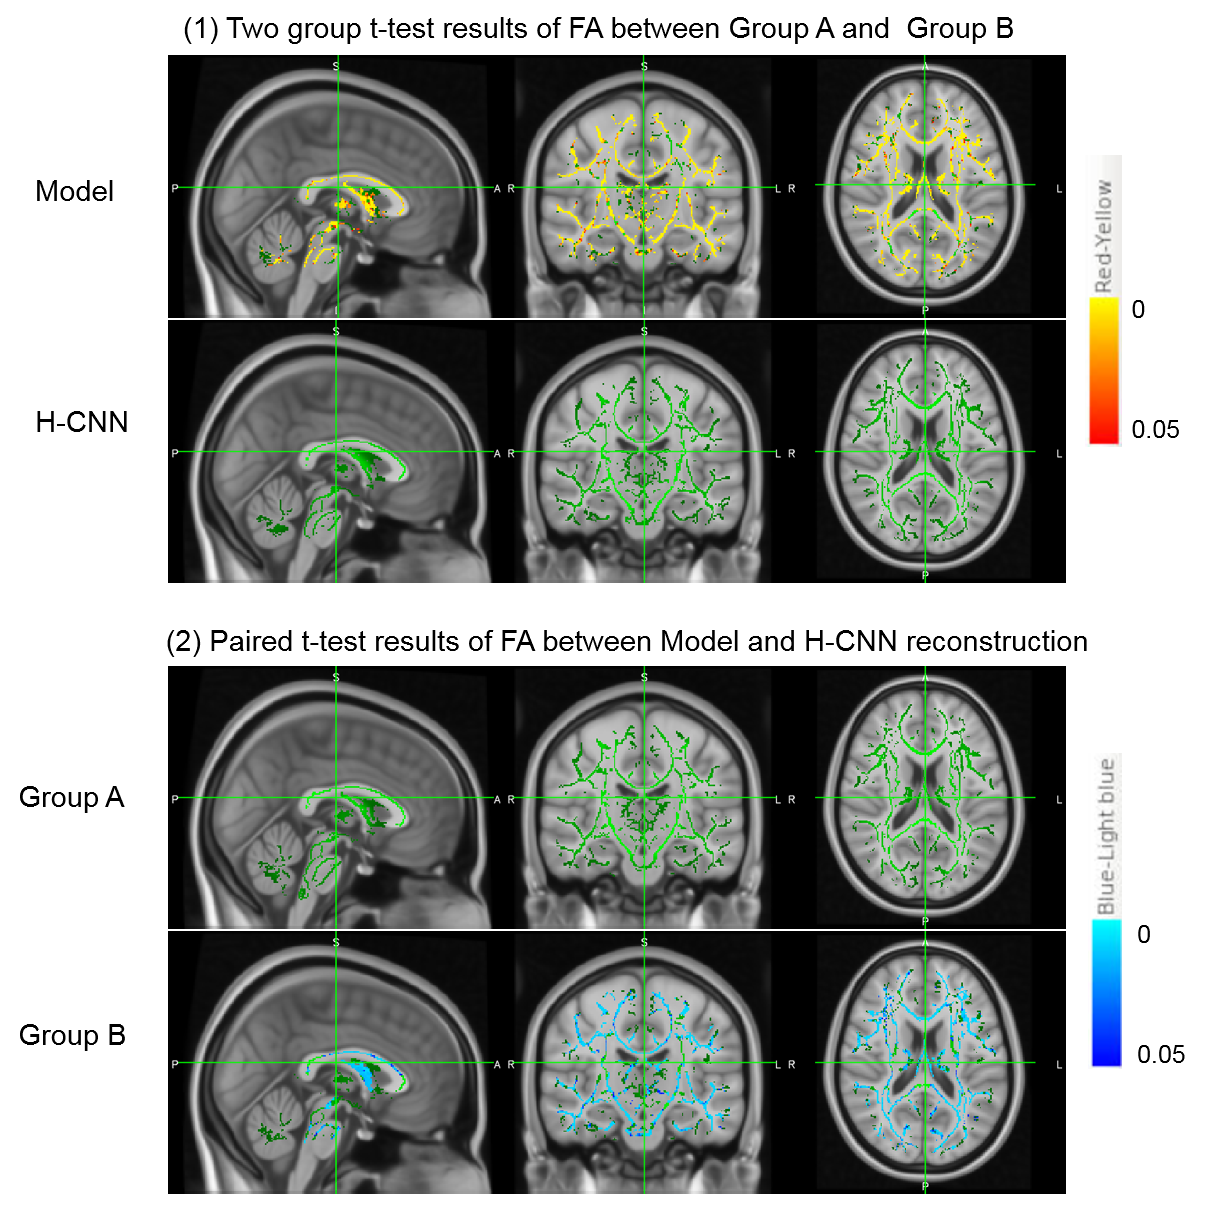
To quantify head motion for each subject, the five motion measures were respectively averaged across all DWI volumes, and a total motion index (TMI)1 is calculated to integrate all motion measures into one motion score, allowing a head motion ranking in a group. The 18 subjects were divided into control Group A with small motion and large motion Group B according to its TMI. Voxel-wise statistical analysis of the FA data was carried out using Tract-Based Spatial Statistics (TBSS)8 with threshold-free cluster enhancement.9 False discovery rate was used to correct for multiple comparisons with p = 0.05 as threshold for significance.
Results
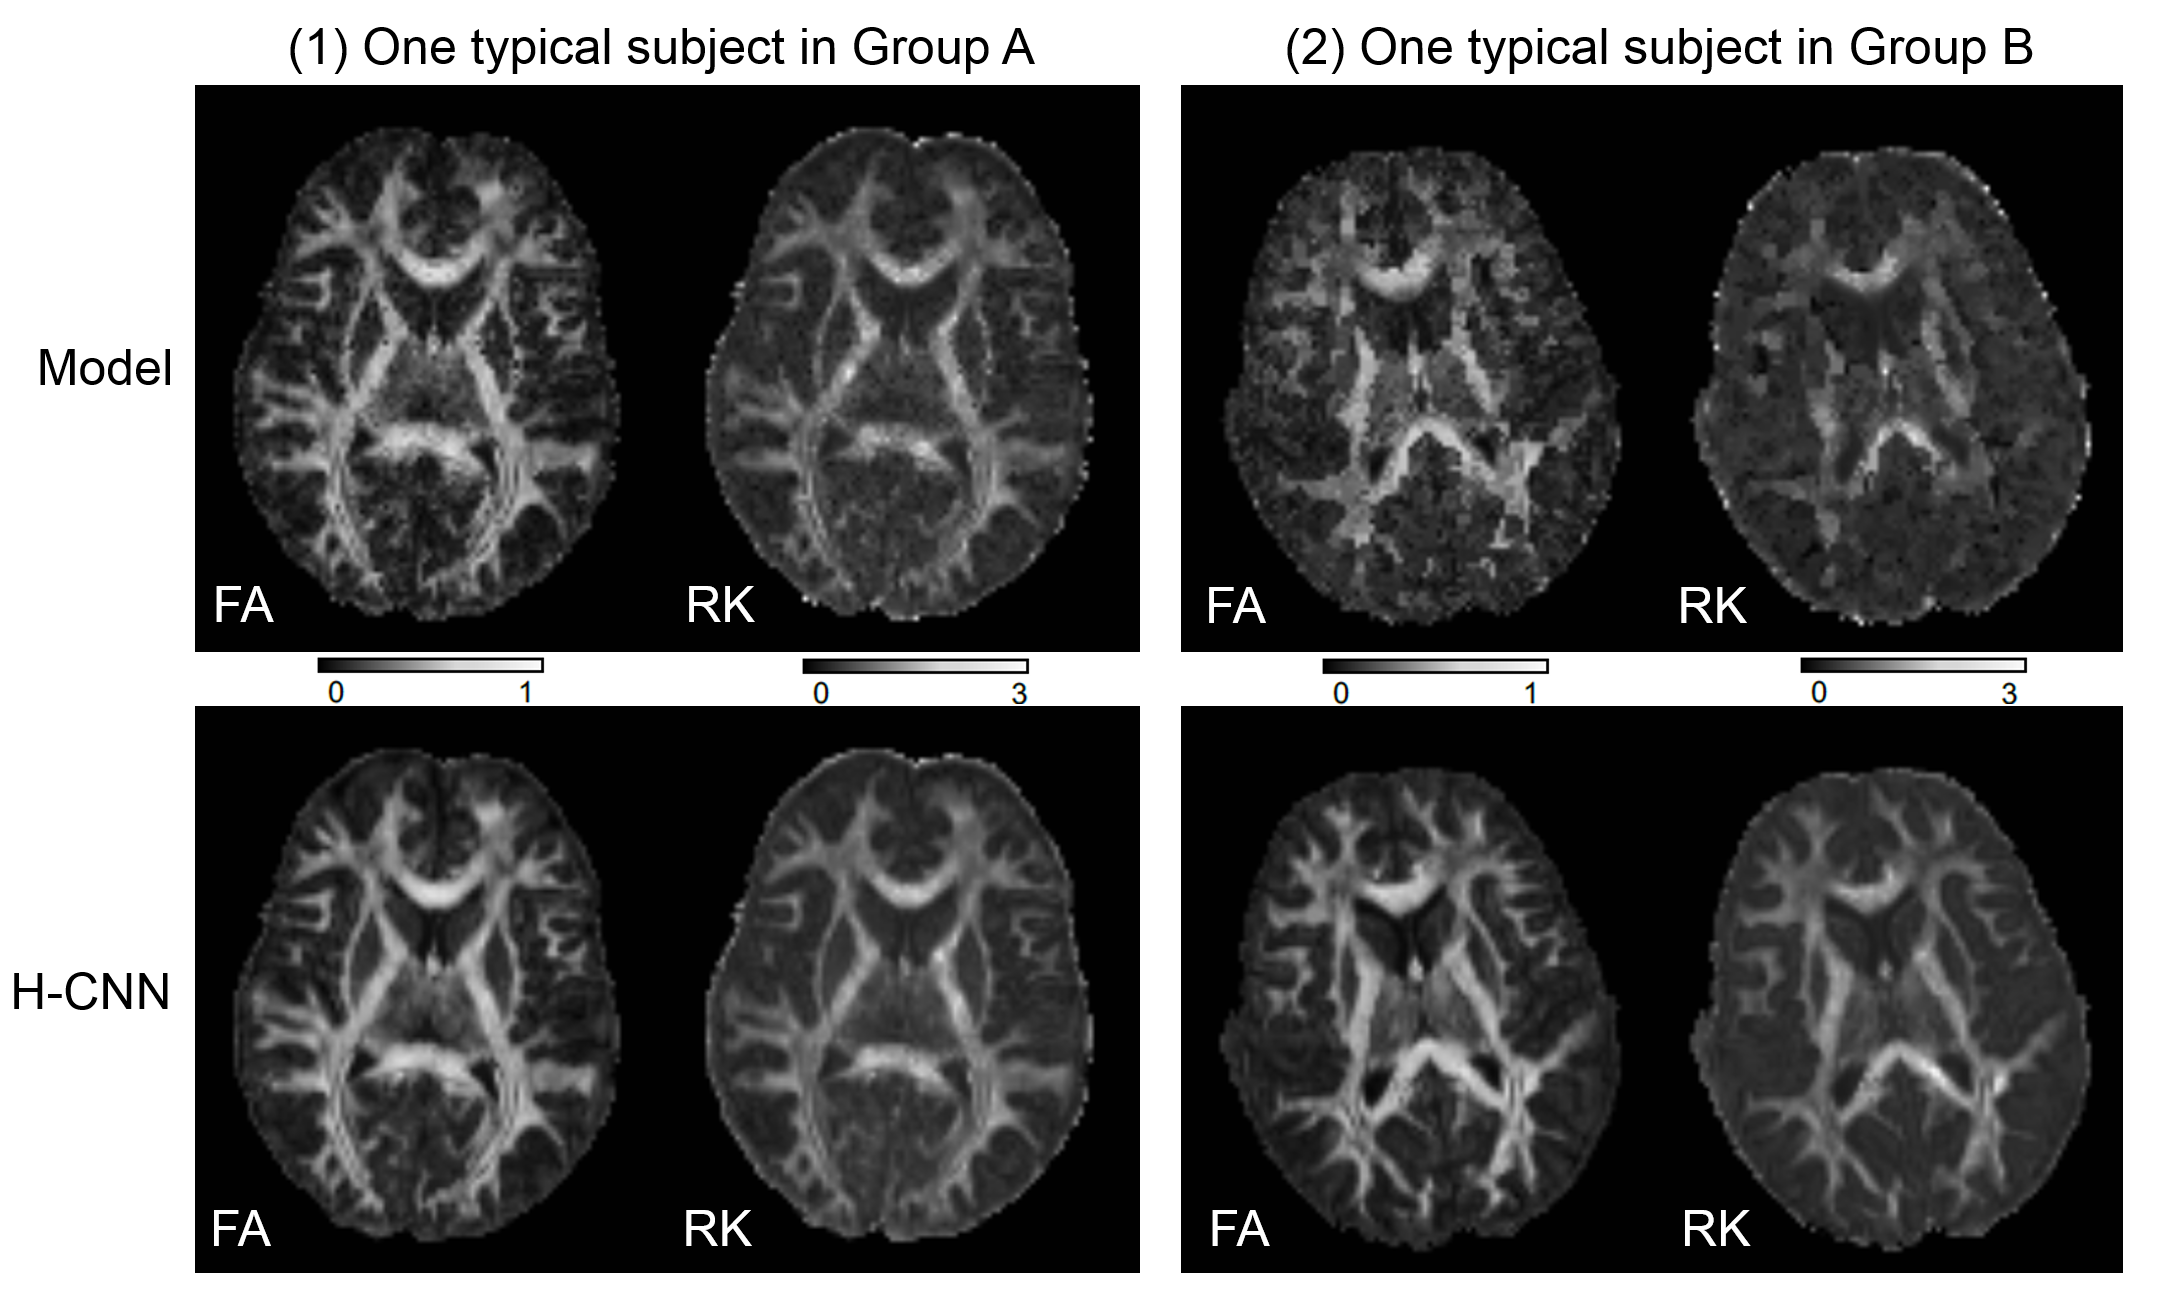
The motion assessment results of each subject ranking by TMI are depicted in Figure 1, and model and H-CNN reconstruction results for typical subjects are shown in Figure 2. For subjects with large motion, H-CNN achieved good results after rejecting a large number of volumes while it is blurry for the model reconstruction. The TBSS results of several group combinations are shown in Figure 3. In comparison between control Group A and Group B with large motion, the model-reconstructed FA from Group B showed 71% significantly lower voxels than control group. This is in line with previous study that motion tends to decrease FA.1 However for H-CNN method, no significant differences were found. To further investigate the difference between model and H-CNN reconstruction, paired t-tests between the two methods were performed. For the control Group A, there was no significant difference found. However for the motion group, 60.58% of the voxels for the model were significantly lower than that with the H-CNN method. These results imply that when motion deteriorates model fitting, the H-CNN suffers little from the motion effect after rejecting motion-corrupted volumes.Discussion
Differences in level of head motion can introduce spurious group differences for conventional model fitting method. Both abandoning data with large motion and including motion as a nuisance regressor are compromised solutions. The H-CNN method has shown its statistic power in robust parametric mapping for groups of subjects with different motion level. Further experiments with larger dataset and a comparison to introducing nuisance regressor should be conducted in future studies.Conclusion
Our H-CNN method shows ability in handling motion-contaminated data with good statistic power, by rejecting volumes with large motion. This method could achieve increased utilization of valuable data from less cooperative subjects such as certain motion-prone patients and children.Acknowledgements
We would like to acknowledge the support from National Key R&D Program of China (2017YFC0909200), NSFC (81871428, 91632109) and Shanghai Key Laboratory of Psychotic Disorders(13dz2260500).References
1. Yendiki A, Koldewyn K, Kakunoori S, et al. Spurious group differences due to head motion in a diffusion MRI study. NeuroImage, 2014: 79-90.
2. Gong T, He H, Lin Z, et al. Robust diffusion parametric mapping of motion-corrupted data using a deep-learning-based method. In: Joint Annual Meeting ISMRM-ESMRMB. Paris, France; 2018:6-8.
3. Alexander L, Escalera J, Ai L, et al. An open resource for transdiagnostic research in pediatric mental health and learning disorders. Scientific Data, 2017.
4. Andersson J L, Sotiropoulos S N. An integrated approach to correction for off-resonance effects and subject movement in diffusion MR imaging. NeuroImage, 2016: 1063-1078.
5. Andersson J L, Graham M S, Zsoldos E, et al. Incorporating outlier detection and replacement into a non-parametric framework for movement and distortion correction of diffusion MR images. NeuroImage, 2016: 556-572.
6. Tabesh A, Jensen J H, Ardekani B A, et al. Estimation of tensors and tensor-derived measures in diffusional kurtosis imaging. Magnetic Resonance in Medicine, 2011, 65(3): 823-836.
7. Chen Y, Tymofiyeva O, Hess C P, et al. Effects of rejecting diffusion directions on tensor-derived parameters[J]. NeuroImage, 2015: 160-170.
8. Smith S M, Jenkinson M, Johansenberg H, et al. Tract-based spatial statistics: Voxelwise analysis of multi-subject diffusion data. NeuroImage, 2006, 31(4): 1487-1505.
9. Smith S M, Nichols T E. Threshold-free cluster enhancement: addressing problems of smoothing, threshold dependence and localisation in cluster inference. NeuroImage, 2009, 44(1): 83-98.
Figures