2703
Effect of fitting models and its error analysis in GRE based MWI1Electrical & Electronic Engineering, Yonsei university, Seoul, Korea, Republic of
Synopsis
The MWF fitting through the GRE sequence was performed in various models to determine which model is effective. Models such as magnitude 2-, 3-pool, complex 2-, and 3-pool modeling were used.
Introduction
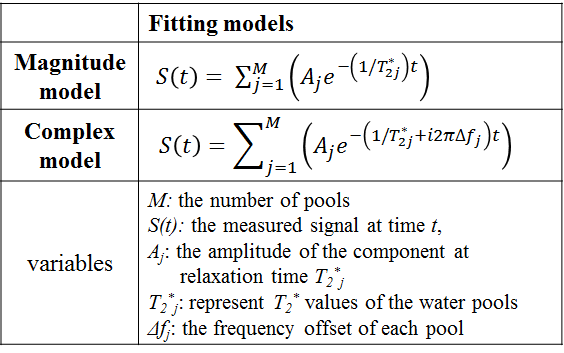
Myelin water fraction (MWF) data using multi-echo GRE (mGRE) is has been fit to several different models over the past.1-3 It is generally agreed that the T2* relaxation data can lead to the identification of multiple components (e.g. short and long T2*).4 Therefore, fitting with an appropriate model is necessary. In this study, we aimed at investigating the effects of GRE based MWF using different modeling. Both simulation data and in-vivo data were used for estimating MWF using four different methods; magnitude 2-, 3-pool, complex 2-, 3-pool modeling.Method
[Simulation]
Synthetic signals were generated to have similar T2* decay signals in white matter regions with different model types; magnitude 2-, 3-pool and complex 2-,3-pool model. The complex Gaussian noise was added to have various SNR (50, 100, 300, 500). Simulations were carried out with 1ms first TE, 1ms echo spacing, and 40 number of echoes.
[Data acquisition]
In-vivo data were acquired on a 3 Tesla MRI scanner (Tim Trio, Siemens Medical Solution, Erlangen, Germany) using a 12-channel head coil for signal reception. 3D mGRE data was acquired for MWF mapping. The imaging parameters were as follows: TR = 120ms, first TE = 1.6 ms, echo spacing = 1 ms, number of echoes = 30, flip angle = 20°, field of view = 256 × 256 × 144 mm3, spatial resolution = 2 × 2 × 3 mm3.
[Data Processing]
In both simulation and in-vivo data, four different fitting models (magnitude 2-, 3-pool, complex 2-, 3-pool) were used and analyzed in this study. In the in-vivo case, a mono-pool model was applied additionally to compare the residual errors.
Results and Discussion
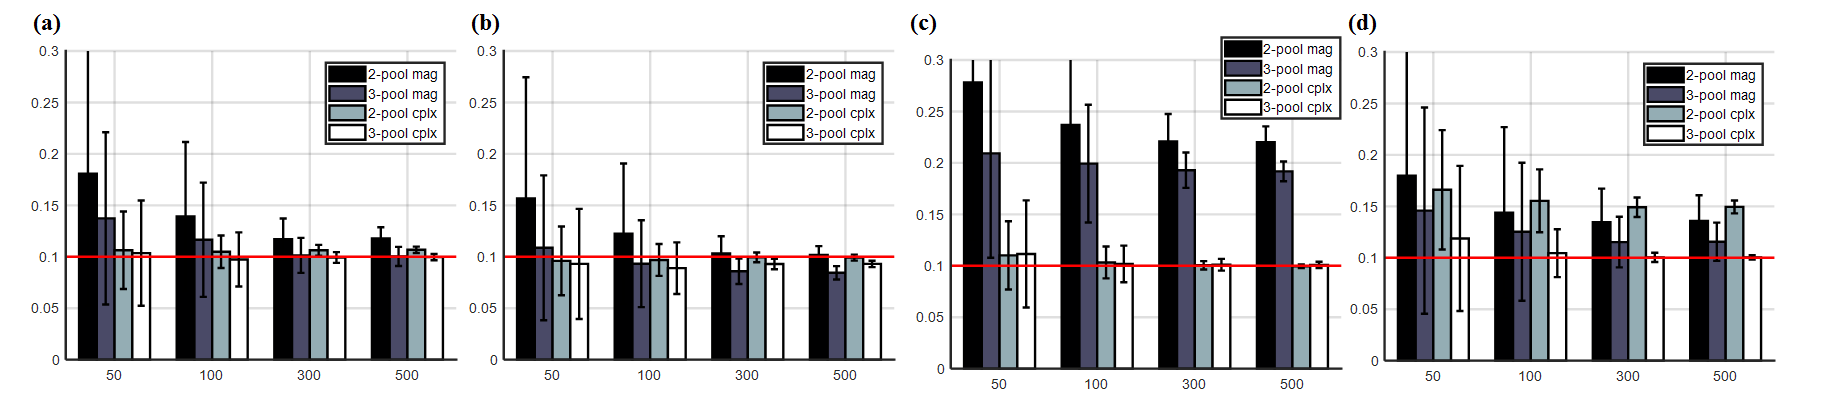
[simulation]
Figure 1 shows the results of the simulation. When using the three-pool modeling, the estimated MWF were more accurate regardless of the method used for synthetic signal generation. When using the 2-pool model, the MWF values were higher than when using the 3-pool model. The reason might be that the components of intermediate T2* are interpreted as short T2* during the minimization. The complex model has more parameters than the magnitude model, but the standard deviation of MWF was smaller than magnitude model. This is because the complex fitting uses twice as much information (i.e., magnitude and phase). In real situations, the model is not a discrete spectrum but a continuous spectrum. Thus, a more realistic simulation is needed. However, the 3-pool model still performs better than the 2-pool model in terms of the residual map.
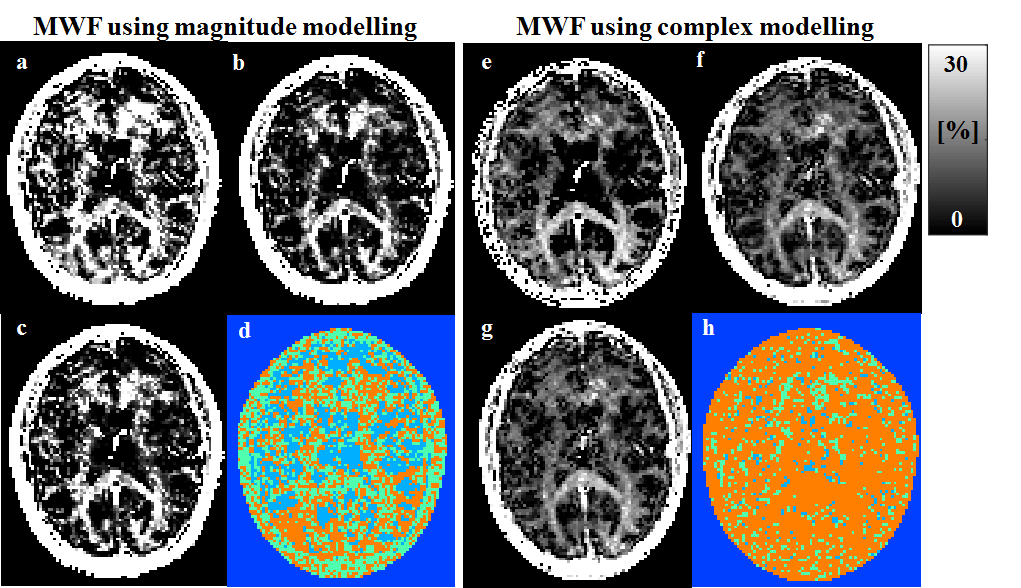
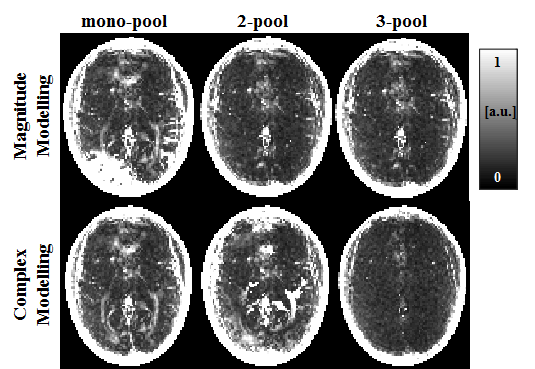
[In-vivo experiments]
Figure 2 shows the in-vivo MWF using different fitting models. The MWF using 2-pool model has higher values than using the 3-pool model in both magnitude and complex model similar to the simulation results. Figure 3 shows the fitting residual maps. It also shows that complex 3-pool model is a more effective modeling in the white matter because the residual is the lowest compared others. Overall, 2-pool and 3-pool model show low residual values in myelin. An optimal MWF map, generated by choosing the MWF according to the model with smaller residual, is shown in Fig. 2c. Compared to two pool MWF(Fig. 2a) and three pool MWF(Fig. 2b), it seems to reduce 2-pool noise and boost 3-pool signal strength. The complex optimal fitting map (Fig. 2h) represents the superiority of the three pools, so the optimal MWF (Fig. 2g) is similar to that of the 3-pool complex model(Fig. 2f). And then comparing magnitude MWF with complex MWF, complex MWF seems to better represent the myelin water fraction from the overall point of view, apart from the partial signal strength.
Conclusion
In conclusion, the simulation results indicate that 3-pool shows more accurate MWF value than 2-pool and complex model shows a smaller standard deviation than the magnitude model. In real in-vivo experiments, the 3-pool complex model has the lowest residual value and the best accuracy in the optimal MWF map.
Acknowledgements
No acknowledgement found.References
1. Du YP, et al. Fast multislice mapping of the myelin water fraction using multicompartment analysis of T2* decay at 3T: A preliminary postmortem study. MRM, 2007;58(5):865-870.
2. Hwang D, et al. In vivo multi-slice mapping of myelin water content using T2* decay. NeuroImage, 2010;52(1):198-204.
3. Nam Y, et al. Improved estimation of myelin water fraction using complex model fitting. NueroImage, 2015;116:214-221
4. Mackay A, et al. In vivo visualization of myelin water in brain by magnetic resonance. MRM 1994;31:673-677
Figures