2700
Evaluation of Compressed SENSE in Quantitative Susceptibility Mapping1Department of Radiology, Mie University Hospital, Tsu, Mie, Japan, 2Department of Radiology, Mie University School of Medicine, Tsu, Mie, Japan, 3MR Clinical Science, Philips Japan, Tokyo, Japan, 4Department of Advanced Diagnostic Imaging, Mie University School of Medicine, Tsu, Japan
Synopsis
Quantitative Susceptibility Mapping (QSM) is reportedly useful for the early diagnosis of Parkinson’s disease. However, the imaging time for QSM is very long because of the additional acquisition of 3D FFE; compressed SENSE (C-SENSE) could resolve this problem. The susceptibility values of the putamen, globus pallidus, caudate nucleus, substantia nigra, and nucleus ruber in seven healthy volunteers were measured as well as evaluated using SENSE and C-SENSE QSM. The results suggest that good reproducibility and validity for C-SENSE QSM can be obtained when high factors are used. C-SENSE QSM can reduce acquisition time, and is therefore expected to be widely used in the clinical setting.
Introduction
Quantitative Susceptibility Mapping (QSM) is reportedly useful for the early diagnosis of Parkinson’s disease. However, the imaging time for QSM is very long because of the additional acquisition of 3D FFE; compressed SENSE (C-SENSE) could resolve this problem.Purpose
The aim of the present study was to evaluate the feasibility of C-SENSE for QSM in healthy volunteers.
Materials and Method
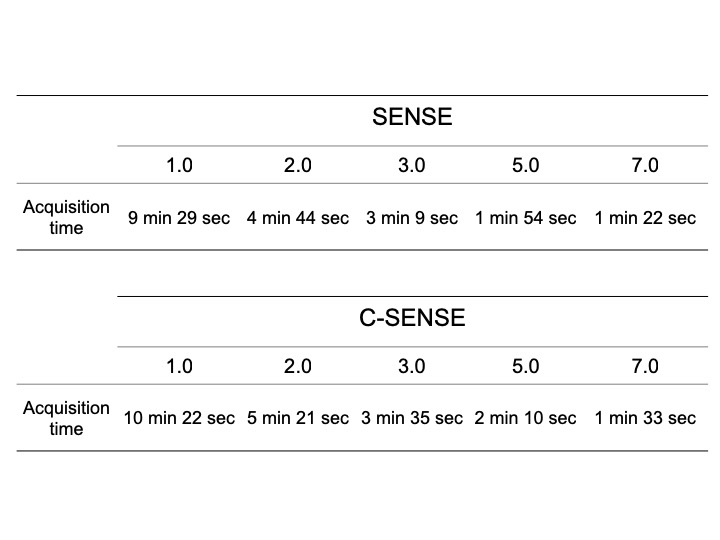
We studied seven healthy volunteers (aged 32 ± 6.6 years). In this study, we used a 3T MRI (Ingenia, PhilipsHealthcare, Best, the Netherlands) with a dS HeadNeck-Spine coil. For QSM, the 3D FFE parameters were as follows: TR/TE = 23/21, number of excitations = 36, flip angle = 20º, matrix = 320 × 256, field of view (FOV) = 230 mm, thickness = 1.6 mm, voxel size = 0.45 × 0.45 × 0.80 mm. The acquisition times are shown in Table 1. The 3D FFE data were transferred to a personal computer for processing, and QSM analysis was performed using research software [1]. QSM was produced by changing the SENSE factor and C-SENSE factor (factor: 1.0, 2.0, 3.0, 5.0, and 7.0). Susceptibility values were measured for each designated area (globus pallidus: GP, putamen: Pt, nucleus ruber: NR, caudate nucleus: CN, substantia nigra: SN) from the obtained QSM. Regarding the data analyses susceptibility values were independently measured by two experienced technologists. Analyses of data obtained for susceptibility value measurement included assessment of inter-rater and intra-rater reproducibility and assessment of validity. Intraclass correlation coefficients (ICC) and Bland–Altman analysis were used for the statistical analyses.Results
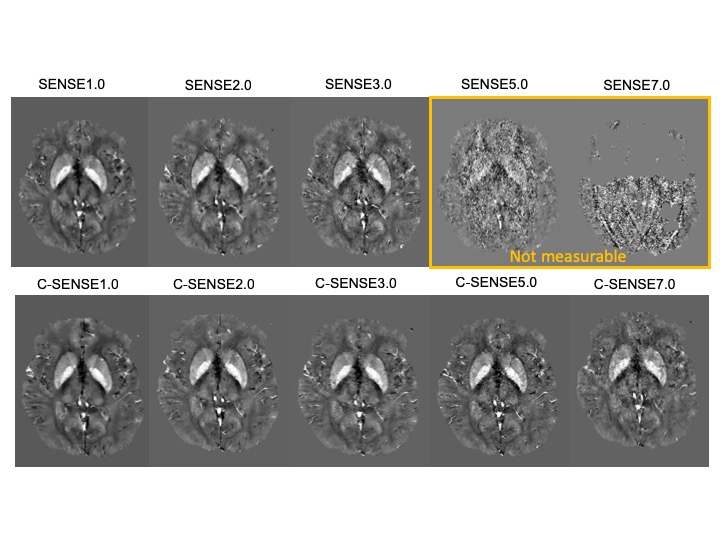
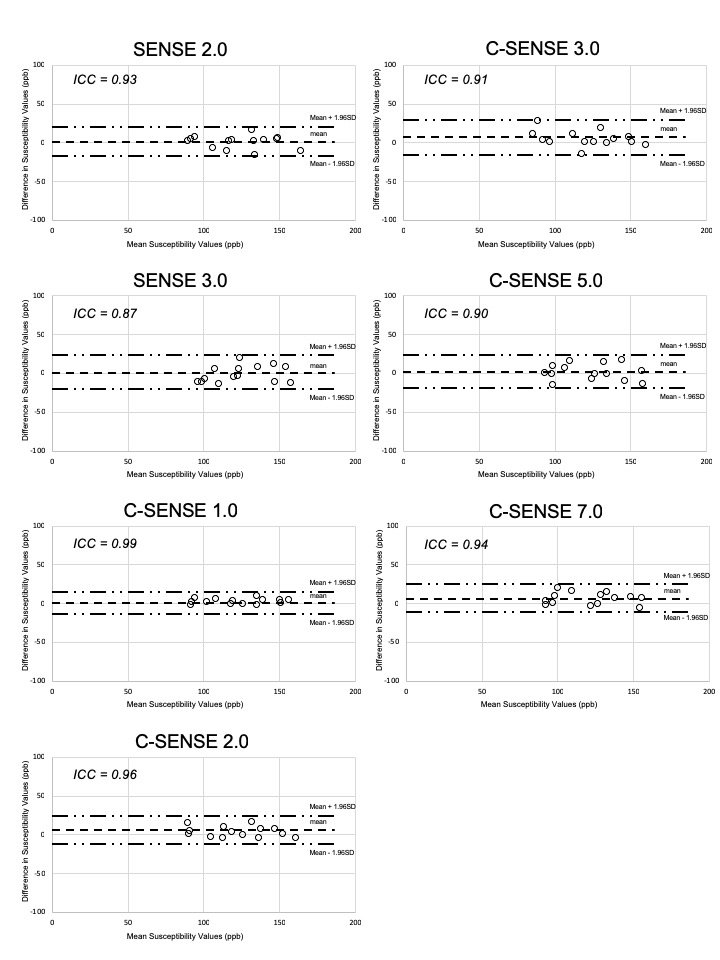
QSM images of SENSE and C-SENSE are shown in Fig. 1. Using SENSE, it was difficult to visually identify the designated areas in QSM images using factor 5.0 and 7.0, which meant we could not measure the susceptibility values (Fig. 1). The reproducibility of each reduction factor in each area showed an intra-rater ICC of 0.75–0.97 and inter-rater ICC of 0.77–0.97. Thus, both the intra- and inter-rater reproducibility were good. Each reduction factor showed an ICC ranging from 0.68–0.99, indicating generally good agreement with the SENSE 1.0 results in terms of the susceptibility values (Fig. 2). Thus, we found good validity for both SENSE 1.0 and each reduction factor.
Conclusion
C-SENSE QSM is feasible when using high factors. C-SENSE QSM can sufficiently reduce the acquisition time (e.g. 3 min 9 s to 1 min 33 s), and is therefore expected to be widely used in the clinical setting.Acknowledgements
The authors wish to thank Dr. Tetsuhiko Takahashi and Mr. Yoshihiro Iwata (Hitachi, Ltd., Healthcare Business Unit) for technical support and provision of QSM software.References
- Shirai T, et al. Quantitative Susceptibility Mapping Using Adaptive Edge-Preserving Filtering. In Proceedings of 23rdannual meeting of International Society Magnetic Resonance in Medicine Toronto, Ontario, Canada. 2015; 23: p3319
Figures