2699
Along-tract statistics of NODDI diffusion metrics to enhance MR tractography quantitative analysis in healthy controls and in patients with glioma1Neuroradiology Unit and CERMAC, Vita-Salute San Raffaele University and IRCCS San Raffaele Scientific Institute, Milan, Italy, 2Department of Medical Biotechnology and Translational Medicine, Università degli Studi di Milano, Milan, Italy, 3Unit of Oncological Neurosurgery, Humanitas Research Hospital, Rozzano (MI), Italy
Synopsis
Along-tract statistical extraction of quantitative diffusion metrics is crucial to unravel the variability of these parameters within white matter fiber bundles. Here for the first time we extracted NODDI-derived microstructural diffusion estimates along the main eloquent fiber tracts in fifteen healthy subjects and in a pilot cohort of glioma patients. We constructed a robust reference database of normative along-tract microstructural values to describe the anatomical variability of NODDI metrics within tracts and to localize and quantify differences in pathological cases. Normal and pathological conditions can be statistically compared between-groups, as well as at the single-subject level.
INTRODUCTION
Diffusion MR Tractography allows to virtually dissect white matter fibers within human brain in normal and pathological conditions. Novel techniques have been proposed to measure diffusion MRI(dMRI) data along white matter tracts, effectively quantifying within-tract statistical variability of ‘classical’ Diffusion Tensor Imaging (DTI)-derived metrics, such as mean, axial and radial diffusivities (MD,AD,RD) and fractional anisotropy (FA)1-4.
Neurite orientation dispersion and density imaging (NODDI) enables a more specific characterization of microstructure with respect to classical DTI metrics, by estimating the relative contribution of different diffusion compartments to the total diffusion signal in each voxel and providing a quantification of neurite density and orientation dispersion, two key contributors to FA5.
Here we propose a novel along-tract quantitative analysis of NODDI-derived metrics within seven eloquent white matter tracts, aiming at combining the specificity of NODDI and the ability of along-tract approach to analyse the microstructural tract variability in healthy volunteers and glioma patients.
METHODS
Fifteen controls (mean age 38yo; 9M/6F) were examined on a 3T Ingenia CX Philips MR scanner (32-channel head coil). dMRI data were collected using simultaneous multislice EPI acquisition with two shells: b=711s/mm2(35 directions) and b=3000s/mm2(60 directions). 60 slices with isotropic voxels of 2mm3(TR/TE=5977/78ms; Multiband factor=2; SENSE=2) and 12 b=0 images were obtained, one with reversed phase-encoding to estimate susceptibility induced distortions. The same dMRI protocol was applied to seven glioma patients.
dMRI data pre-processing included the correction of susceptibility-induced and of eddy current-induced distortions and head motions (‘topup’ and ‘eddy’ tools of FMRIB Software Library, respectively). Diffusion tensors were estimated from each shell of the corrected dMRI data, and diffusivity (MD,AD,RD) and FA maps were derived. The NODDI model was fitted to the data to extract voxel fraction of non-Gaussian anisotropic diffusion (neurite density:FICV), fraction of Gaussian anisotropic diffusion (extra-cellular volume fraction:FECV), orientation dispersion index (ODI) and fraction of isotropic Gaussian diffusion (FISO) maps5. HARDI Tractography was based on a q-ball residual bootstrap algorithm, as previously described6. For every subject, bilateral Corticospinal tracts(CST), Cinguli(CING), Optic radiations(OR), Arcuate fasciculi(AF), frontal Aslant tracts(FAT), Inferior fronto-occipital fasciculi(IFOF) and Uncinate fasciculi(UF) were reconstructed.
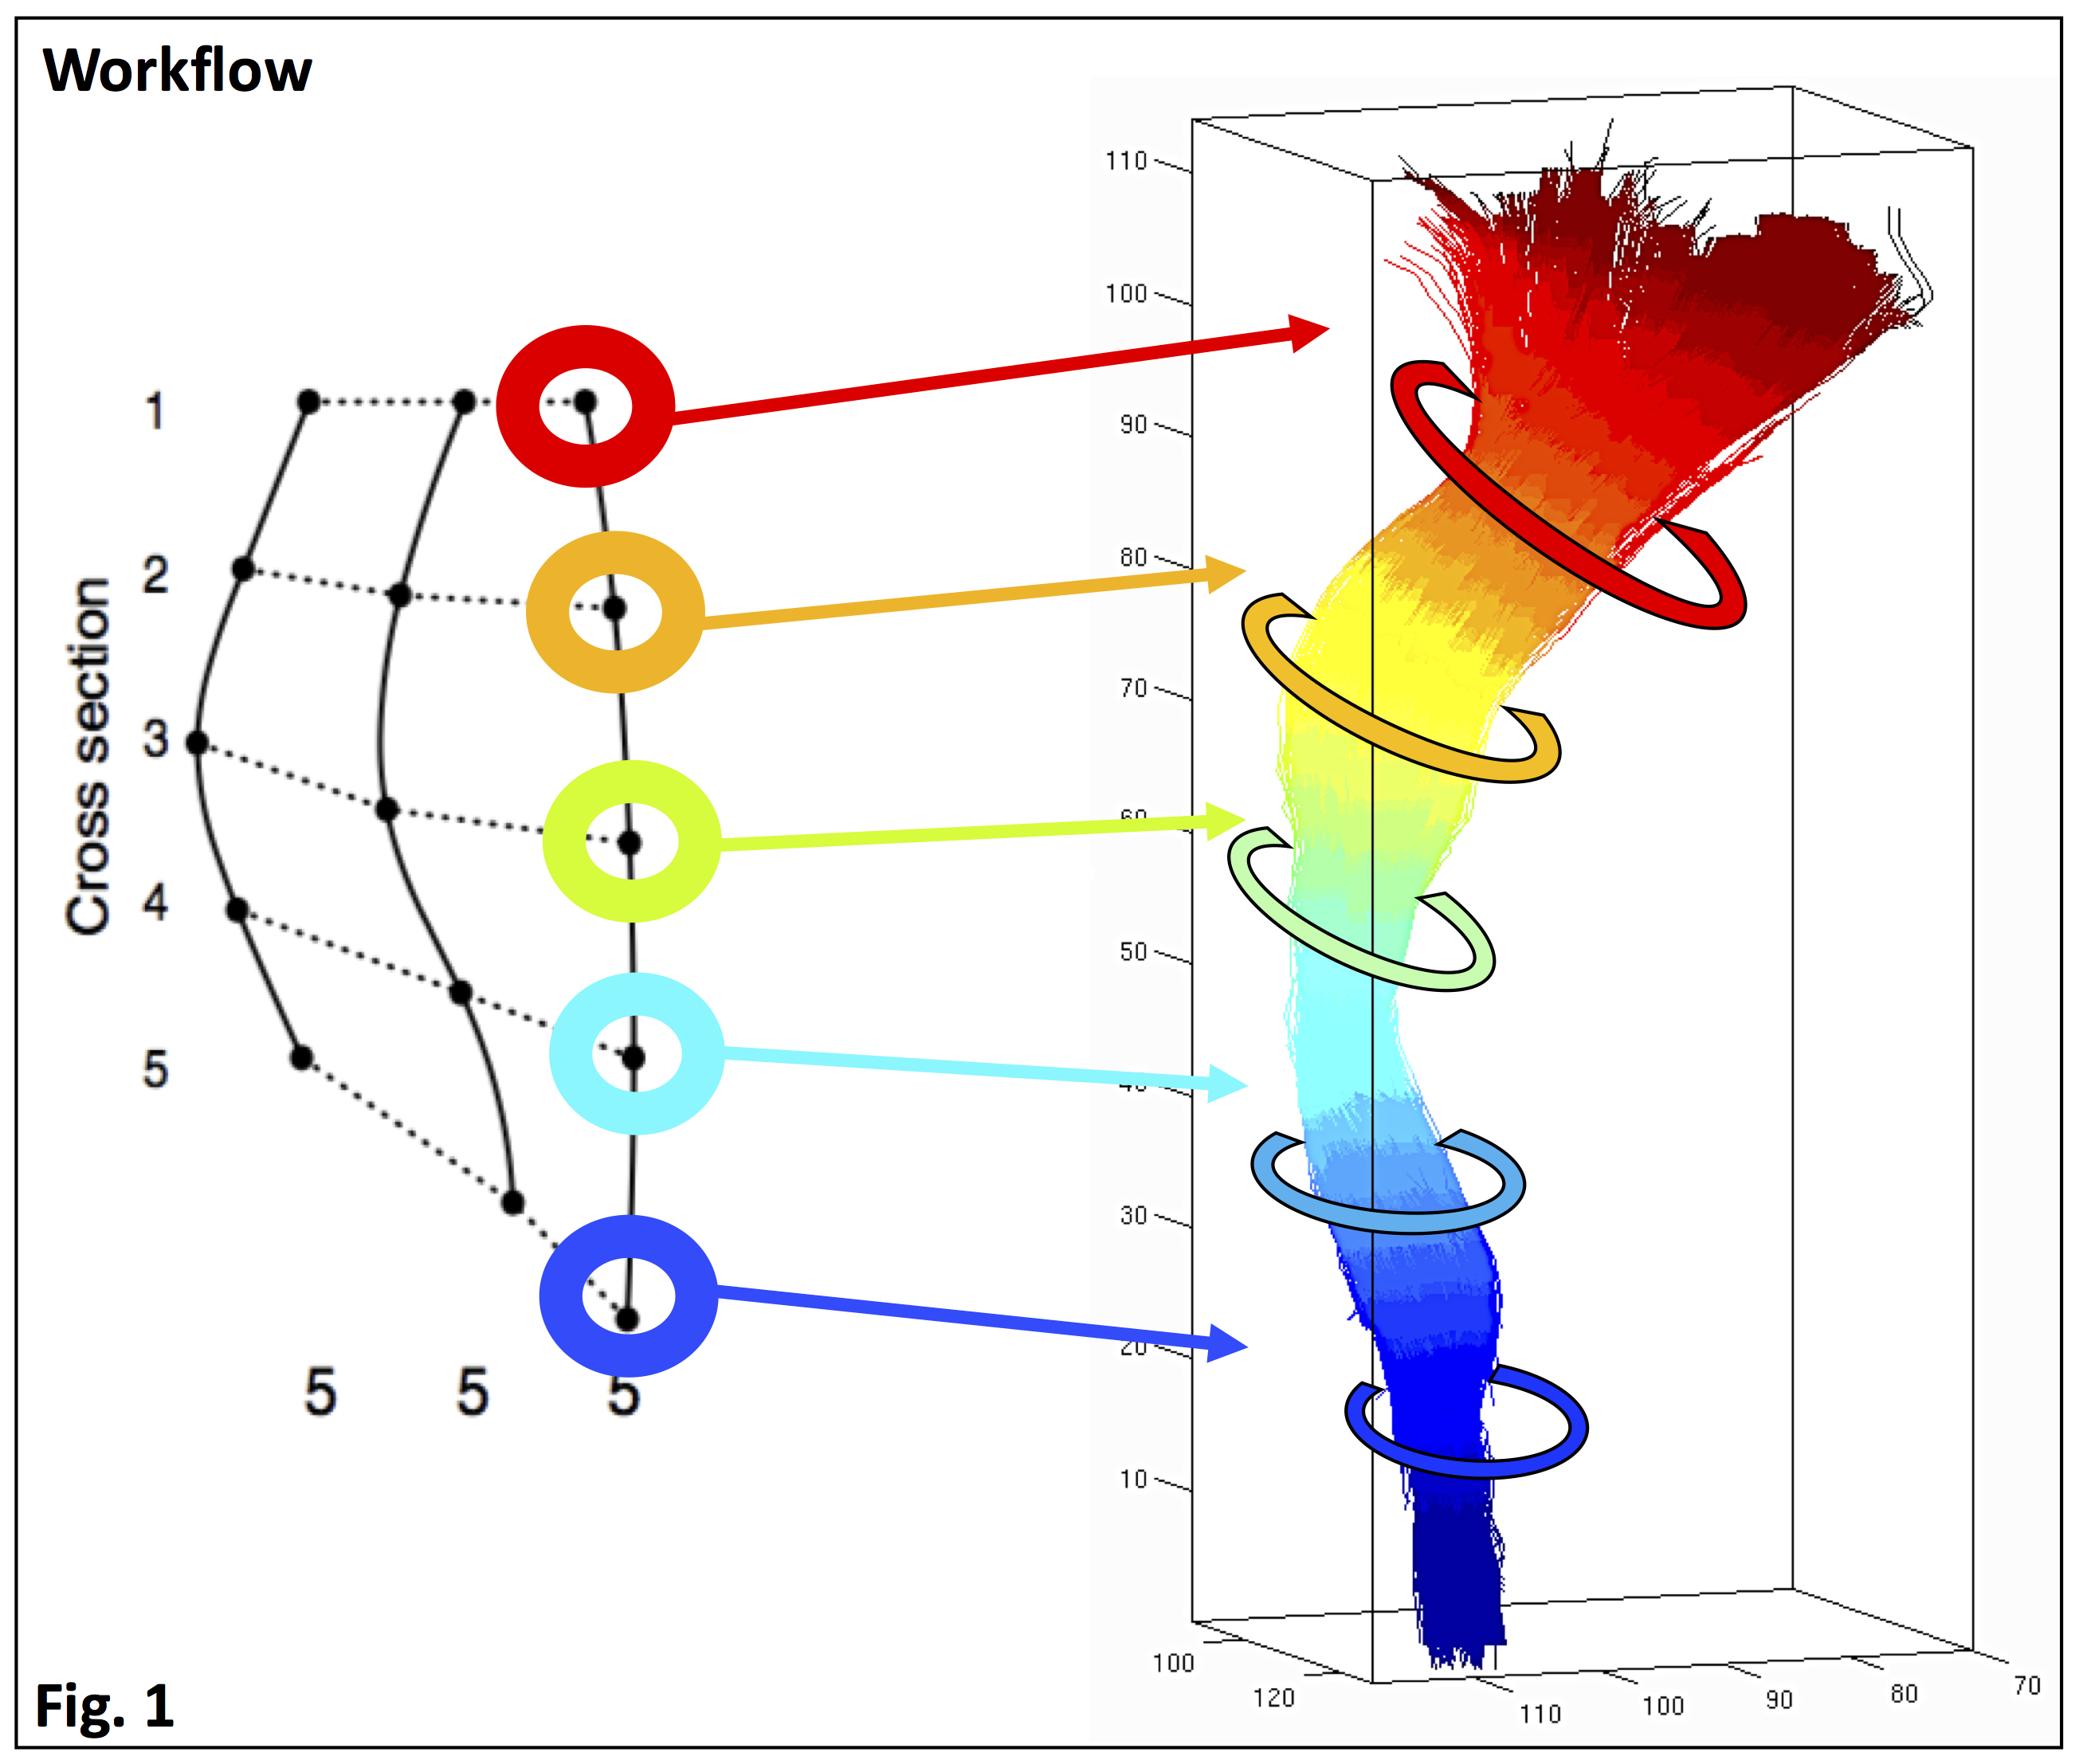
For each tract of each subject, raw streamlines were reoriented according to a common origin, re-parameterized using cubic B-spline curves and then resampled into one-hundred vertices spread evenly along their lengths. Correspondence between nearest points across the tract transverse sections was matched and a skeleton of each tract was obtained3. Then, NODDI and DTI maps were resampled at the new sets of streamline vertices and diffusion metrics were finally collapsed at each analogous group of vertices to obtain average diffusion metrics at multiple locations along tracts [Fig.1]. After extracting all the diffusion metrics along every tract for every subject, a group analysis was performed in healthy controls2, and average values and 95%CI were displayed in line graphs.
RESULTS
For every healthy control, along-tract DTI and NODDI values of all the reconstructed bundles were obtained, and reference curves were consistently derived by averaging individual diffusion metrics extracted from 12 subject-specific maps (FICV, FECV, FISO, ODI, and FA, MD, AD and RD at b=711 and b=3000s/mm2). These curves describe the normal anatomical variability of microstructural metrics.
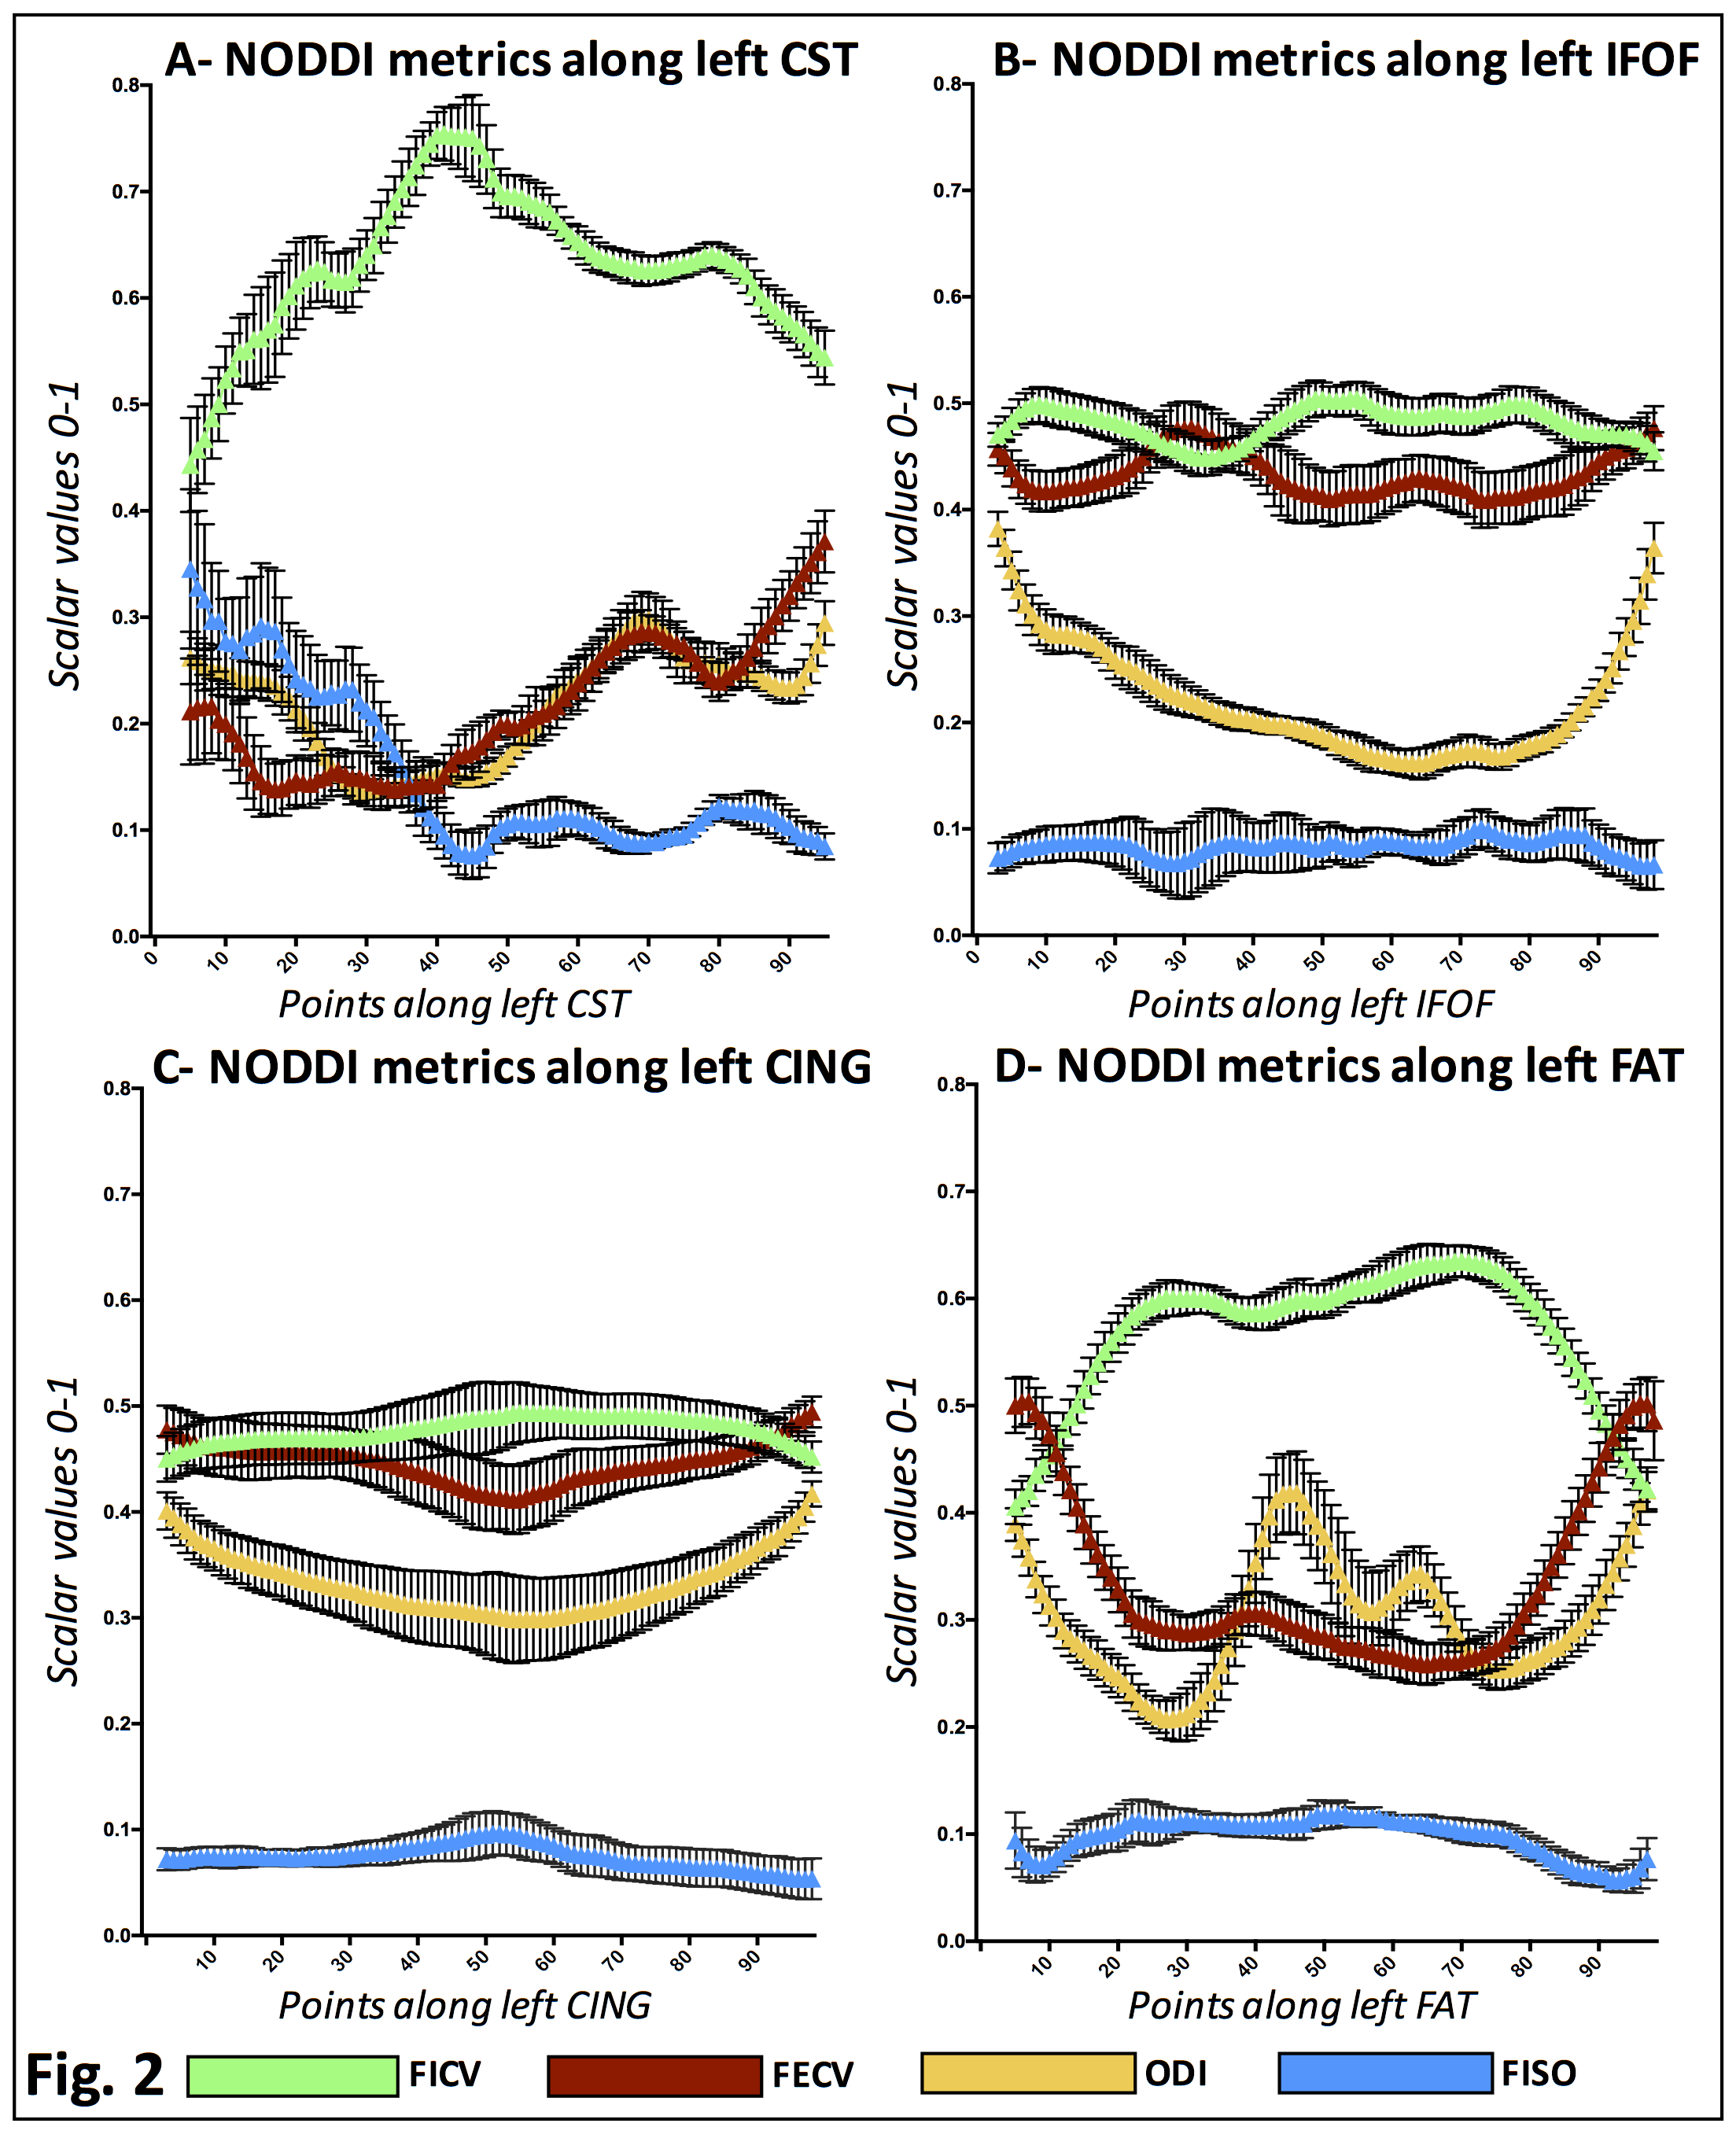
Remarkably, the computation of along-tract NODDI-derived metrics reliably segregates signals arising from the intraneurite, extraneurite and free CSF compartments for the entire trajectory of the fibers. Along healthy fascicles, free water is almost absent and the highest density of neurites is mirrored by the lowest extracellular volume fraction [Fig.2 and 3A]. Neurite density and orientation dispersion, the two key drivers for FA, were estimated individually along tracts. FA profiles show a strong inverse correlation to ODI and a weakly positive correlation with FICV [Fig.3B].
In glioma patients, we demonstrated the effectiveness of such an along-tract approach in an example analysis of tracts running nearby tumor margins. When compared to reference control curves, patient-specific along-tract analysis localizes and quantifies microstructural difference of pathological tracts with respect to normal ones [Fig.4].
DISCUSSION AND CONCLUSION
These preliminary data suggest that it is possible to extract dMRI microstructural metrics along the main white matter tracts, thus enhancing the specificity of quantitative tractography analysis both at a group and at a subject-specific level.
The along-tract approach incorporates the NODDI analysis into the structural and clinically relevant framework of the tract anatomy. Line graphs allow to effectively visualize average along-tract metrics at a glance, which could be potentially useful to identify subtle deviations of pathological tract quantitative profiles from the normative distribution of controls’ reference values.
The initial observations in glioma patients indicate a suitable method possibly providing quantitative ‘signatures’ of the microstructural changes of peritumoral tracts.
Acknowledgements
This work received funding from the European Union’s Horizon 2020 Research and Innovation Program EDEN2020 under Grant Agreement No. 688279.References
1. Yeatman JD, Richie-Halford A, Smith JK, Keshavan A, Rokem A. A browser-based tool for visualization and analysis of diffusion MRI data. Nat Commun 2018;9(1):940.
2. O'Donnell LJ, Westin CF, Golby AJ. Tract-based morphometry for white matter group analysis. Neuroimage 2009;45(3):832-844.
3. Colby JB, Soderberg L, Lebel C, Dinov ID, Thompson PM, Sowell ER. Along-tract statistics allow for enhanced tractography analysis. Neuroimage 2012;59(4):3227-3242.
4. Lin F, Yu C, Jiang T, Li K, Li X, Qin W, Sun H, Chan P. Quantitative analysis along the pyramidal tract by length-normalized parameterization based on diffusion tensor tractography: application to patients with relapsing neuromyelitis optica. Neuroimage 2006;33(1):154-160.
5. Zhang H, Schneider T, Wheeler-Kingshott CA, Alexander DC. NODDI: practical in vivo neurite orientation dispersion and density imaging of the human brain. Neuroimage 2012;61(4):1000-1016.
6. Caverzasi E, Hervey-Jumper SL, Jordan KM, Lobach IV, Li J, Panara V, Racine CA, Sankaranarayanan V, Amirbekian B, Papinutto N, Berger MS, Henry RG. Identifying preoperative language tracts and predicting postoperative functional recovery using HARDI q-ball fiber tractography in patients with gliomas. J Neurosurg 2016;125(1):33-45.
7. Caverzasi E, Papinutto N, Castellano A, Zhu AH, Scifo P, Riva M, Bello L, Falini A, Bharatha A, Henry RG. Neurite Orientation Dispersion and Density Imaging Color Maps to Characterize Brain Diffusion in Neurologic Disorders. J Neuroimaging 2016;26(5):494-498.
Figures
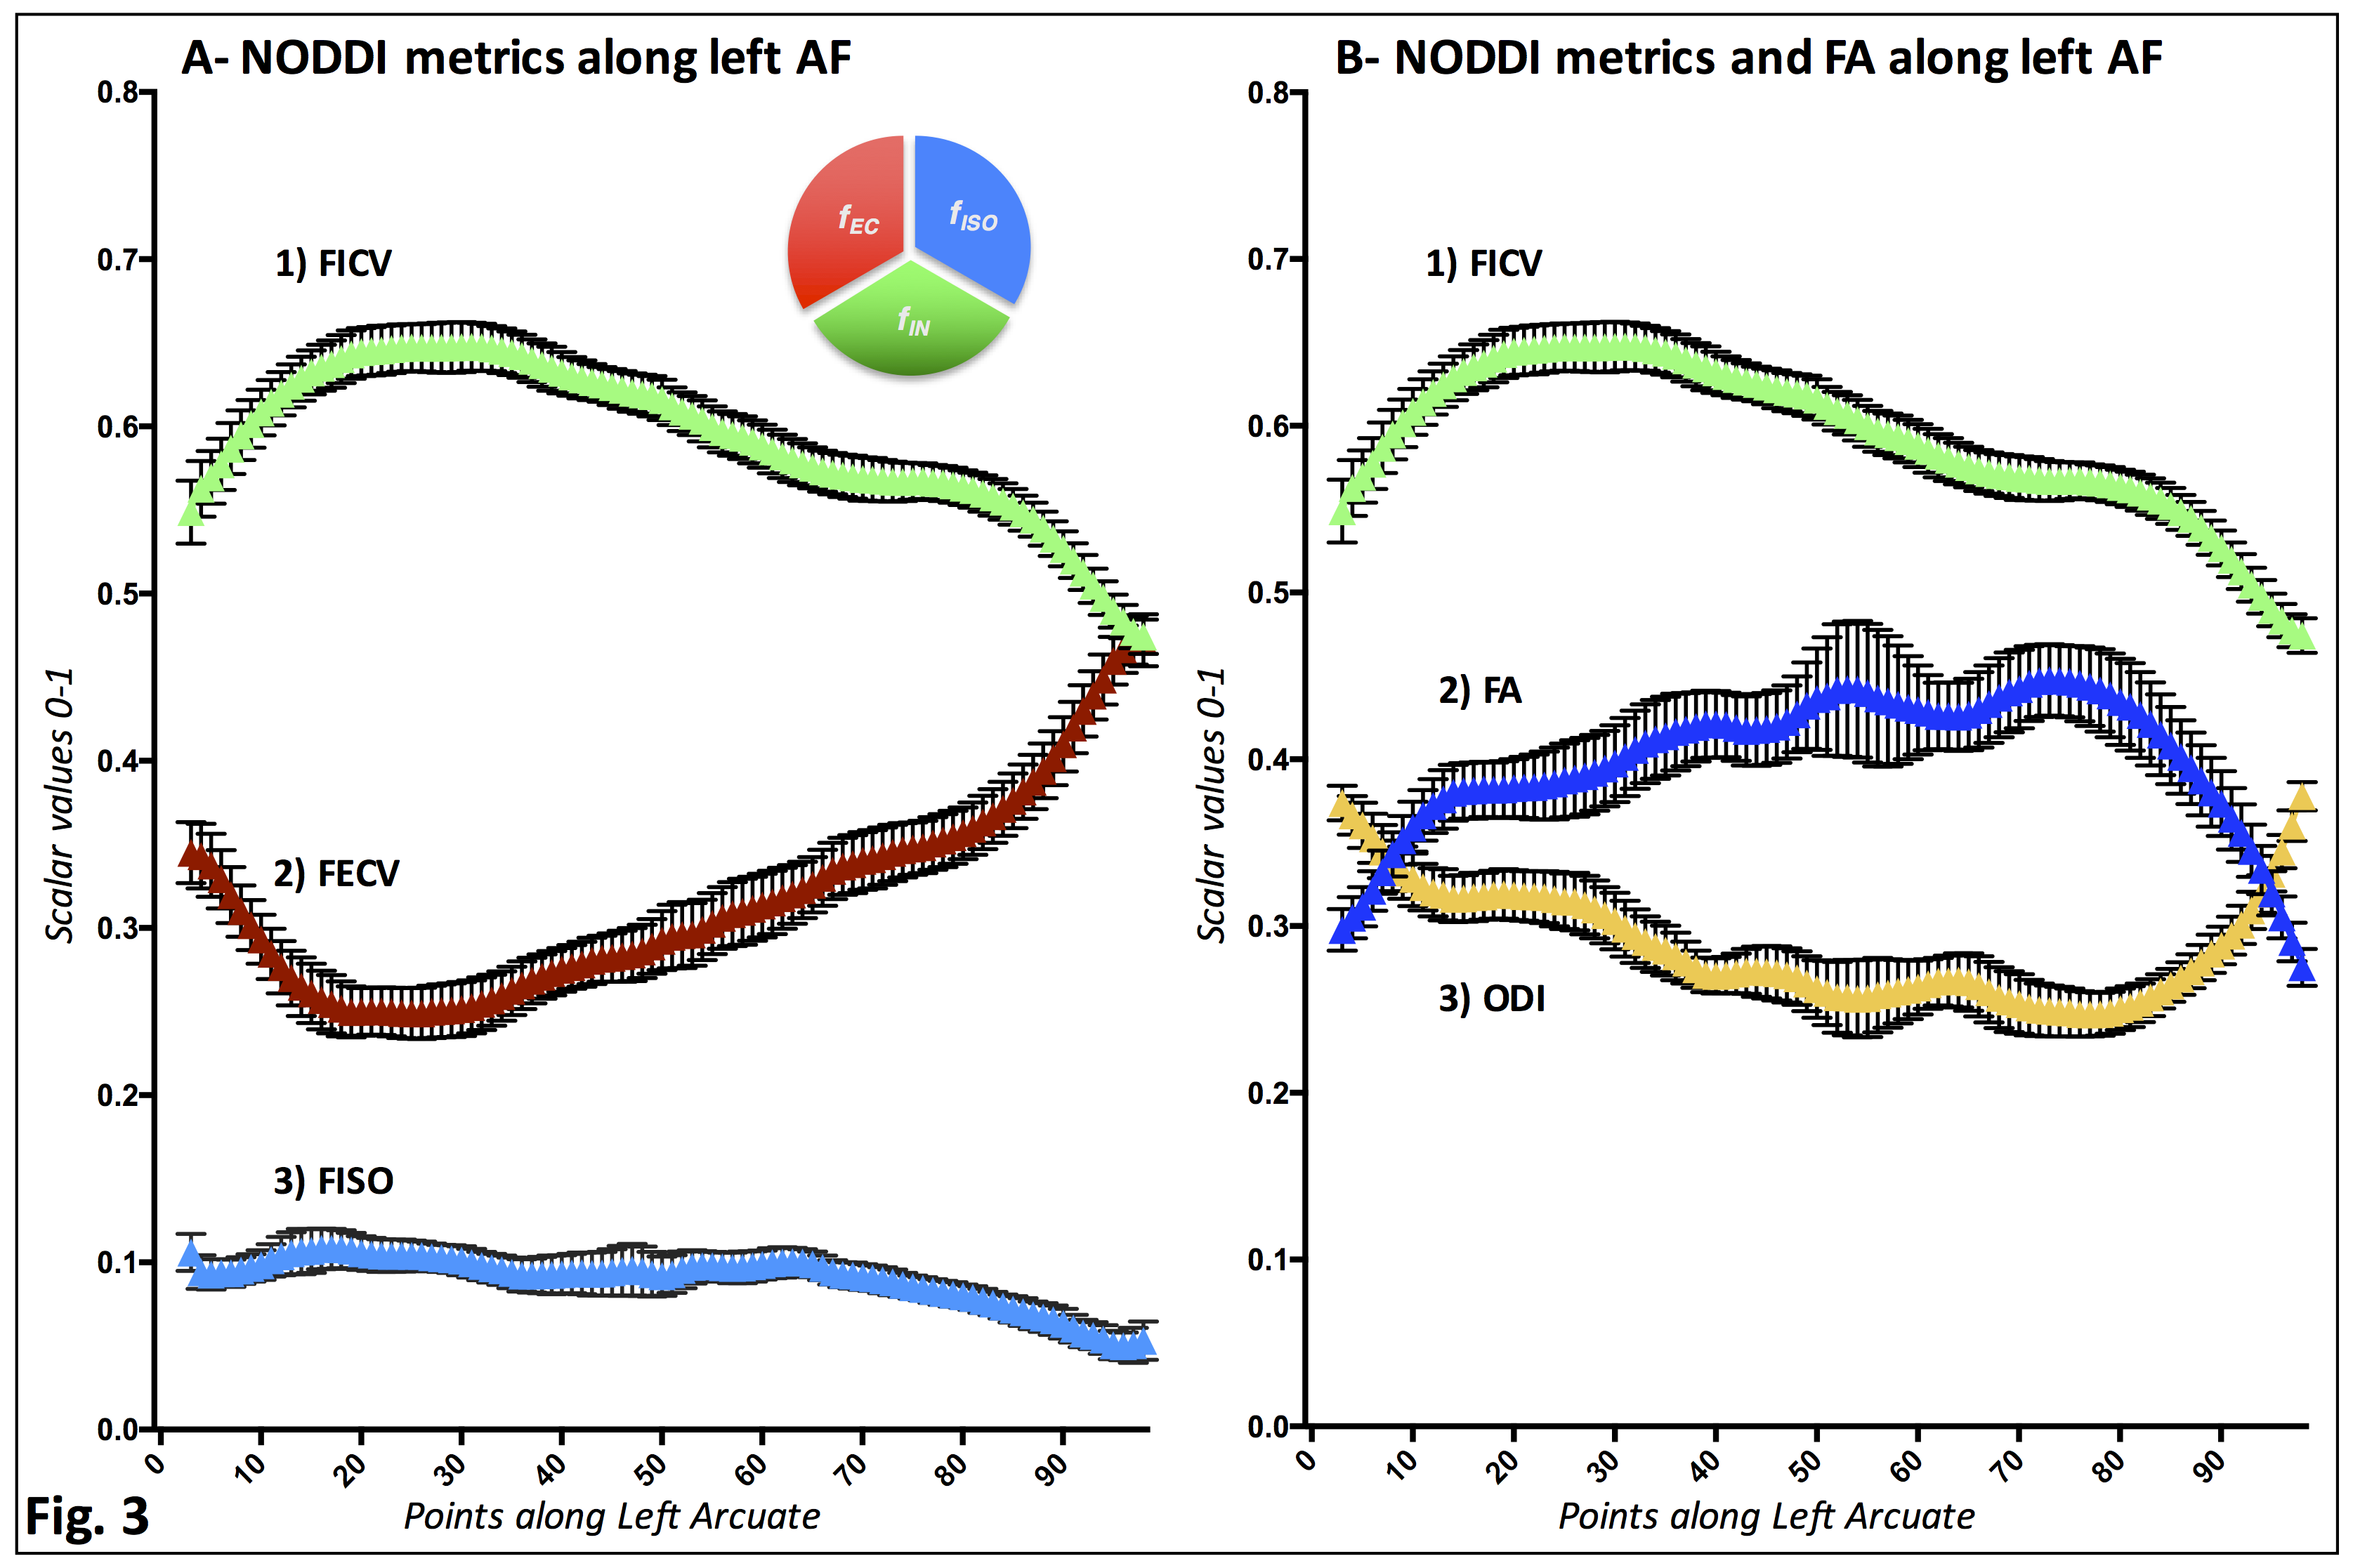
Average values and 95% CI of NODDI-derived metrics extracted from left AF in 15 healthy subjects are displayed.
A- FICV (1, green), FECV (2, red) and FISO (3, light blue) estimates.
B- FICV (1, green), FA (2, blue) and ODI (3, yellow) indices. FA and ODI profiles are inversely correlated, while FA and FICV profiles show a weakly positive correlation. In order for two points to display the same FA, a slight difference in ODI needs to be compensated by a much more consistent change in FICV.
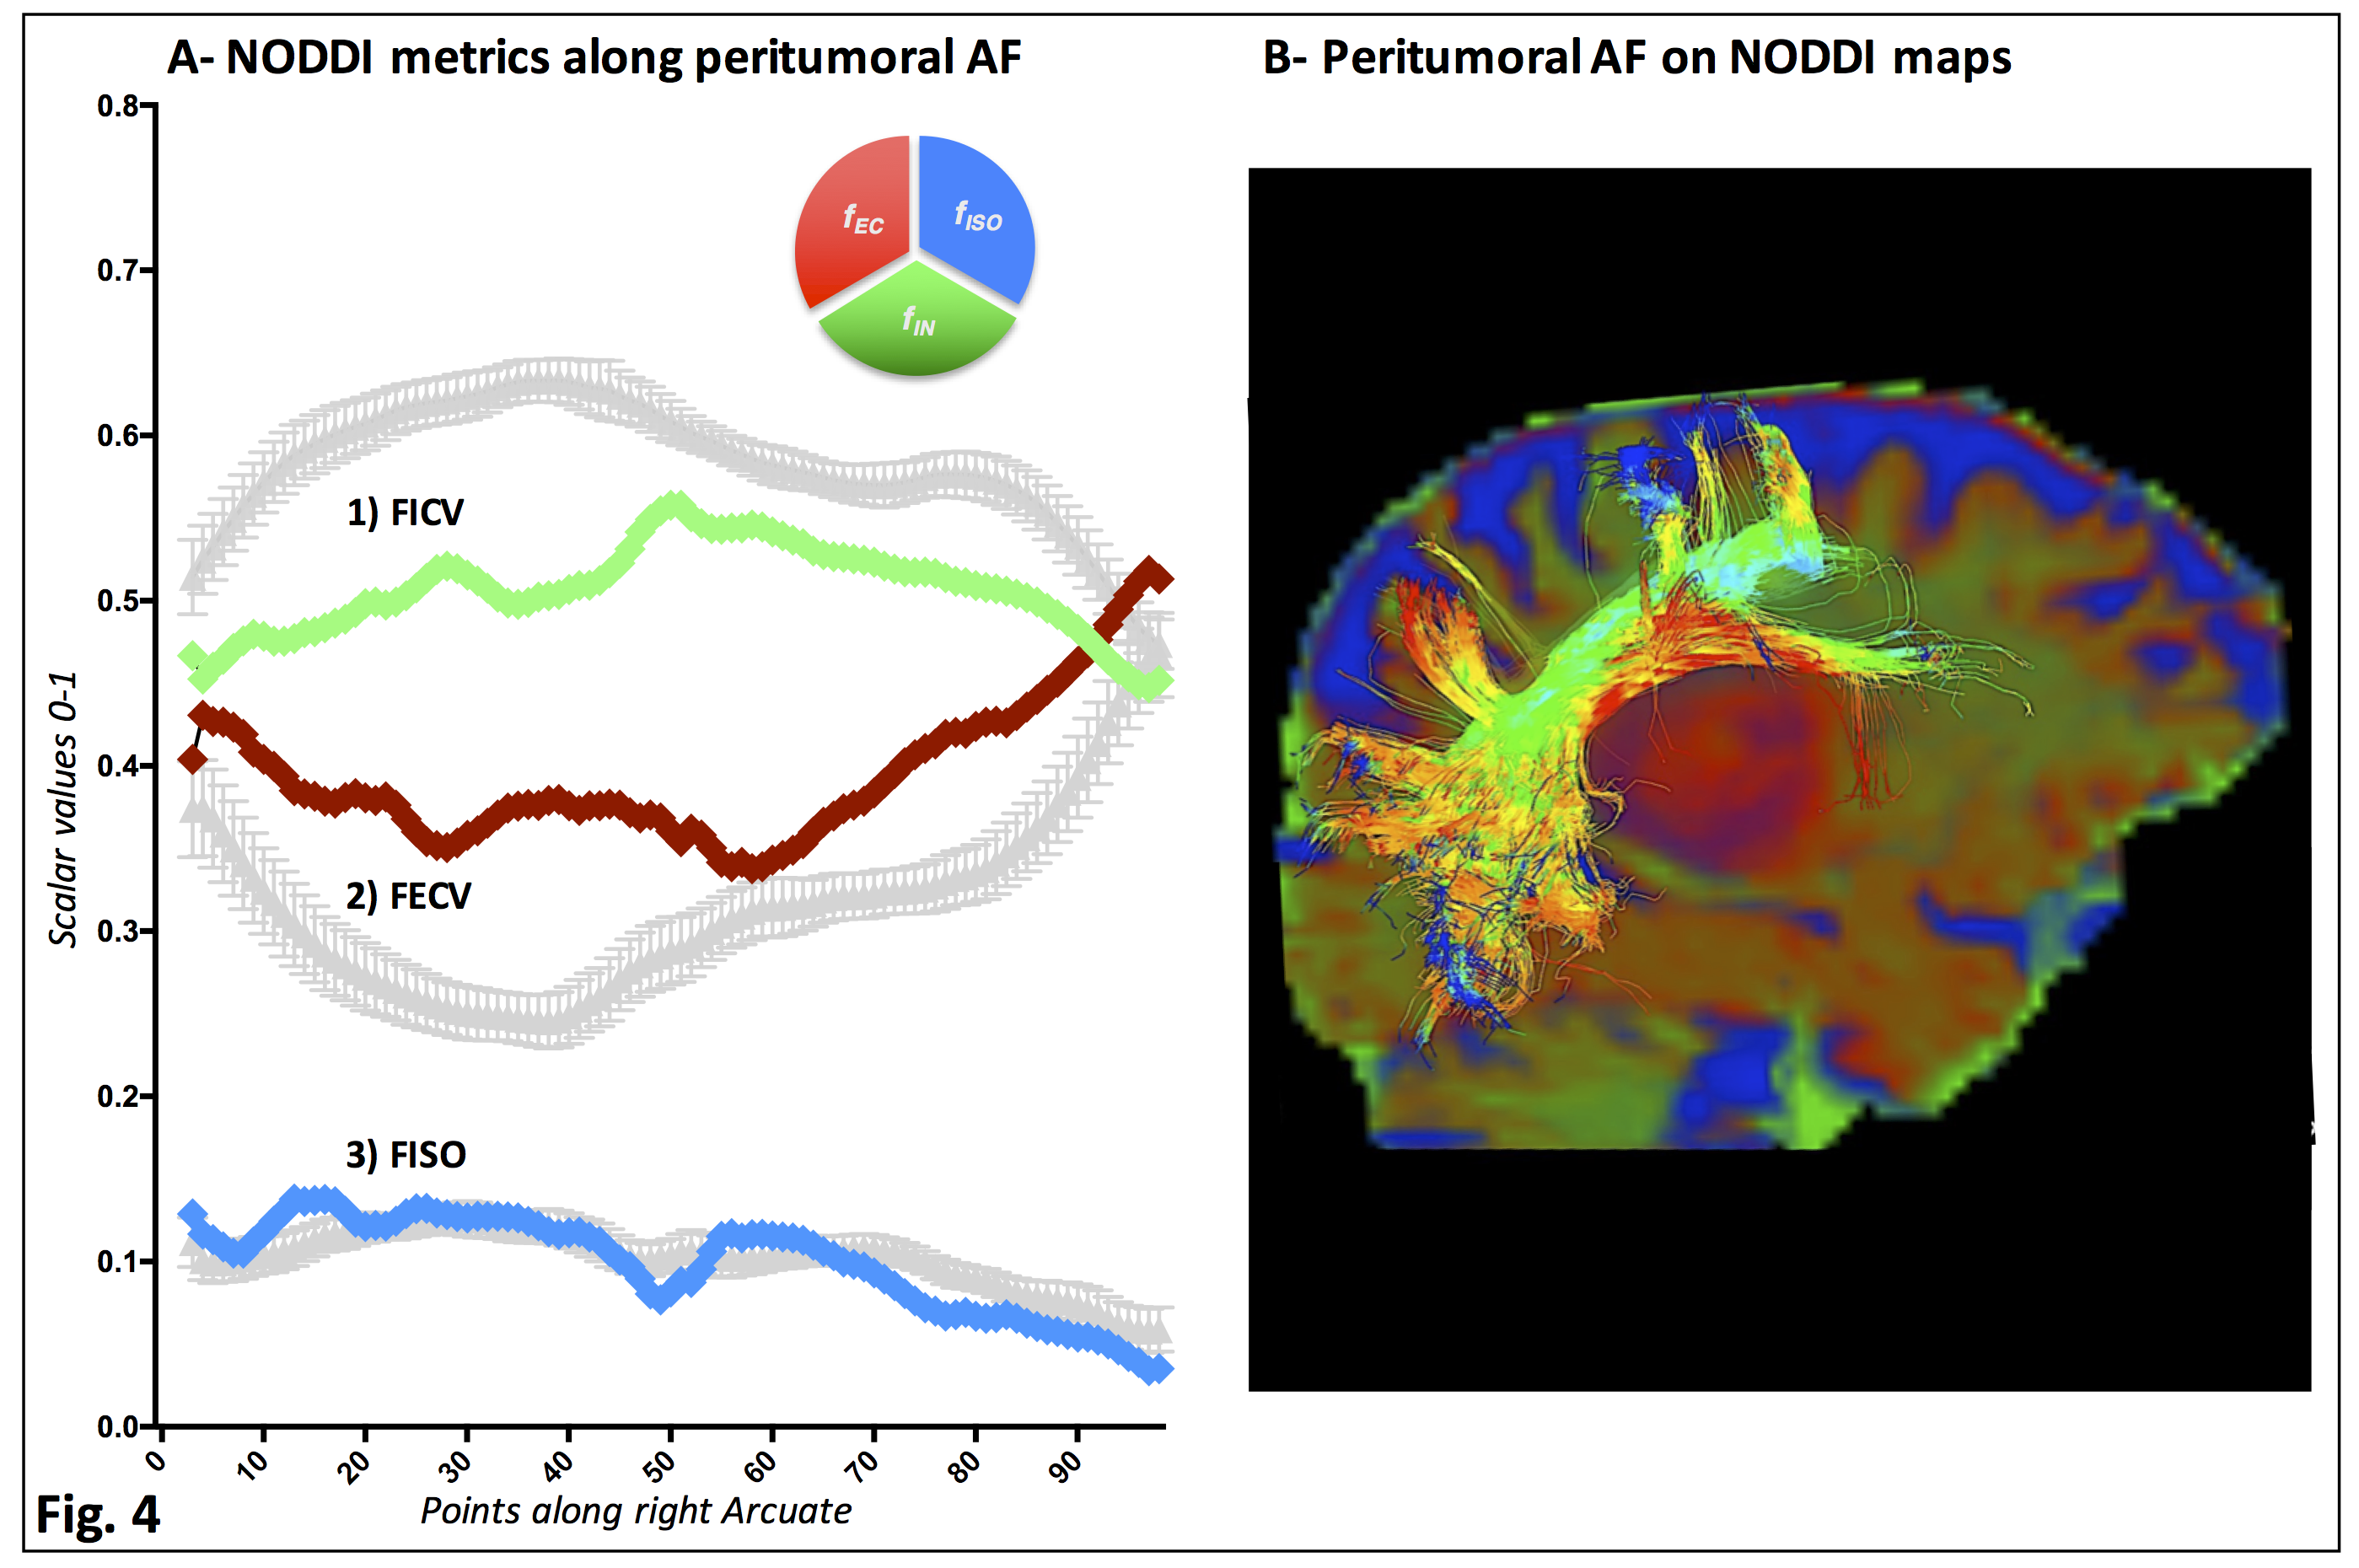
A- Average values along pathological right AF of a patient with glioblastoma are shown in comparison to the normative dataset (gray curves: average values and 95% CI of NODDI-derived metrics along right AF of 15 controls). In the peritumoral area, a reduction of neurite density (1, green) with an increment of extraneurite volume (2, red) along the tract can be appreciated, possibly representing peritumoral infiltration.
B- NODDI compartment maps of the glioblastoma patient were also combined into a single 4-dimensional volume visualized as RGB image (red:FECV; green:FICV; blue:FISO)7. AF passing through the peritumoral area has been superimposed on this map.