2697
Age-related alteration in topological efficiency of structural network in children with autism aged 2-7 yearsMinhui Ouyang1, Hua Cheng2, Di Hu2, Limei Song1, Yun Peng2, and Hao Huang1,3
1Department of Radiology, The Children's Hospital of Philadelphia, Philadelphia, PA, United States, 2Department of Radiology, Beijing Children's Hospital, Capital Medical University, Beijing, China, 3Department of Radiology, Perelman School of Medicine, University of Pennsylvania, Philadelphia, PA, United States
Synopsis
Relatively flat white matter (WM) microstructural changes have been found in children with autism spectrum disorder (ASD) aged 2-7 years yet faster WM microstructural maturation in typically developing (TD) children were observed. In this study, we further investigated the WM structural networks in children with ASD and TD children using diffusion MRI tractography and graph-theory-based analysis. Higher global and local topological efficiencies were found in the ASD. Similar to age-related WM microstructural maturation pattern, the global, local and nodal efficiencies established with structural network increase significantly faster in TD children than those in children with ASD.
Purpose
Early overgrowth has been reproducibly suggested for individuals with autism spectrum disorder (ADS) [1-4]. Atypical white matter (WM) microstructural development has been found in children with ASD aged 2-7years [5]. While higher WM microstructural integrity was observed in the children with ASD before 4 years, a slower WM microstructural maturational rate was found compared to typically developing (TD) children. In this study, we hypothesized that the altered network topological properties in young children with ASD demonstrate similar pattern as that of WM microstructural development. Diffusion MRI (dMRI) tractography and graph-theory analysis were used to investigate atypical maturation of structural network of children with ASD. The goal is to delineate the altered trajectories of global and regional topological properties in children with ASD aged 2-7 years.Methods
Participants: 31 children with ASD aged 2-7 years and 20 age-matched TD children participated. The diagnosis of autism was confirmed by ADOS/ADI structured diagnostic procedures [6] using DSM-IV criteria and the Childhood Autism Rating Scale (CARS). The exclusion criteria for TD children include nervous system diseases, psychiatric disorders, and systemic disorders by experienced clinicians. Acquisition of dMRI and T1-weighted image: All MR scans were performed on a 3T Philips Achieva MR system. dMRI were acquired using single-shot EPI with SENSE=2.3. Other parameters were: TR/TE=7960/83ms, FOV=256x256mm2, voxel size=2x2x2mm3, 70 slices, 30 independent diffusion-weighted directions, b-value=1000sec/mm2. T1-weighted (T1w) images were acquired using MPRAGE sequence with a voxel size of 1x1x1mm3. WM structural network construction: Subject’s T1w was linearly registered to its b0 image (Fig. 1B) and the coregistered T1w (Fig. 1A) was mapped into the ICBM152T1 template (Fig. 1D) in the MNI space using a nonlinear transformation matrix T with SPM8 package (https://www.fil.ion.ucl.ac.uk/spm/). The inverse transformation of T was applied to the contracted AAL atlas in the MNI space (Fig. 1E), resulting in individual-specific parcellation in their native dMRI space (Fig. 1F) as network nodes. The whole-brain WM fibers (Fig. 1C) was reconstructed with deterministic tractography [7] in DiffusionToolkit (http://www.trackvis.org/dtk/) with an angular threshold of 60o and FA threshold of 0.2. A symmetric 90x90 brain connection matrix (Fig. 1G) were constructed with the number of fiber (FN) connecting each pair of brain nodes defined as edges (Fig. 1F). 3D representation of WM structural network was shown using BrainNetViewer (https://www.nitrc.org/projects/bnv/) [8] (Fig. 1H) and all network properties (e.g. global, local and nodal efficiencies metrics) were calculated using Gretna (http://www.nitrc.org/projects/gretna/) [9] under network sparsity ranged from 0.05 to 0.4. Statistical analysis: Group difference comparisons of global and regional network efficiencies between ASD and TD were performed after regressing out age and brain size effects. Age and group interaction analysis of network efficiencies were performed with brain size adjusted. Linear regression between network properties and age were performed. All statistical analyses were conducted with R statistical software version 3.5.1 (https://www.r-project.org/).Results
Fig.2 demonstrates significantly higher (p<0.05) global and local network efficiencies in children with ASD across almost entire range of sparsity thresholds (0.05-0.4), resulting in significant difference in the area under curves (AUC) values shown as bar plots. The AUC values of global and local efficiencies increase significantly with age in both groups (Fig. 3), and the increase rate of global efficiency in TD is much sharper (p=0.04) than that in ASD revealed by age×group interaction analysis. Local efficiency tends to have the same trend with a faster growth in TD (p=0.06). Similar to global network properties, significant age×group interactions were found in the nodal efficiencies (shown in blue nodes in Fig. 4), and the scatter plots show the top three pronounced regions, including left angular gyrus, middle fronto-orbital gyrus and right median cingulate and paracingulate gyri. Specifically, strong age-related increases of nodal efficiencies were found in TD, whereas the increase rates in ASD were almost flat, indicating altered trajectories of network topological properties in ASD.Discussion and conclusion
Atypical age-related changes of network efficiencies were found in ASD with a slower increase rate compared to TD, following a similar pattern of WM microstructural development [5]. Global and regional structural network efficiencies increase with age for TD children, consistent with previous studies [10,11]. The altered brain topological properties may underlie the behavior profile observed in individuals with ASD. Non-uniformed atypical functional connectivity maturation across different age ranges in ASD have been reported [12]. The macrostructural topological findings presented in this study unify the microstructural observations of overgrowth at the earlier stage and subsequent slower WM maturation in children with ASD. Correlation between WM structural network properties and ASD behavioral assessment is under way.Acknowledgements
This study is funded by NIH MH092535, MH092535-S1, HD086984.References
[1] Courchesne et al (2001) Neurology 57:245-254. [2] Courchesne et al (2003) JAMA 290: 337-344. [3] Dementieva et al (2005) Pediatr. Neurol. 32:102-108. [4] Dawson et al (2007) Biol. Psychiatry 61: 458-464. [5] Ouyang et al (2016) Hum. Brain Mapp. 37:819-832. [6] Courchesne et al. (2007) Neuron 56:399-413. [7] Mori et al (1999) Ann Neurol 45:265-269. [8] Xia et al (2013) Plos One 8:e68910. [9] Wang et al (2015) Front. Hum. Neurosci. 9:386. [10] Huang et al (2015) Cereb. Cortex 25:1389-1404. [11] Hagmann et al (2010) Proc. Natl. Acad. Sci. USA 107: 19067-19072 [12] Nomi and Uddin (2015) NeuroImage: Clinical 7:732-741Figures
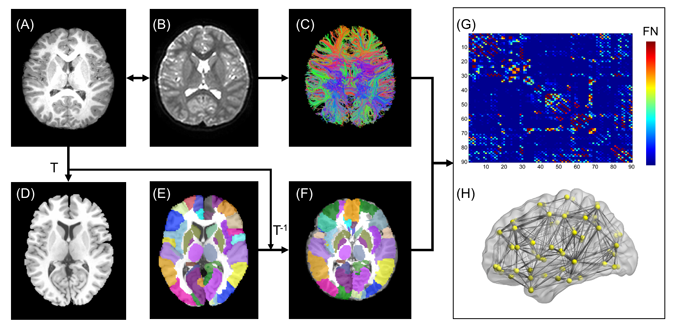
Fig. 1: Flowchart of brain white matter (WM) structural network construction. Each subject’s T1 weighted image (T1w) was aligned with the b0 image (B) from diffusion magnetic resonance imaging (dMRI). (C) shows dMRI tractography results in the subject’s space. The co-registered T1w (A) in the subject native dMRI space was registered to the ICBM152T1 template in the MNI space (D) with the transformation matrix T. The AAL atlas (E) were transferred to the subject’s native space (F) with the inverse transformation of T. With delineation of network edges (C) and nodes (F) in the native space, connectivity matrix (G) and network graph (H) were established.
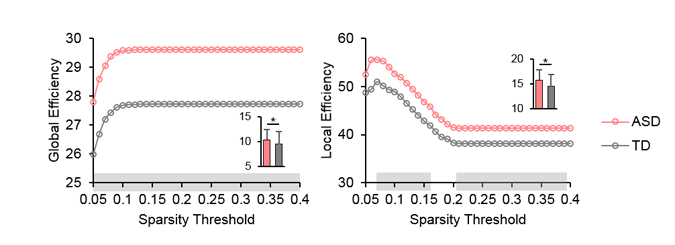
Fig. 2: Differences in global topological properties of WM structural networks between ASD and TD. Global efficiency and local efficiency of WM structural network were quantified in ASD (red) and TD (gray) groups with different network sparsity thresholds. Shaded areas on the horizontal axis indicate a significant group difference (p<0.05) in the global network properties under the sparsity threshold, with age and brain size effects adjusted. The bar plots in each panel present the area under curve (AUC) value of topological properties across the entire range of sparsity threshold (0.05-0.4).
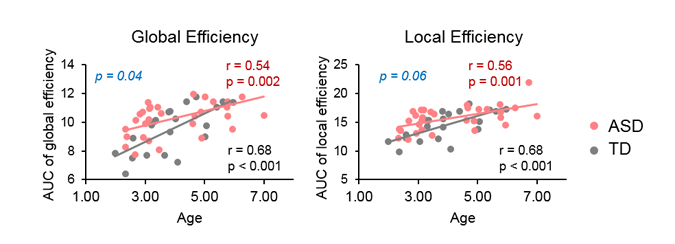
Fig. 3: Age effect in the AUC value of global and local efficiency of WM structural networks in ASD (red) and TD (gray) groups. Significant age×group interaction (p-value shown in blue) were found in the global efficiency of WM structural network with brain size effect adjusted.
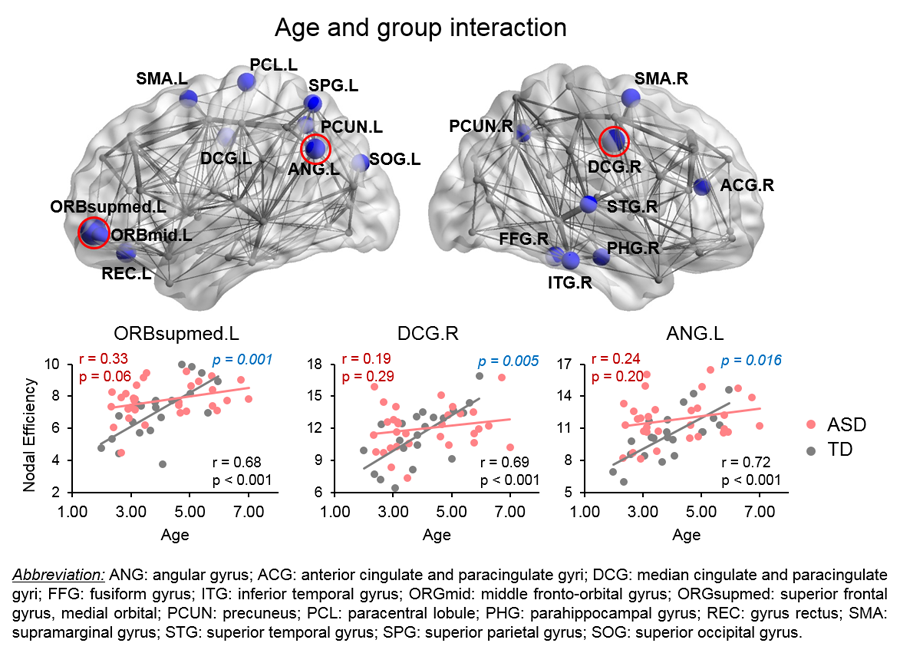
Fig. 4: Age×group interactions in the nodal efficiency of WM structural networks. The nodes with significant age×group (TD and ASD groups) interaction in the nodal efficiency with brain size effect adjusted are shown in blue in the 3D representation of structural network, with node size indicating the significance of the interaction at p < 0.05 (FDR corrected) in the upper panel. In the lower panel, the scatter plots show the age-related differences in nodal efficiencies from the top 3 pronounced regions (circled in red in upper panel) with significant interaction.