2694
Stronger small-worldizition of structural networks in drug-naïve children and adolescents with ADHD:A graph theory analysis1Huaxi MR Research Center (HMRRC), Department of Radiology, West China Hospital of Sichuan University, Chengdu, China, 2Department of Psychiatry and Behavioral Neuroscience, University of Cincinnati, Cincinnati, OH, United States
Synopsis
Structural connectomes of patients with ADHD showed a shift toward “stronger small-worldization” which provided a structural basis for higher rates of information transfer in this disorder. These global network alterations, together with increased connectivity within and among DMN and task-positive networks including FPN, DAN and VAN, could lead to disruptions of attention and goal-oriented behavior that are the primary clinical hallmarks of ADHD.
Background
Growing evidence shows that brain network dysconnnectivity is a central feature of attention-deficit/hyperactivity disorder (ADHD), and that the efficient small-world organization pattern (characterized by both high local specialization and high global integration) is disrupted in ADHD. In this study, we explored the brain structural connectome in children and adolescents with ADHD using diffusion-tensor imaging (DTI) and graph theory approaches.Materials and method
50 male patients with ADHD and 52 age-, sex-, and handedness- matched healthy male controls were recruited at West China Hospital of Sichuan University from June 2009 to December 2011 (Table 1). All participants were drug-naive and ranged from 7 to 16 years old. ADHD diagnoses were confirmed by two experienced psychiatrists using the Structured Clinical Interview for DSM-IV-Patient Edition (SCID-P). The revised Conners’ Parent Rating Scale (CPRS) was used to measure behavioral issues of ADHD patients. The Stroop Color-Word Test (SCWT) was used to assess cognitive control. Written informed consent was obtained from guardians of all participants. This prospective study was approved by the ethics committee of Sichuan University.
Participants were scanned using a 3-T high-resolution MR scanner (Trio; Siemens, Erlangen, Germany) with an eight-channel phased-array head coil. A magnetization prepared rapid gradient echo sequence was used to acquire T1- weighted images and a single-shot echo-planar sequence was used to obtain DTI data. Image preprocessing and analyses were implemented using the PANDA pipeline.1
We constructed a 90×90 network matrix for each individual, in which each row and column represents a node from the AAL atlas and each element represents the averaged fractional anisotropy of linking fibers between nodes. GRETNA was used to investigate the topologic properties of brain networks at both the global and nodal levels. Network-based-statistic (NBS) was used to identify sub-networks (a set of edges that were connected) that differed between the ADHD and HC groups.2 Group differences of the structural connectome were compared using nonparametric permutation tests.3 After significantly different network metrics were identified, partial correlation analysis was used to examine relationships between these abnormal connectome metrics and behavioral (CPRS) and cognitive data (SCWT).
Results
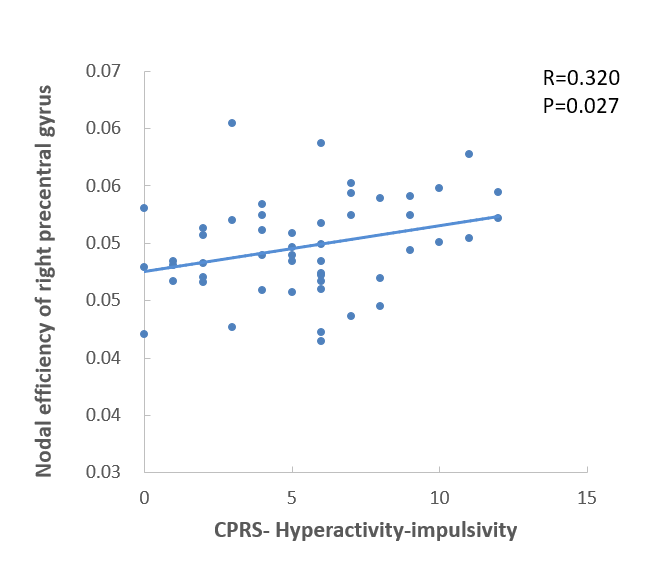
In the defined threshold range, both ADHD and HC groups showed small-world topology (γ>1, λ≈1) in the structural connectome. Compared to healthy controls, patients with ADHD showed decreases in the shortest path length (p=0.0074), γ (p=0.0014),λ (p=0.0355) and σ (p=0.0011), increases in local efficiency (p=0.0150) and global efficiency (p=0.0071)(Figure 1). Furthermore, patients with ADHD showed increased nodal centralities in right precuneus, right precentral gyrus, right middle occipital gyrus, right angular gyrus, left olfactory gyrus, and right Heschl’s gyrus (P < 0.05, corrected for false-discovery rate) (Table 2). The hyperactivity-impulsivity score of CPRS was positively correlated with nodal efficiency of the right precentral gyrus (r = 0.32, P = .027) (Figure 2). We also identified a single network showing significantly increased connectivity in children and adolescents with ADHD compared with typically developing children which comprised 25 nodes and 24 edges (Figure 3).Discussion
The present study examined the topological organization of structural brain networks in children and adolescent with ADHD. Three novel findings emerged from this study. First, global properties of the structural connectome of ADHD patients showed a shift toward “stronger small-worldization”. 4 Specifically, compared to normally developing children, patients with ADHD had significantly decreased path length and normalized path length, and increased local and global efficiency. These novel findings indicated an increased capacity for information exchange within the brain at global and local levels in ADHD. This might be related to and perhaps result from increased information transfer, and may underlie problems sustaining attention and limiting distractibility by extraneous stimuli in ADHD. This increased potential for information transfer indicated by our DTI data may lead to bottleneck problems for attention and decision making, and thus contribute to behavioral disturbances associated with ADHD.5-7 Second, analysis of regional network properties indicated increased nodal centrality of key nodes within DMN, FPN, VN, and DAN, and increased intra- and inter-network connectivity in ADHD. These results were consistent findings from analysis of global network properties in showing an increased capacity for information transmission in brain networks of ADHD patients. Third, we observed that nodal efficiency of the right precentral gyrus was positively correlated with CPRS hyperactivity-impulsivity score, suggesting a clinical significance of the identified white matter network alterations.Acknowledgements
This study was supported by the National Natural Science Foundation (Grant No. 81671669), Science and Technology Project of Sichuan Province (Grant No. 2017JQ0001).References
1. Cui ZX, Zhong SY, Xu PF, He Y, Gong GL. PANDA: a pipeline toolbox for analyzing brain diffusion images. Front Hum Neurosci. 2013;7.
2.Zalesky A, Fornito A, Bullmore ET. Network-based statistic: Identifying differences in brain networks. Neuroimage. 2010;53(4):1197-1207.
3.Bullmore ET, Suckling J, Overmeyer S, Rabe-Hesketh S, Taylor E, Brammer MJ. Global, voxel, and cluster tests, by theory and permutation, for a difference between two groups of structural MR images of the brain. Ieee T Med Imaging. 1999;18(1):32-42.
4.Suo X, Lei D, Li L, et al. Psychoradiological patterns of small-world properties and a systematic review of connectome studies of patients with 6 major psychiatric disorders. Journal of psychiatry & neuroscience : JPN. 2018;43(5):170214.
5.Broadbent DE. A mechanical model for human attention and immediate memory. Psychological review. 1957;64(3):205-215.
6.Treisman AM. Strategies and models of selective attention. Psychological review. 1969;76(3):282-299.
7.Posner MI, Rothbart MK. The development of attentional mechanisms. Nebraska Symposium on Motivation Nebraska Symposium on Motivation. 1980;28:1-52.
Figures