2693
Exploring White Matter Functional Networks at Rest in Boys with Attention Deficit/Hyperactivity Disorder Using Clustering Analysis and Tractography1Huaxi MR Research Center, Department of Radiology, West China Hospital of Sichuan University, Chengdu, China, 2Mental Health Center, Department of Psychiatry, West China Hospital of Sichuan University, Chengdu, Chile
Synopsis
In current study, we identified nine white matter functional networks and their relations to structural white matter fibers identified by DTI. Sensorimotor network and dorsal attention network, which show good spatial correspondence with specific anatomical tracts, present higher amplitude in ADHD. Our results uncover the altered intrinsic functional organization of white matter in ADHD, and indicate that changes in neural activity are encoded in BOLD variations within white matter.
Background
Previous studies mapping intrinsic brain connectivity have facilitated the models of attention deficit/hyperactivity disorder (ADHD) pathophysiology that encompass a number of different large-scale resting-state networks1. These studies have traditionally focused on the function of gray matter regions, ignoring the critical role played by white matter in supporting brain functions. Recently, several works have demonstrated that the white matter BOLD signals are related to neural activity in healthy subjects, which may be detected by BOLD signal from fMRI2,3. Hence, we applied a data-driven approach to resting-state fMRI data of white matter in drug- naïve boys with ADHD to characterize white matter network organization and altered signals in the resting state.Methods
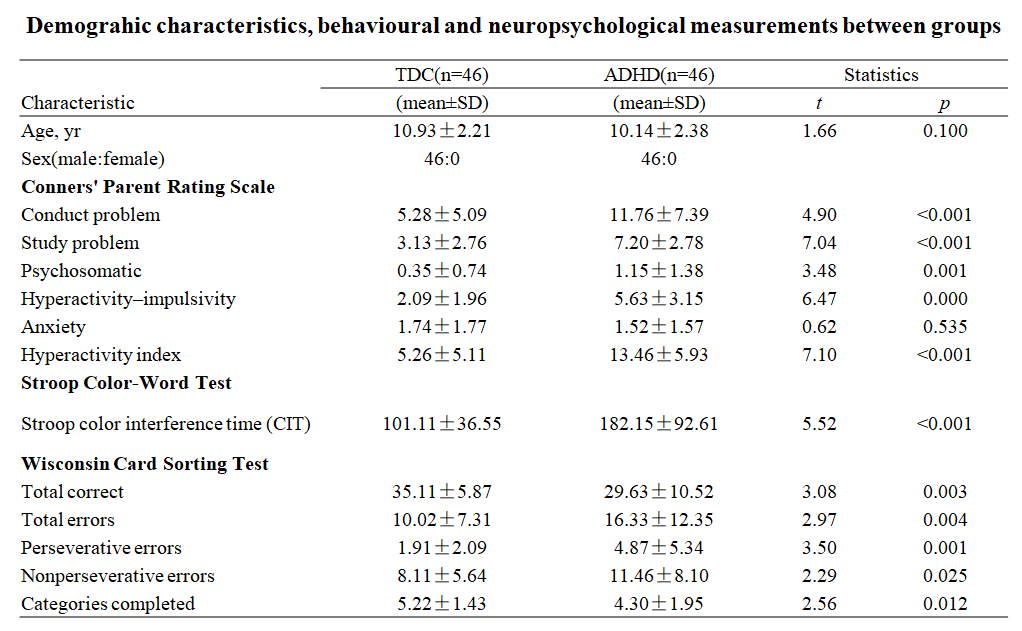
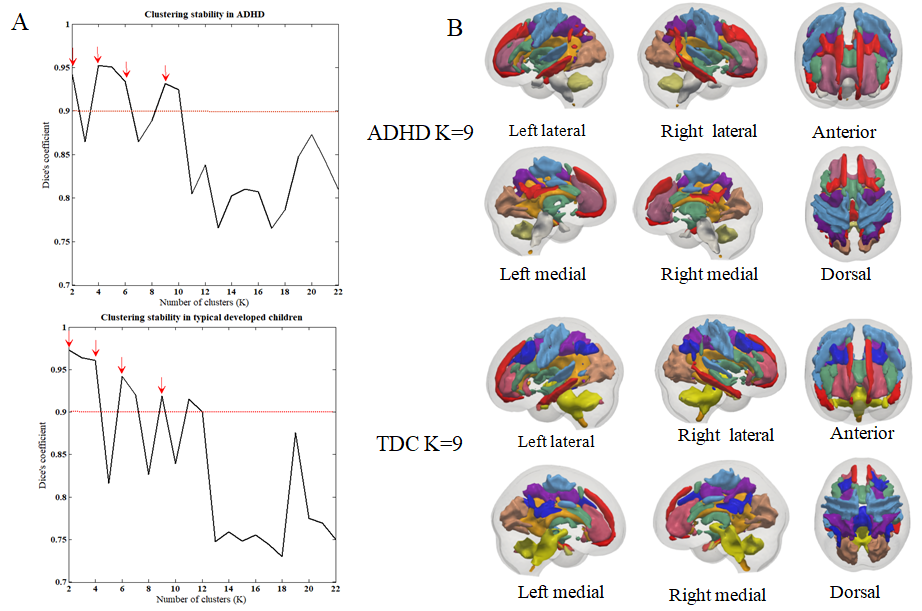
This data set consisted of 46 drug-naïve boys with ADHD (mean ages 10.14±2.38 years) and 46 typical developed children (TDC) matched for age, sex (mean ages 10.93±2.21 years) collected at West China Hospital, Sichuan University. Diagnosis of ADHD was determined by DSM-IV. The Chinese version of revised Conners’ Parent Rating Scale (CPRS), Stroop Color-Word Test and Wisconsin Card Sorting Test were used to assess problematic behavior, inhibitory control, and executive function, respectively. All subjects were scanned using Siemens Trio 3T MRI system with an 8-channel phase-array head coil. The MR data for each subject consisted of a resting-state EPI scan, a T1- weighted anatomical scan and a DTI scan (20 diffusion directions, b = 1000 s/mm2). After functional and anatomical images preprocessing, K-means clustering (ranging from 2 to 22) was performed on the white-matter resting-state voxelwise correlation matrices to identify white matter functional networks for two groups respectively. Only voxels identified as white matter were used from each subject. Dice’s coefficient was calculated for each clustering to identify the most stable solutions. Meanwhile, DTI preprocessing and tractography were performed to help find correspondence between white matter functional networks and anatomical tracts. Signal amplitudes in each frequency were extracted from each white matter network and were averaged across participants to produce an average frequency-power graph for each network.Results
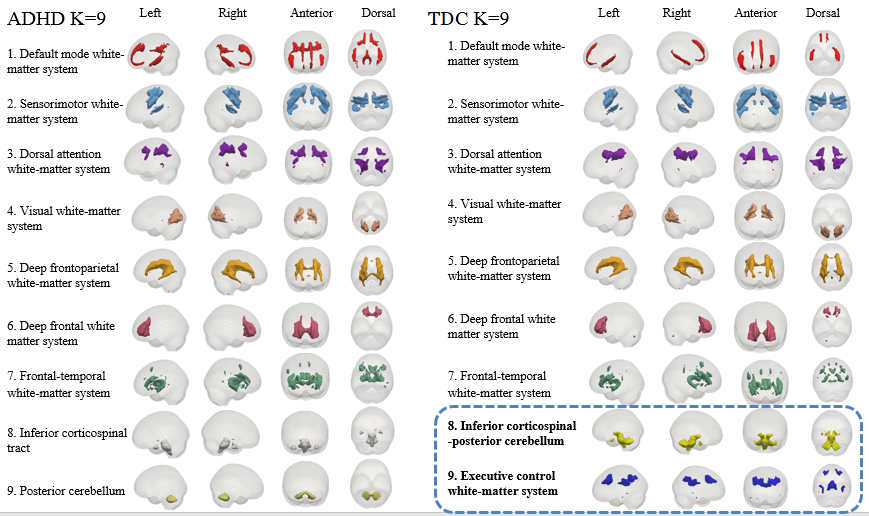
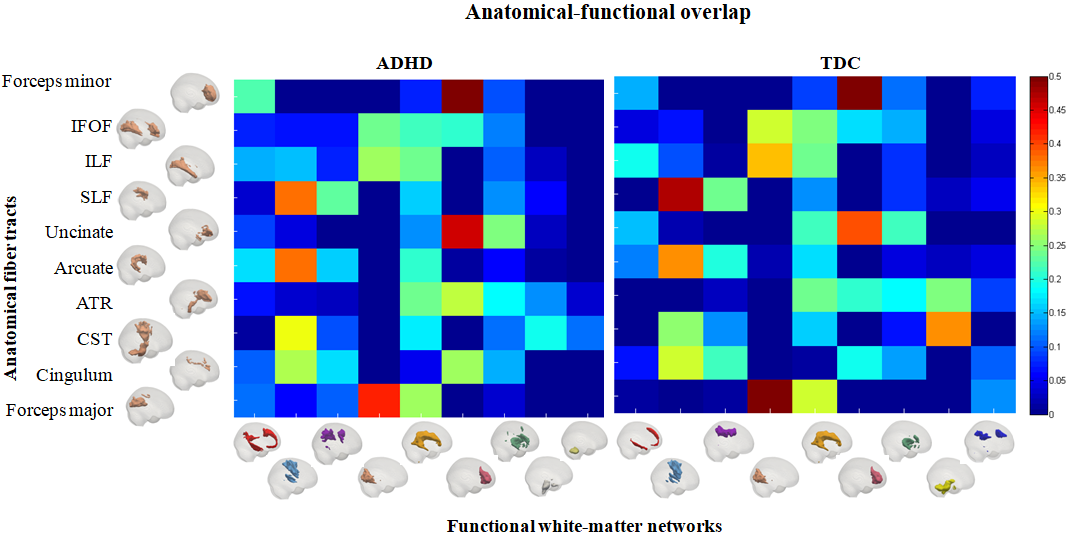
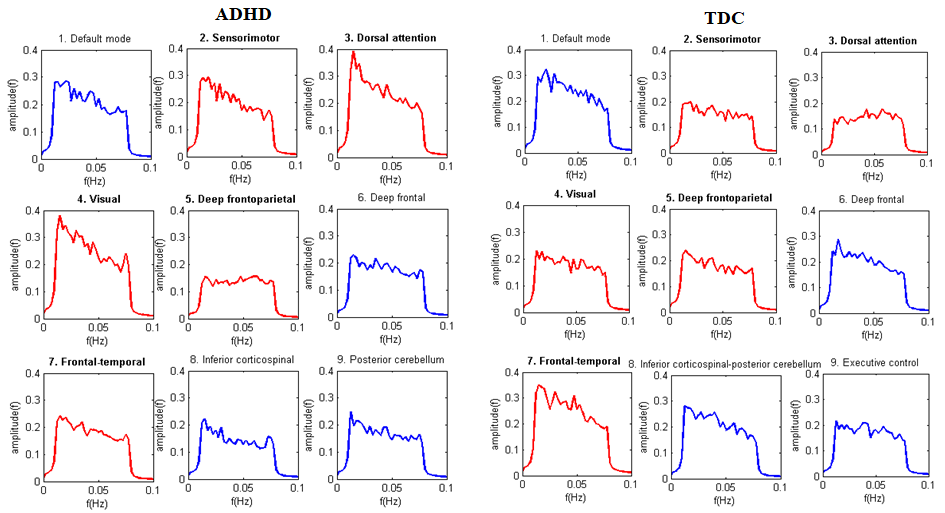
The numbers of clusters that represented the most stable functional segregations for both groups were 2, 4, 6, and 9, and here we focus on the clustering into 9 networks with similarity to known resting-state grey matter network4 (Fig.1). The identified white matter networks in boy with ADHD include default mode, sensorimotor, dorsal attention, visual, frontoparietal, deep frontal, frontal-temporal, inferior corticospinal, and posterior cerebellum, whereas in TDC group executive control network was identified which did not present in ADHD, and the inferior corticospinal and posterior cerebellum were combined as one network (Fig.2). Functional networks show overlap with anatomical tracts, and some functional networks (e.g., sensorimotor, visual, frontoparietal and deep frontal) extend across several tracts (Fig.3). Power spectral of signals is greater at lower frequencies in all white matter networks. Interestingly, amplitude of sensorimotor, dorsal attention and visual network in ADHD is significantly higher than healthy controls, while lower amplitude of frontoparietal and frontal-temporal network were detected in ADHD compared with TDC (Fig. 4).Discussion & Conclusion
In current study, we revealed the existence of 9 distinct white matter functional networks in boys with ADHD and TD using clustering analysis approach and validate them with correspondence to white matter fibers identified by DTI. For the first time, our results uncover the altered intrinsic functional organization of white matter in ADHD. Specifically, we found that boys with ADHD lack the executive control white matter network which is presented in TDC and had lower activity in frontoparietal and frontal-temporal white matter networks which may underlie the mechanism of deficit in executive function in ADHD. Meanwhile boys with ADHD showed greater activity in sensorimotor and dorsal attention networks which may contribute to the hyperactivity or inattention symptoms in ADHD.Acknowledgements
This study was supported by the National Natural Science Foundation (Grant No. 81671669), Science and Technology Project of Sichuan Province (Grant No. 2017JQ0001).References
1. Castellanos FX, Proal E. Large-scale brain systems in ADHD: beyond the prefrontal-striatal model. Trends in Cognitive Sciences. 2012;16(1):17-26
2. Marussich L, Lu KH, Wen H, Liu Z. Mapping white-matter functional organization at rest and during naturalistic visual perception. NeuroImage. 2017;146:1128-41
3. Ding ZH, Huang YL, Bailey SK, et al. Detection of synchronous brain activity in white matter tracts at rest and under functional loading. P Natl Acad Sci USA. 2018;115(3):595-600
4. Yeo BT, Krienen FM, Sepulcre J, et al. The organization of the human cerebral cortex estimated by intrinsic functional connectivity. J Neurophysiol. 2011; 106:1125–1165
Figures