2689
Studying disease-related brain alterations in bipolar disorder with combined analysis of DKI and VBM1Department of Radiology, the University of Tokyo, Tokyo, Japan, 2Department of Radiology, Juntendo University, Tokyo, Japan, 3Department of Neuropsychiatry, the University of Tokyo, Tokyo, Japan, 4Department of Radiology, the University of Tokyo Hospital, Tokyo, Japan
Synopsis
Brain abnormalities in bipolar disorder were investigated with diffusion kurtosis imaging and voxel-based morphometry, using a framework for data-driven feature extraction from multivariate data. The result showed two components capturing effect of diagnosis, and these were driven by diffusion kurtosis measures in the white matter including the prefrontal-striatal-thalamic pathways, cerebellum, and medial temporal lobes. Our results indicate diffusion kurtosis imaging can provide unique information that is sensitive to the abnormalities in bipolar disorder, and that interrelationship among different measures is a promising avenue to study neuronal circuits relevant to the disease.
Introduction
Bipolar disorder (BD) is a common affective disorder that has a large burden on society. Though the exact etiologies of BD remain unknown, data from post-mortem, genetic, and imaging studies have provided evidence for substantial brain abnormalities.1-4 MRI studies using functional MRI,5 morphemetry,6,7 diffusion,8 and other modes of microstructural imaging9 have shown intriguing findings, that seem to relate one another. While most previous studies focused on each measure separately, studying the cross-information among different measures can bring us even more.10 Also, application of diffusion kurtosis imaging (DKI) in BD has been scarce, whereas its strength over diffusion tensor imaging (DTI) has been repeatedly reported in other psychological disorders like schizophrenia.11 In this study, we investigated brain abnormalities in patients with BD with DTI/DKI and voxel-based morphometry (VBM), using multivariate fusion analysis.12Methods
Participants: Data from 27 patients with BD (34.7 ± 10.7 years-old, 17 male) and 43 healthy controls (39.2 ± 8.0 years-old, 16 male) were analyzed. All participants were right-handed, and had no history of neuropsychological disease other than BD, alcohol or drug abuse, head trauma, or any abnormalities visible on conventional MRI.
Image acquisition: MRI data were acquired using a 3-T unit (Discovery MR750w, GE Healthcare). A single-shot EPI sequence was used with three diffusion weightings (b = 1000, 1500, and 2000 s/mm2) along 30 non-collinear directions, and 5 b= 0 s/mm2 volumes (voxel size = 1.88 × 1.88 × 2.50 mm3; δ/Δ = 35.1/44.7 ms). Structural 3D T1-weighted images were acquired using SPGR sequence (voxel size = 1.00 × 1.00 × 1.20 mm3).
Diffusion processing: DTI/DKI metrics were computed using DKE software13 after denoising,14 correction for Gibbs ringing,15 and correction for motion and eddy current distortions.16 The diffusion parameter maps (mean diffusivity (MD), fractional anisotropy (FA), mean kurtosis (MK), and kurtosis fractional anisotropy (KFA)) were projected onto mean FA skeleton created by FSL’s TBSS routine.
VBM processing: T1-weighted images were processed with FSL-VBM. For smoothing, we used an isotropic Gaussian kernel with a sigma of 4 mm.
Linked independent component analysis (LICA): The skeletonized diffusion maps and smoothed gray matter density maps were analyzed with FMRIB’s implementation of LICA (http://fsl.fmrib.ox.ac.uk/fsl/fslwiki/FLICA) (Figure 1). LICA was initialized with principal component analysis, where we determined model order (number of components) based on Bayesian model selection.17
Statistical test: We tested diagnostic group differences in all LICA components accounting for age and sex, using general linear model as implemented in Permutation Analysis of Linear Models.18 Significance threshold was set at p < 0.05 (two-tailed), corrected for multiple comparisons across components.
Results
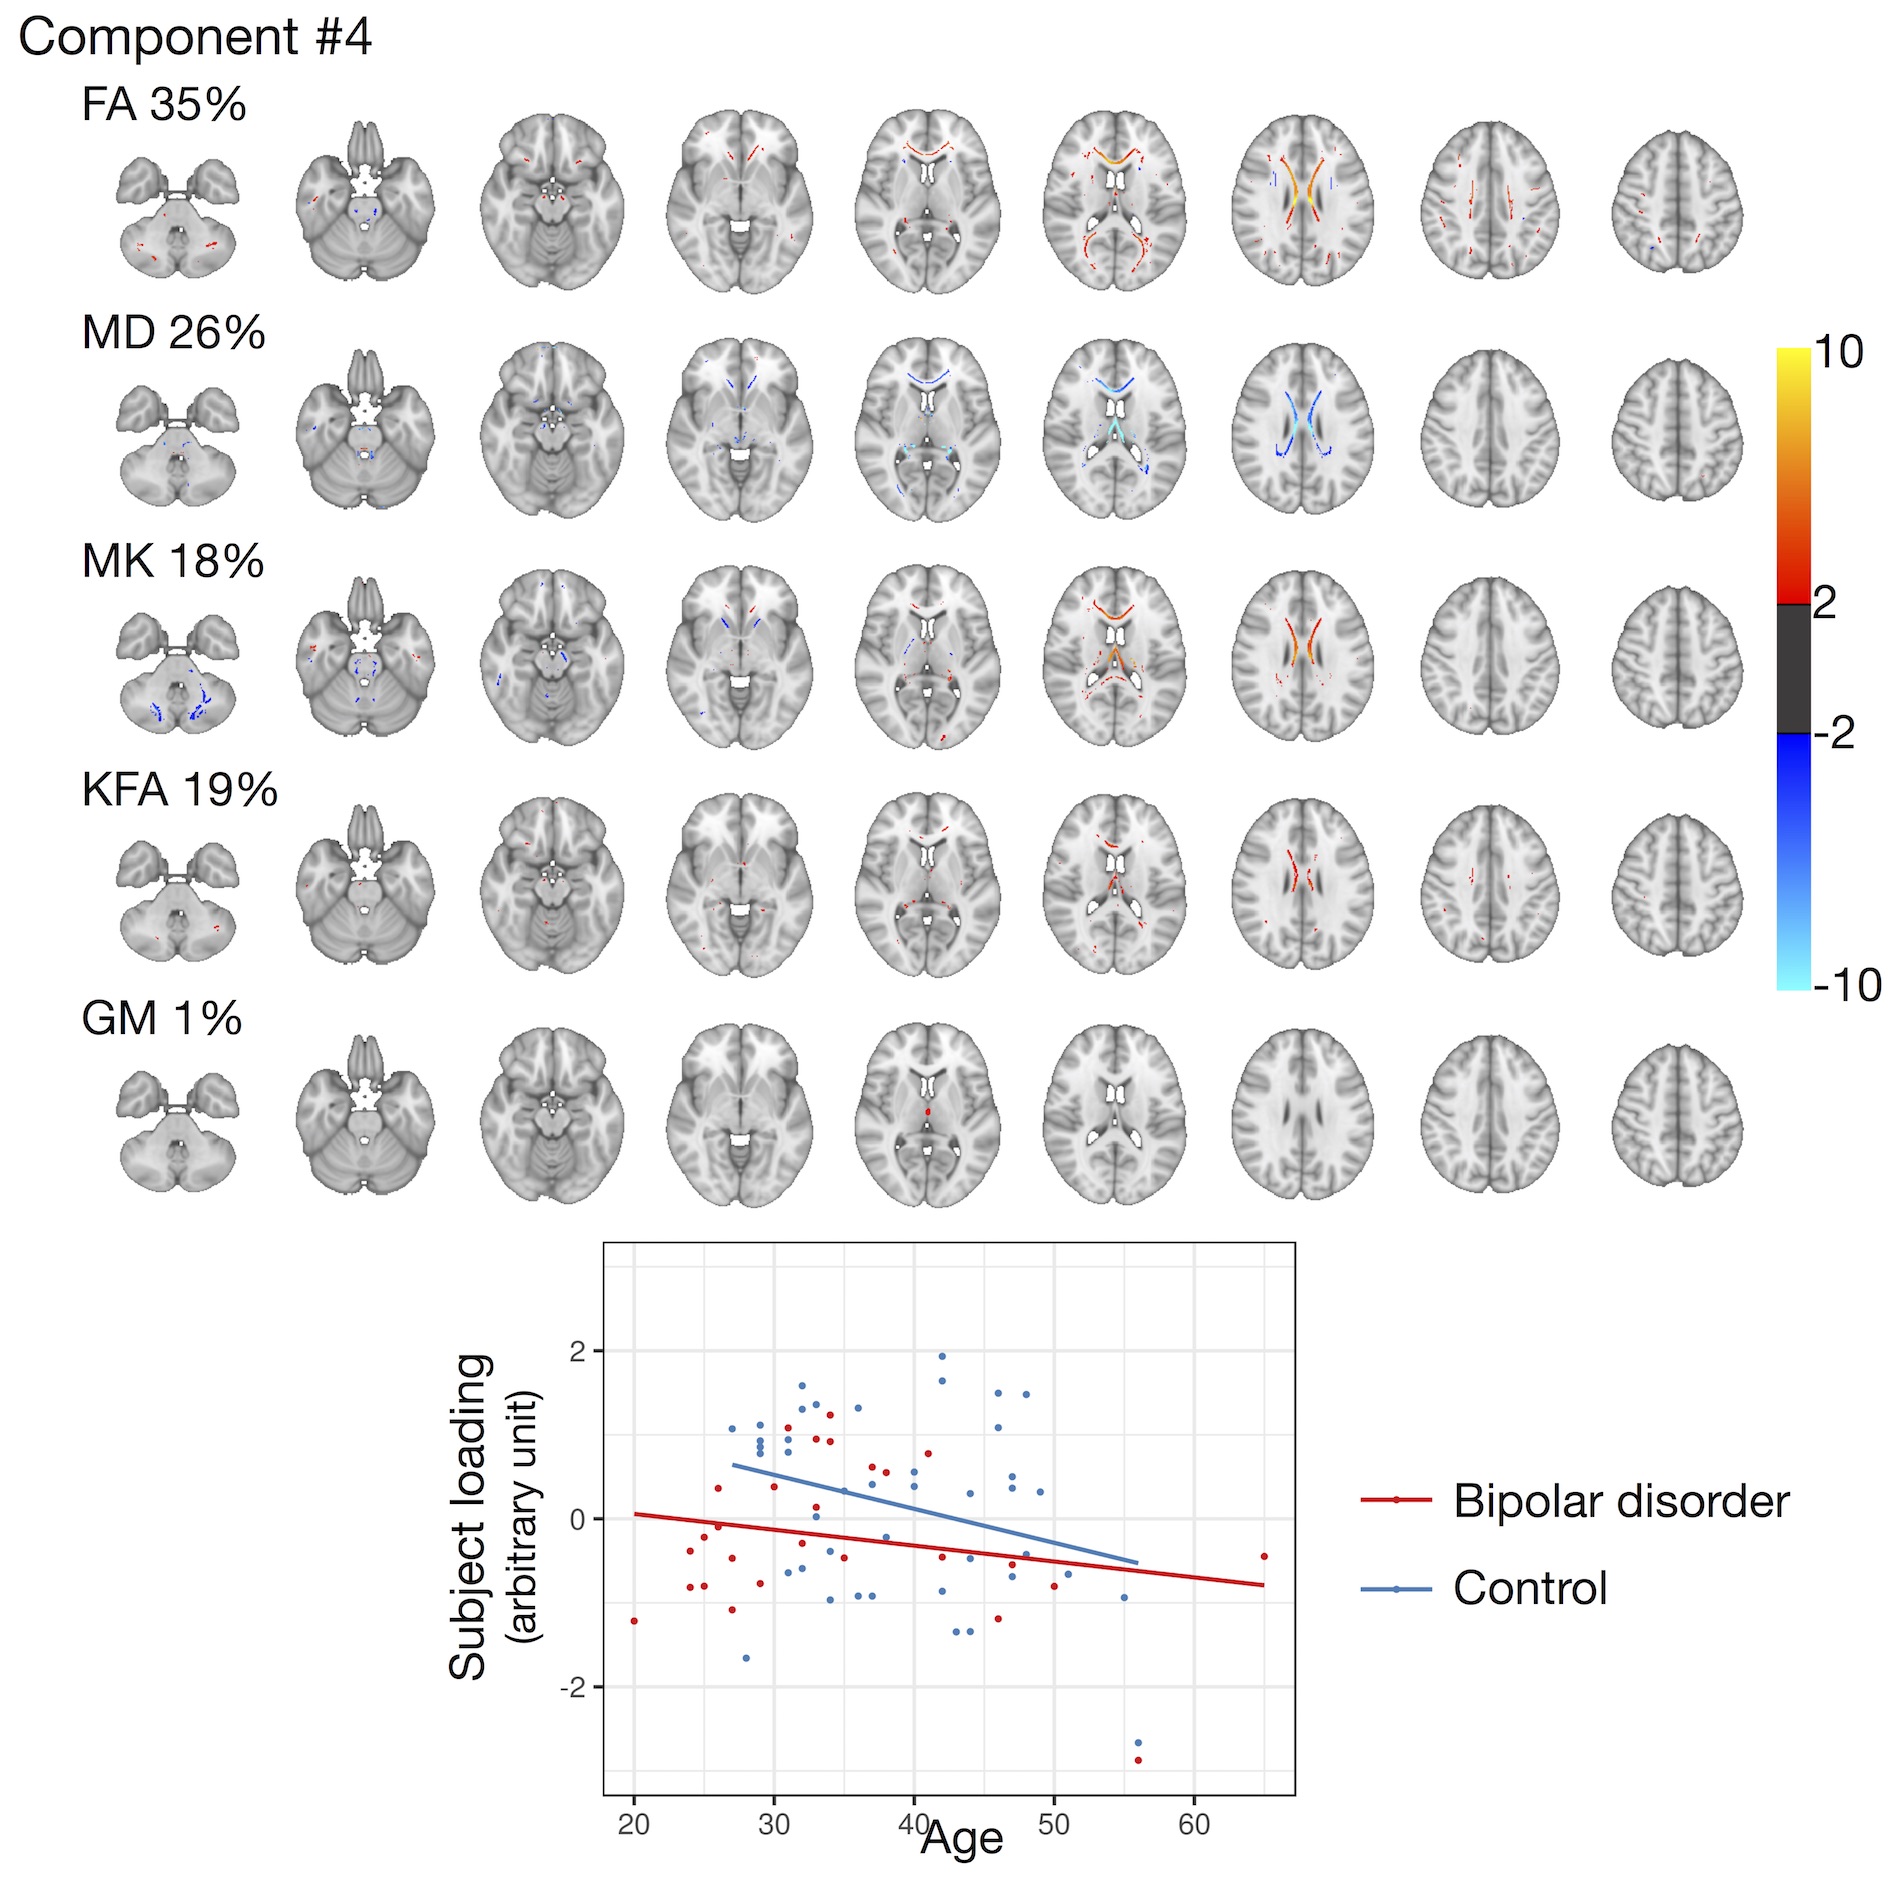
Nine independent components were identified. Figure 2 shows the relative weights of the examined measures in each component, as well as the effect size of diagnosis. We found significant effect of diagnosis on two components (Component #3 and #6, p = 0.004 and 0.01, respectively) (Figures 3&4). We had another component indicating smaller FA in the corpus callosum of the patients, though this did not survive after correction for multiple comparisons (Component #4, Figure 5).Discussion and Conclusion
Data-driven feature extraction identified components that showed linked behavior in the multivariate space. Two components were sensitive to disease-related abnormalities, and these were driven by the diffusion metrics of white matter regions including the prefrontal-striatal-thalamic pathways, cerebellum, and medial temporal lobes (Figures 3&4). The present observation is consistent with the concept that BD is caused by disruption of the emotion control circuit formed by these anatomical structures,3,4 as well as with the previous DKI study that analyzed the cerebellum of patients with BD.19
The components capturing effect of diagnosis were dominated by the DKI measures, which suggests studying the white matter with DKI possibly enhances our sensitivity to brain abnormalities in BD, compared to DTI. The role of white matter in BD is now attracting increasing attentions,1,2 and such gain in sensitivity is expected to aid, for example, machine-learning approaches20,21 and investigation of heterogeneity under the same diagnostic category.22 Though not specific, smaller MK values observed in BD are in agreement with the histological studies that showed loss of oligodendrocytes and reduction of myelin.1,2 Also noteworthy is the opposite trend seen in a few regions, like anterior limb of the internal capsule and subcortical white matter of the medial orbito-frontal cortices (Figure 3), since these structures are also involved in the emotion control circuit3,4,23. Indeed, some studies suggested compensatory re-myelination occurring in the frontal cortical/subcortical region of patients with BD.2 Studying such (anti-)correlation among different measures as well as different anatomical locations may lead us to a more comprehensive understanding of the disease mechanism.
Acknowledgements
This study was partly supported by Japan Society for the Promotion of Science (JSPS) KAKENHI [Grant Number 16H06395, 16H06399, 16K21720, 17H04244, 18K07729, and Advanced Bioimaging Support [Grant Number 16H06280]], the Brain Mapping by Integrated Neurotechnologies for Disease Studies (Brain/MINDS), Integrated Research on Depression, Dementia and Development disorders by the Strategic Research Program for Brain Sciences from the Japan Agency for Medical Research and Development, AMED, UTokyo Center for Integrative Science of Human Behavior (CiSHuB), and International Research Center for NeuroIntelligence (IRCN).References
1. Mahon K, Burdick KE, Szeszko PR. A role for white matter abnormalities in the pathophysiology of bipolar disorder. Neurosci Biobehav Rev. 2010;34(4):533-54.
2. Bellani M, Boschello F, Delvecchio G, et al. DTI and myelin plasticity in bipolar disorder: integrating neuroimaging and neuropathological findings. Front Psychiatry. 2016;7:21.
3. Phillips ML, Swartz HA. A critical appraisal of neuroimaging studies of bipolar disorder: toward a new conceptualization of underlying neural circuitry and a road map for future research. Am J Psychiatry. 2014;171(8):829-43.
4. Strakowski SM, Adler CM, Almeida J, et al. The functional neuroanatomy of bipolar disorder: a consensus model. Bipolar Disord. 2012;14(4):313-25.
5. Blond BN, Fredericks CA, Blumberg HP. Functional neuroanatomy of bipolar disorder: structure, function, and connectivity in an amygdala-anterior paralimbic neural system. Bipolar Disord. 2012;14(4):340-55.
6. Kempton MJ, Geddes JR, Ettinger U, et al. Meta-analysis, database, and meta-regression of 98 structural imaging studies in bipolar disorder. Arch Gen Psychiatry. 2008;65(9):1017-32.
7. Hibar DP, Westlye LT, Doan NT, et al. Cortical abnormalities in bipolar disorder: an MRI analysis of 6503 individuals from the ENIGMA Bipolar Disorder Working Group. Mol Psychiatry. 2018;23(4):932-942.
8. Nortje G, Stein DJ, Radua J, et al. Systematic review and voxel-based meta-analysis of diffusion tensor imaging studies in bipolar disorder. J Affect Disord. 2013;150(2):192-200.
9. Lewandowski KE, Ongür D, Sperry SH, et al. Myelin vs axon abnormalities in white matter in bipolar disorder. Neuropsychopharmacology. 2015;40(5):1243-9.
10. Calhoun VD, Sui J. Multimodal fusion of brain imaging data: A key to finding the missing link(s) in complex mental illness. Biol Psychiatry Cogn Neurosci Neuroimaging. 2016;1(3):230-244.
11. Pasternak O, Kelly S, Sydnor VJ, et al. Advances in microstructural diffusion neuroimaging for psychiatric disorders. Neuroimage. 2018;182:259-282.
12. Groves AR, Beckmann CF, Smith SM, et al. Linked independent component analysis for multimodal data fusion. Neuroimage. 2011;54(3):2198-217.
13. Tabesh A, Jensen JH, Ardekani BA, et al. Estimation of tensors and tensor-derived measures in diffusional kurtosis imaging. Magn Reson Med. 2011;65(3):823-36.
14. Veraart J, Novikov DS, Christiaens D, et al. Denoising of diffusion MRI using random matrix theory. Neuroimage. 2016;142:394-406.
15. Kellner E, Dhital B, Kiselev VG, et al. Gibbs-ringing artifact removal based on local subvoxel-shifts. Magn Reson Med. 2016;76(5):1574-1581.
16. Andersson JLR, Sotiropoulos SN. An integrated approach to correction for off-resonance effects and subject movement in diffusion MR imaging. Neuroimage. 2016;125:1063-1078.
17. Minka TP. Automatic choice of dimensionality for PCA. NIPS. 2000:598-604.
18. Winkler AM, Ridgway GR, Webster MA, et al. Permutation inference for the general linear model. Neuroimage. 2014;92:381-97.
19. Zhao L, Wang Y, Jia Y, et al. Cerebellar microstructural abnormalities in bipolar depression and unipolar depression: A diffusion kurtosis and perfusion imaging study. J Affect Disord. 2016;195:21-31.
20. Librenza-Garcia D, Kotzian BJ, Yang J, et al. The impact of machine learning techniques in the study of bipolar disorder: A systematic review. Neurosci Biobehav Rev. 2017;80:538-554.
21. Janssen RJ, Mourão-Miranda J, Schnack HG. Making individual prognoses in psychiatry using neuroimaging and machine learning. Biol Psychiatry Cogn Neurosci Neuroimaging. 2018;3(9):798-808.
22. Wolfers T, Doan NT, Kaufmann T, et al. Mapping the heterogeneous phenotype of schizophrenia and bipolar disorder using normative models. JAMA Psychiatry. 2018. doi: 10.1001/jamapsychiatry.2018.2467. [Epub ahead of print]
23. Coenen VA, Schumacher LV, Kaller C, et al. The anatomy of the human medial forebrain bundle: Ventral tegmental area connections to reward-associated subcortical and frontal lobe regions. Neuroimage Clin. 2018;18:770-783.
Figures