2688
Differences in Brain Microstructural Alterations between Bipolar and Major Depression Revealed by Diffusion Kurtosis Imaging1Hokkaido University Graduate School of Biomedical Science and Engineering, Sapporo, Japan, 2Department of Diagnostic and Interventional Radiology, Hokkaido University Hospital, Sapporo, Japan, 3Hokkaido University Hospital, Sapporo, Japan, 4Department of Radiation Medicine, Hokkaido University Graduate School of Medicine, Sapporo, Japan
Synopsis
This prospective study evaluated if bipolar and major depression patients had microstructural brain alterations detectable on DKI. The results showed significant alterations in these patients, of which some clusters correlated with clinical symptoms. Mean kurtosis also differed significantly between the two groups.
Background and Purpose
Treatment regimens differ between bipolar (BD′) and major depression (MD′), as are the typical clinical presentations. However, there are occasions that these two diseases are hard to distinguish. For instance, a patient with BD may present only with depression symptoms so that it is clinically indistinguishable from MD. Quantitative diagnostic markers that can distinguish these two conditions are thus desirable. To date, there have been reports on diffusion tensor (DTI) and diffusion kurtosis imaging (DKI) which document altered fractional anisotropy (FA) and mean kurtosis (MK) of cerebral and cerebellar white matter in these patients. It is thus possible that these diffusion imaging indices can become potential diagnostic markers for these conditions. Although microstructural alterations of the individual condition are reported, very scarce have been explored if these alterations vary between these two conditions. This prospective study was aimed to evaluate if DKI can detect the microstructural abnormalities in these conditions and if the alterations observable varied between the two conditions.Methods
This prospective study included 11 BD patients, 14 MD patients and 16 age and gender-matched normal volunteers. DKI was acquired using a 3T scanner and the following scan parameters: TR/TE = 5051/85 ms, NEX = 1, b = 0, 1000, 2000 s mm-2, 32 diffusion directions. 3D-T1WI, axial T2WI and FLAIR imaging were also acquired for anatomical information and to rule out gross abnormalities. Mean kurtosis (MK), mean diffusivity (MD) and their radial and axial measures (i.e., radial kurtosis, RD; axial kurtosis, AK; radial diffusivity, RD; axial diffusivity, AD), were extracted from the DKI dataset (DKE2.6). Following spatial normalization, voxels with differences in these quantitative indices were identified by using one-way ANOVA and post-hoc t-tests (SPM12). P<0.001 was considered statistically significant for clusters containing at least 50 voxels. Clusters of the patients with significant differences in quantitative indices from normal subjects were further tested for correlation with scores that assess disease severity, using Pearson's product-moment correlation analysis. These scores included global assessment of functioning (GAF), Montgomery-Asberg depression rating scale (MADRS), Young mania rating scale (YMRS) and Hamilton depression rating scale (HAM-D). P<0.01 was considered as statistically significant, for correlation analysis.Results and Discussion
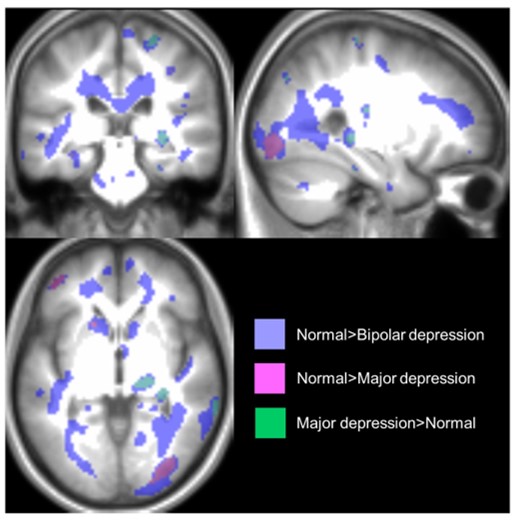
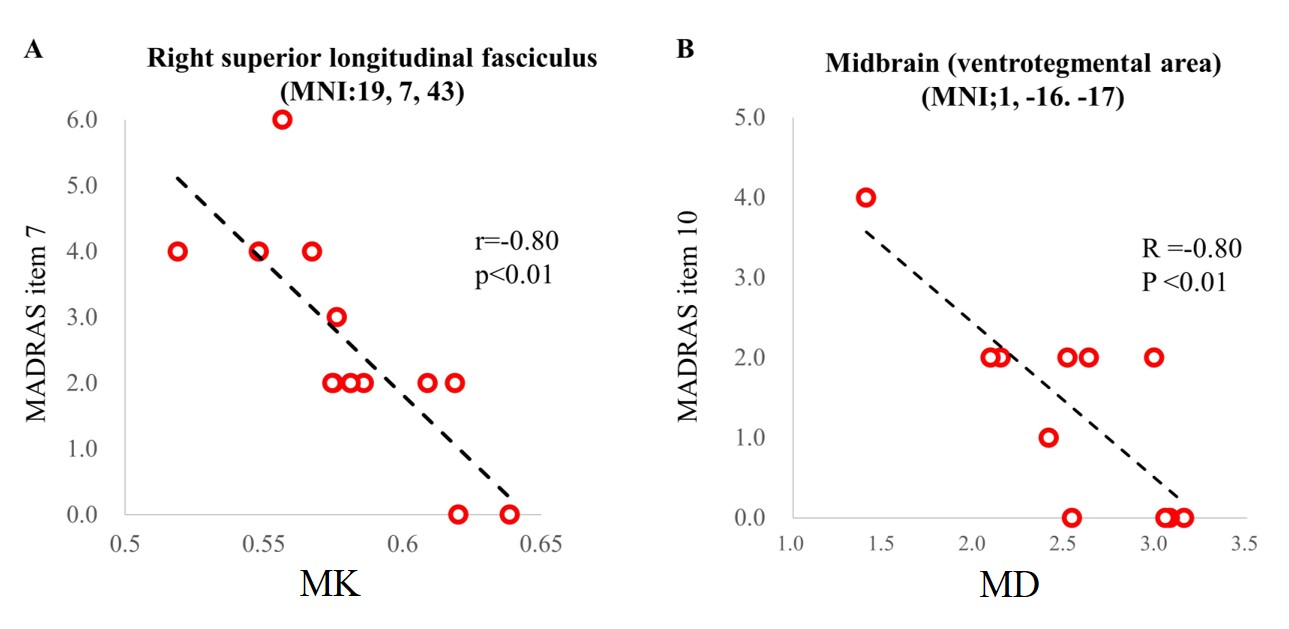
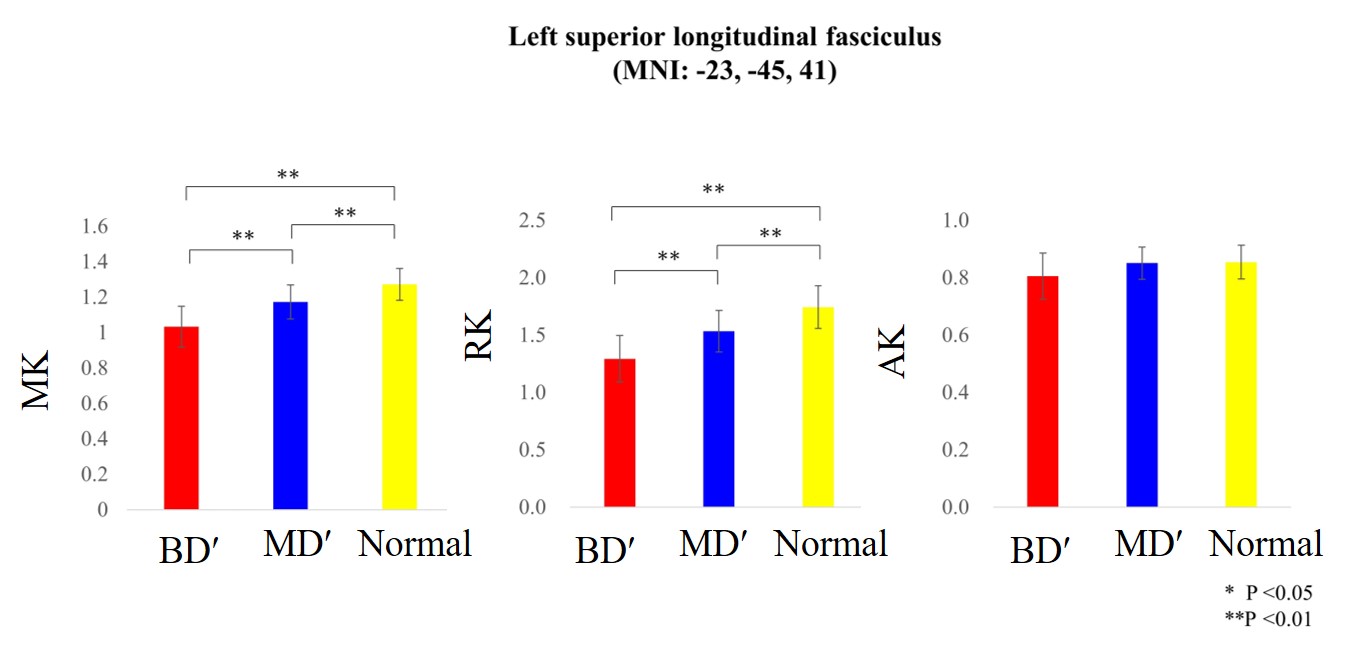
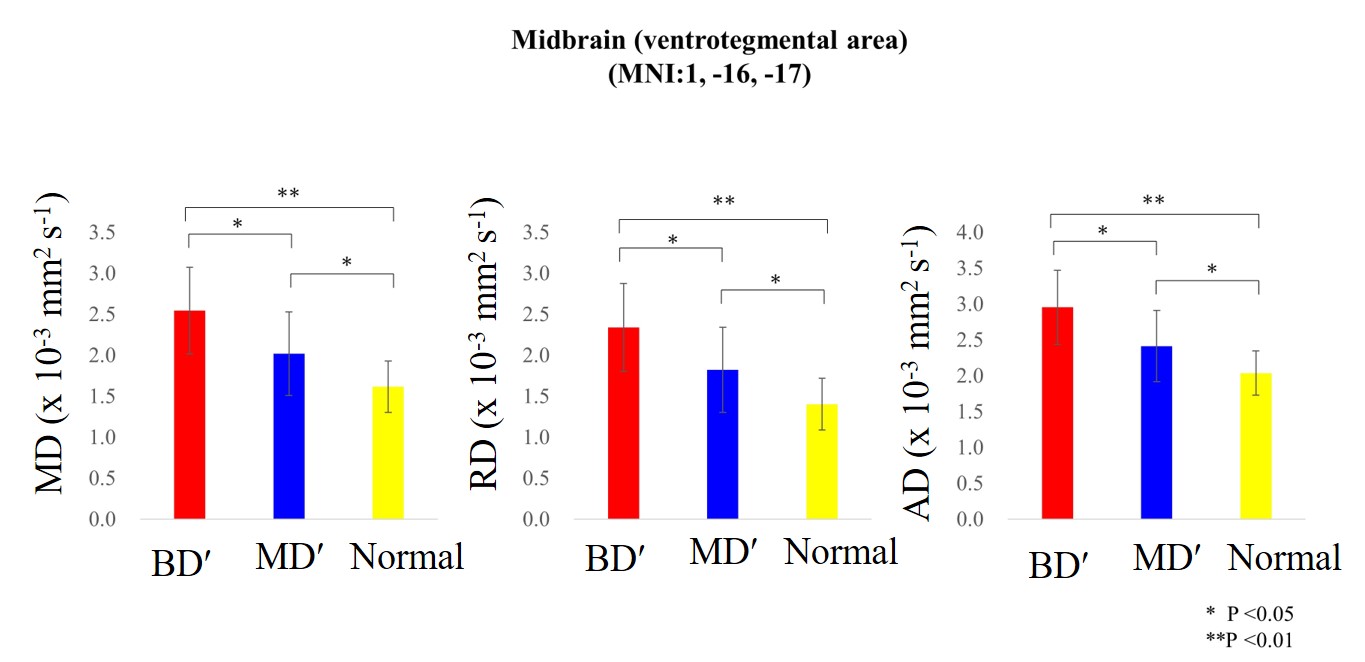
One way ANOVA tests revealed several clusters with altered DKI indices in both patient groups. Alterations of MK were more prominent than the other indices. The clusters which revealed significant difference in MK included bilateral superior longitudinal fasciculi, corpus callosum, bilateral angular gyri and right visual association area (Fig 1). Among these clusters, MK of the right superior longitudinal fasciculus (MNI coordinates: X =19, Y = 7, Z = 43) of MD′ patients and MD of the midbrain of BD′ patients (MNI coordinates: X =1, Y = -16, Z = -17) showed significant negative correlation with MADRS (Item 7 and Item 10, respectively; Note; item 10 evaluates suicidal thoughts.) (Fig 2). The MK alterations were preferentially derived from the RK alterations, that is the AK alterations were subtle (Fig 3). However, MD alterations appeared to derive from alterations in both RD and AD (Fig 4). It was also observed that the MK of the right angular gyrus (BA39) significantly differed between the two patient groups -- suggesting the possibility of distinguishing the two conditions by the local MK values. A decrease in MK is generally considered as a decrease in microstructural complexity, which in turn may be attributed by a diminution in neuronal or axonal size or number or dendritic pruning.
Conclusions
Microstructural brain alterations in BD′ and MD′ patients are observable by DKI. Correlation of altered DKI indices with psychiatric symptoms suggests the potential clinical applicability of these indices in the evaluation of these disorders. BD′ and MD′ may be distinguished by their MK values of right angular gyrus.
Acknowledgements
No acknowledgement found.References
- Kamiya K, Okada N, Sawada K, Watanabe Y, Irie R et al. Diffusional kurtosis imaging and white matter microstructure modeling in a clinical study of major depressive disorder. NMR Biomed. 2018 Jul; 31(7): e3938.
- Bellani M, Boschello F, Delvecchio G, Dusi N, Alfredo C et al. DTI and Myelin Plasticity in Bipolar Disorder: Integrating Neuroimaging and Neuropathological Findings. Front Psychiatry. 2016; 7: 21
- Zhao L, Wang Y, Jia Y, Zhong S, Sun Y, Zhou Z, Zhang Z, Huang L. Microstructural Abnormalities of Basal Ganglia and Thalamus in Bipolar and Unipolar Disorders: A Diffusion Kurtosis and Perfusion Imaging Study. Psychiatry Investig. 2017 ;14(4):471-482.
- Nestler EJ, Carlezon WA Jr. The mesolimbic dopamine reward circuit in depression. Biol Psychiatry. 2006 ;59: 1151–1159
- Blood AJ, Iosifescu DV, Makris N, Perlis RH, Kennedy DN et al. Microstructural Abnormalities in Subcortical Reward Circuitry of Subjects with Major Depressive Disorder. PLoS One. 2010 Nov 29;5(11):e13945.
Figures