2681
7 Tesla Phase Sensitive Imaging of Brain Regions with Metabolic Alterations in Major Depressive Disorder1Radiology and Biomedical Imaging, UCSF, San Francisco, CA, United States, 2UCSF, San Franciwsco, CA, United States, 3Psychiatry, UCSF, San Francisco, CA, United States
Synopsis
Ultra high-field phase sensitive imaging can help elucidate subtle changes in brain iron content. Recent research implicates brain iron deposition in the pathophysiology of major depressive disorder (MDD). Our previous work involving MDD patients detected symptom-related metabolic alterations in deep brain structures and anterior cingulate cortex. In our current analysis, we apply 7T phase sensitive imaging in these same brain regions to evaluate the role of iron accumulation in neurocognitive and depressive symptoms in this vulnerable population.
Introduction
Increasing evidence suggests a role for brain iron deposition in the neurocognitive and depressive symptoms of major depressive disorder (MDD) (1). Researchers have also described relationships between brain iron and metabolic markers (2). We previously identified metabolic alterations related to mood and cognition in the anterior cingulate and basal ganglia in MDD patients treated with mindfulness-based cognitive therapy (MBCT) (3). In the current study, we applied 7 Tesla phase sensitive imaging in these same brain regions to evaluate the role of iron in mood and neurocognitive changes in this vulnerable population.Methods
Study Design
Fourteen unmedicated patients who met the DSM-IV criteria for MDD (11F/3M, 35+10 years) received eight weeks of MBCT. MBCT is a group-based intervention that integrates mindfulness meditation and traditional cognitive behavioral therapy (CBT) techniques. Neuroimaging and evaluation of depressive and neurocognitive symptoms were performed before and after treatment in the MDD group. Ten healthy controls (7F/3M, 32±9 years) had 7T MRI scans and neurocognitive evaluations at the baseline timepoint. All subjects consented to the study in accordance with the requirements of the UCSF Committee on Human Research.
Neurocognitive and Depressive Symptom Evaluation
Depressive symptoms were evauated using the HDRS-17 (4). The neurocognitive evaluation included the following standardized assessments: Stroop Color Word Test, Controlled Oral Word Association Test (COWAT), Digit Symbol and Digit Span Tests, and Hopkins Verbal Learning Test (HVLT).
Neuroimaging Data Acquisition
All MRI scans were performed on a GE 7T MR950 scanner (GE Healthcare, Chicago, IL, USA) using a 32 channel head coil (Nova Medical, Wilmington, MA, USA). 7T GRE data were acquired with TR/TE=250 ms/12.5 ms, flip angle 15°, FOV 22 cm, acquisition matrix 1024 × 768, 4 mm slice thickness and a scan time of 6:28 minutes.
Data Processing and Analysis
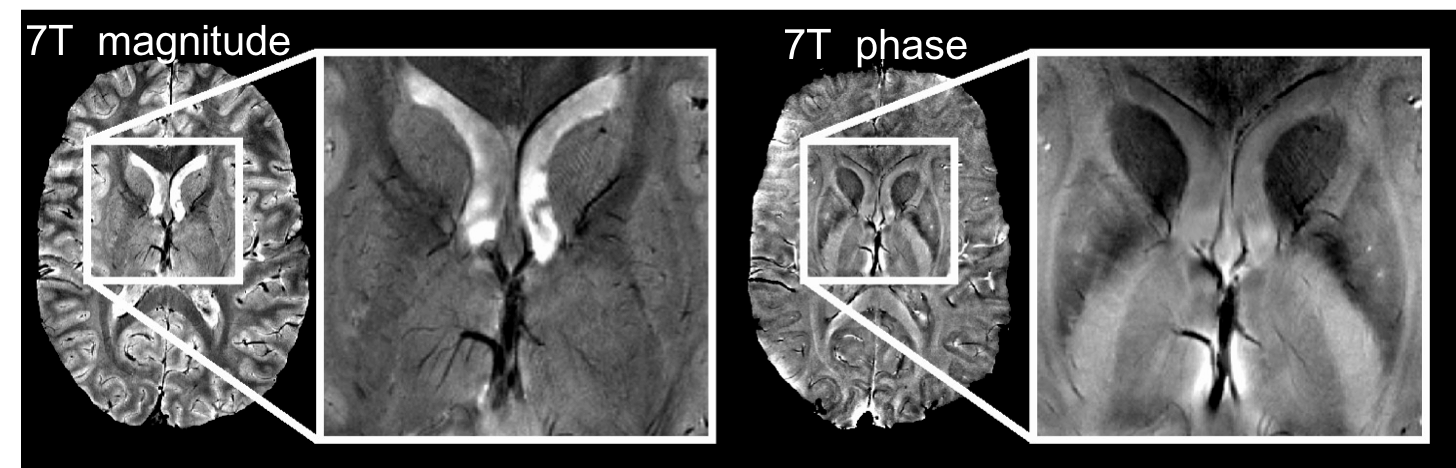
GRE data were processed as previously described (5) to generate both magnitude and phase images (Figure 1). Regions of interest (ROIs), including anterior cingulate cortex (ACC), caudate, putamen, globus pallidus and thalamus, were manually drawn on GRE phase images. Local phase shift (LPS) values were calculated by subtracting the mean phase of the posterior limb of the internal capsule (the control region) for each subject and dividing by the gyromagnetic ratio times the B0 field from the GRE phase images for each ROI. A Spearman’s test was used to correlate changes in the LPS with HDRS-17, and an ANOVA test was used for evaluating neurocognitive measures with age and education as the co-variates.
Results
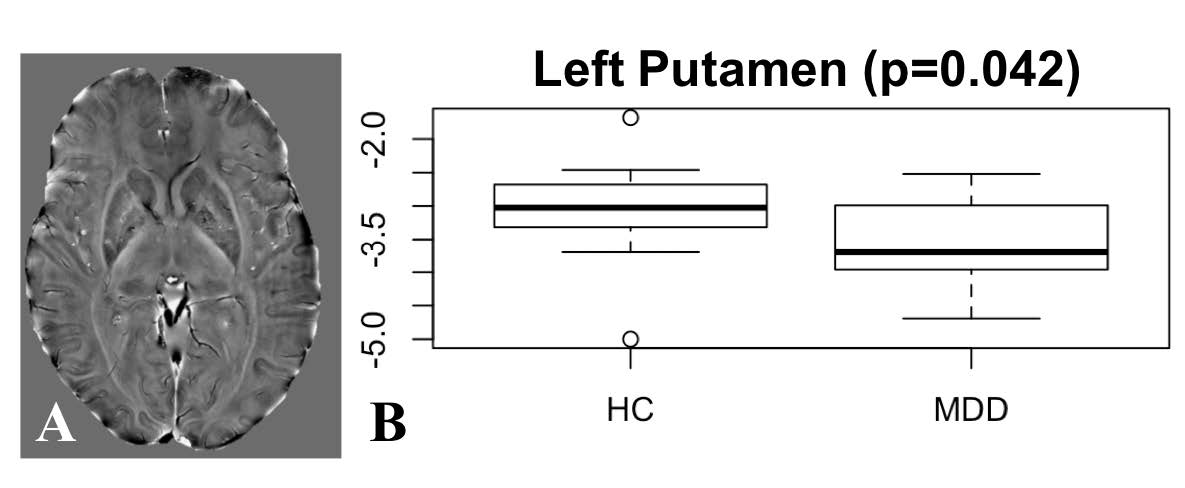
We found a significant difference in LPS values in the left putamen (p=0.042; Figure 2) and left globus pallidus (p=0.045) between patients and controls. In the MDD group, the severity of depression was negatively associated with LFS values in the ACC (p=0.044, r= -0.480). LFS values in the ACC (HVLT, p=0.019), putamen (HVLT, p=0.082) and thalamus (Wais digital span backward, p=0.022) were significantly associated with neurocognitive measures at baseline after adjusting for age and education. As reported previously, all MDD patients had improved depression scores after treatment (6/14 reduced by > 50%, overall range 11-75%).Discussion
In this pilot study, we have identified significant relationships between LSF values obtained from 7T phase sensitive imaging (putative iron accumulation) and neurocognitive and depressive symptoms in MDD in brain regions where we previously found metabolic alterations using our ultra high-field spectroscopy techniques. For example, in the current study we detected a significant difference is LFS values between patients and healthy controls in the left putamen where we previously found reduced levels of glutathione (3), a metabolite which has also been implicated in oxidative stress. One possibility is that decreased glutathione levels relate to oxidative damage caused by the accumulation of iron-dependent reactive oxygen species. Interestingly, our current study also identified a correlation between HVLT scores and LFS values in the ACC, a region where we previsously found a significant association between N-acetyl-aspartate measures and improvements in depression severity. These and other concurrent differences in iron accumulation and metabolite levels in the same brain regions in this population of MDD patients suggests the necessity for future analyses to directly examine the complex interplay between phase and spectral data and its neurobiological substrates. Our current application of 7T phase sensitive imaging in patients with MDD highlights the potential contribution of brain iron content to MDD symptoms. We hope that our results, combined with those of other research, ultimately lead to improved treatment options for this vulnerable population.Acknowledgements
This pilot study was supported by GE Healthcare. We would also like to thank the study participants for making this research possible.References
1. Yao S, Zhong Y, Xu Y, Qin J, Zhang N, Zhu X, Li Y. Quantitative susceptibility mapping reveals an association between brain iron load and depression severity. Front Hum Neurosci. 2017; 11: 442.
2. Kim J, Wessling-Resnick M. Iron and mechanisms of emotional behavior. J Nutr Biochem. 2014 Nov;25(11):1101-1107.
3. Li Y, Jakary A, Gillung E, Eisendrath S, Nelson SJ, Mukherjee P, Luks T. Evaluating metabolites in patients with major depressive disorder who received mindfulness-based cognitive therapy and healthy controls using short echo MRSI at 7 Tesla. MAGMA. 2016 Jun;29(3):523-33.
4. Hamilton, M. Development of a rating scale for primary depressive illness. Br J Soc Clin Psychol, 1967. 6(4): p. 278-96.
5. Hammond KE, Metcalf M, Carvajal L, Okuda DT, Srinivasan R, Vigneron D, Nelson SJ, Pelletier D. Quantitative in vivo magnetic resonance imaging of multiple sclerosis at 7 Tesla with sensitivity to iron. Ann Neurol. 2008 Dec;64(6):707-13.
Figures