2673
Estimating hemodynamic response functions using motor task and resting-state EEG-fMRI data acquired during wakefulness with eyes open1Integrated Program in Neuroscience, McGill University, Montreal, QC, Canada, 2Graduate Program in Bioengineering and Biomedical Engineering, McGill University, Montreal, QC, Canada, 3School of Physical And Occupational Therapy, McGill University, Montreal, QC, Canada, 4Department of Bioengineering, McGill University, Montreal, QC, Canada
Synopsis
In this work, we quantify the fMRI hemodynamic response function (HRF) using task-based (motor) and resting-state EEG-fMRI. We developed a methodology that does not require any assumptions regarding the HRF shape or the relative contribution of different EEG spectral bands to obtain region-specific estimates of the HRF. During the motor task, the EEG β-band was found to have a more pronounced contribution to BOLD variations compared to other bands, and the HRF was mainly negative due to β-band desynchronization and post-movement β-rebound. During resting-state, the contribution of different EEG bands and the HRF estimates varied between subjects, possibly due to low SNR and differences in the subjects’ brain state.
Introduction
BOLD-fMRI has been widely used for studying brain activations to different tasks. However, the BOLD technique is only an indirect measurement of neuronal activity through a mechanism known as neurovascular coupling, which can be quantified in terms of the HRF.
HRF modelling was initially investigated using tasked-based fMRI1,2. Recently, techniques to retrieve the HRF from resting-state fMRI have been proposed3. These techniques assume that large amplitude events in the BOLD signal are neurally driven and therefore can be used to model the HRF4–6. However, this is not necessarily the case, as BOLD signal fluctuations are strongly influenced by physiological processes and motion.
Recent advances in data acquisition techniques have allowed estimation of the HRF from EEG-fMRI data. Most studies in the literature have dealt with modeling the HRF using data collected during task execution7 or resting-state conditions with eyes closed8. However, this results in amplification of the associated EEG bands. On the other hand, other studies provided evidence for significant contributions of different EEG bands to the BOLD signal during wakefulness with eyes open using invasive data in monkeys9. To investigate this in humans, we employed multivariate regression analysis and function expansions to obtain HRF estimates in different regions of interest (ROIs), using motor and eyes open resting-state EEG-fMRI data.
Methods
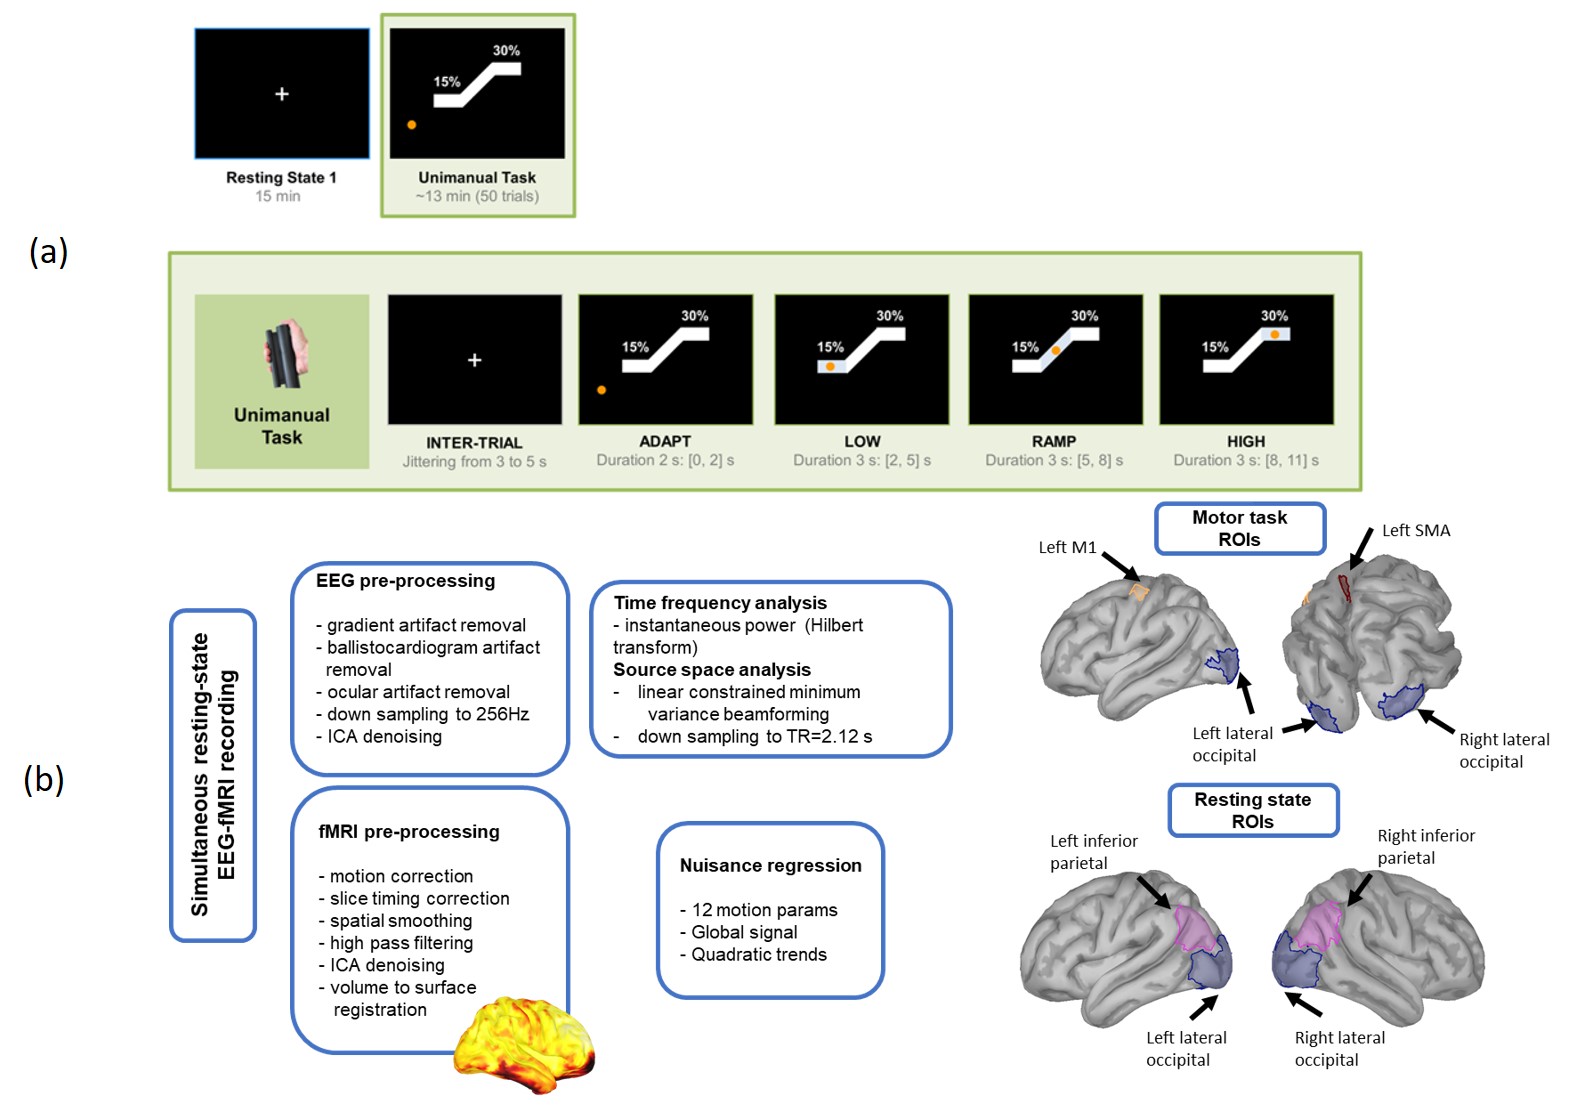
Simultaneous EEG-fMRI measurements were acquired from 7 subjects (Fig. 1). BOLD-fMRI data were acquired with a T2*-weighted gradient-echo EPI sequence (TR = 2120ms, Voxel size=3x3x4mm). EEG data were acquired using a 64-channel MR-compatible EEG system. Following data preprocessing (Fig. 1), the source space was reconstructed using the beamformer method. Instantaneous power time-series within the δ-, θ-, α-, and β-bands were obtained from the estimated sources using the Hilbert transform. Mean EEG source and fMRI time-series were obtained within ROIs (Fig. 1) in the cortex of each subject.
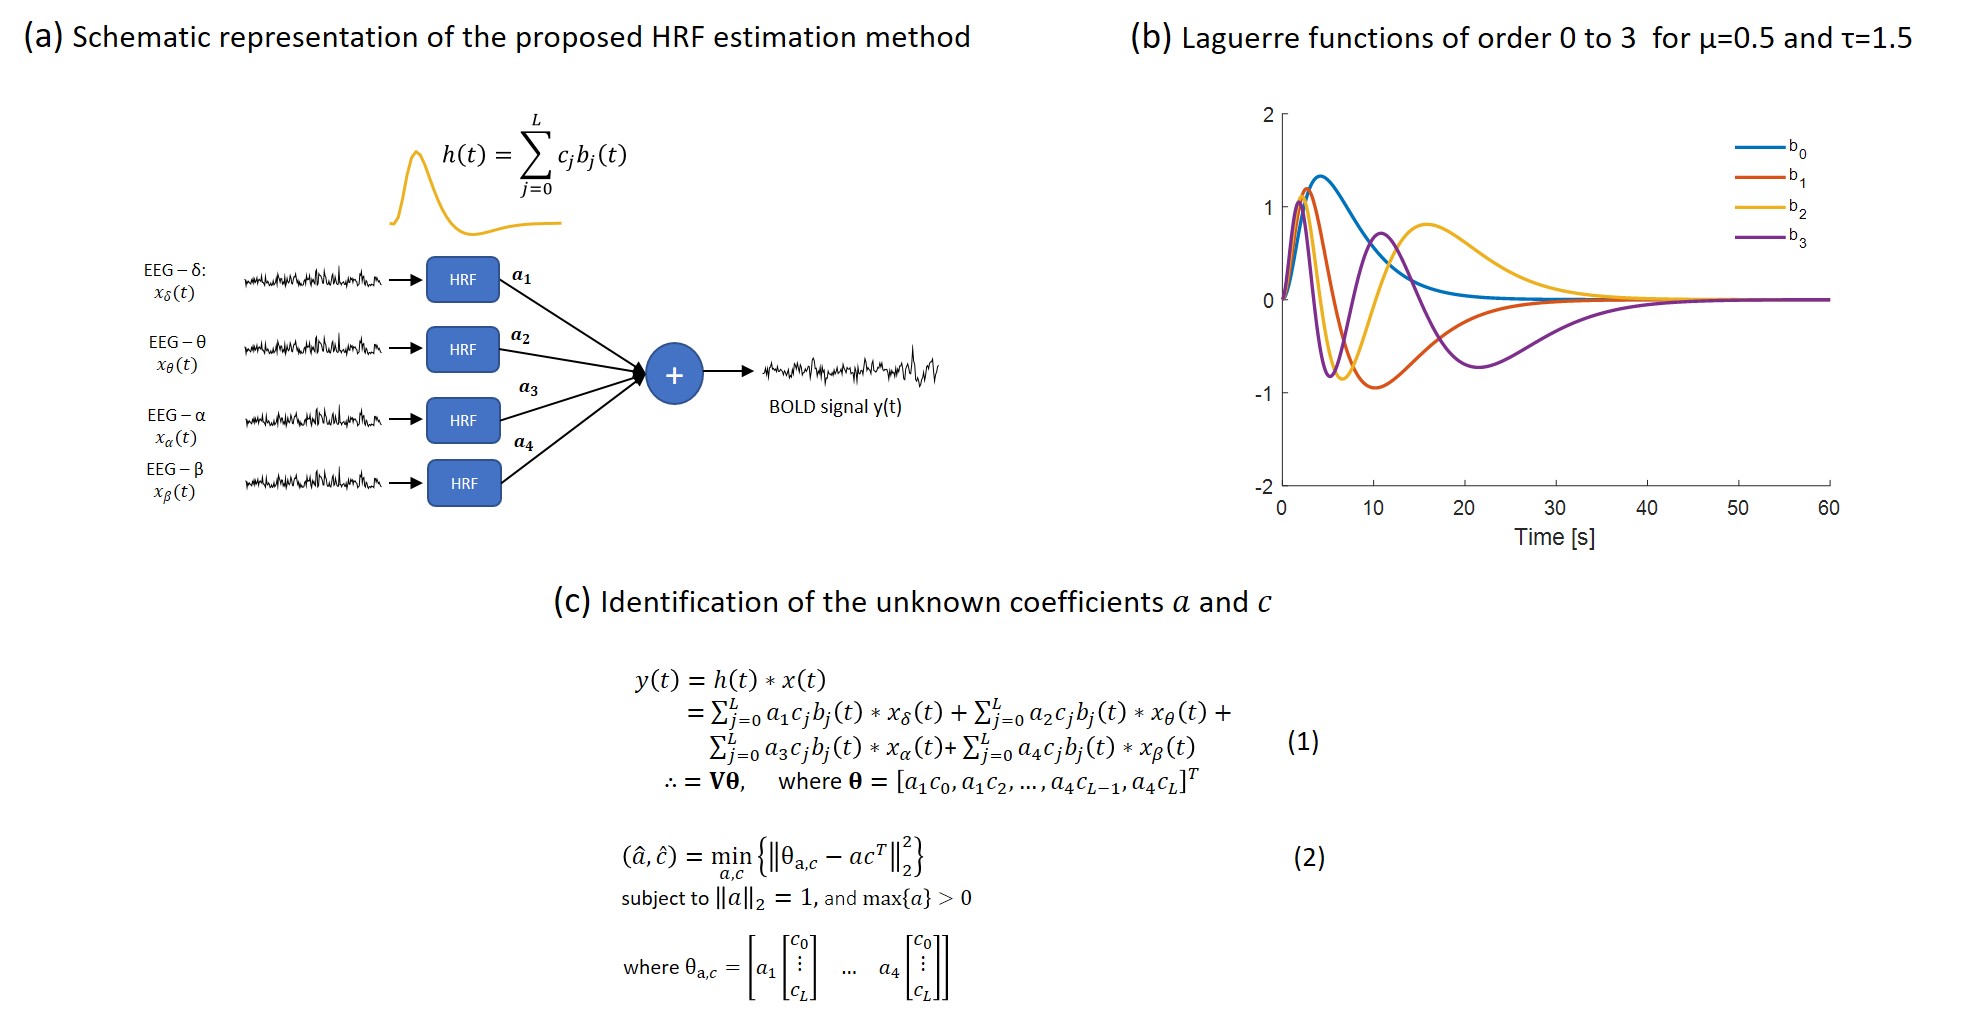
The basic steps of the proposed HRF estimation method are outlined in Fig. 4. The HRF in each ROI was estimated as a linear combination of $$$L+1$$$ Laguerre functions $$$\{b_{j}^{μ,τ}(t); \ j=0,…,L\}$$$ . The number $$$L$$$, as well as the parameters $$$μ,τ$$$, which control the peak location and exponential decay rate of the Laguerre functions, respectively, were determined as those achieving the minimum mean-squared prediction error. To account for the high correlations observed between the power of different EEG bands, the HRF in each ROI was estimated using partial-least squares regression.
Results
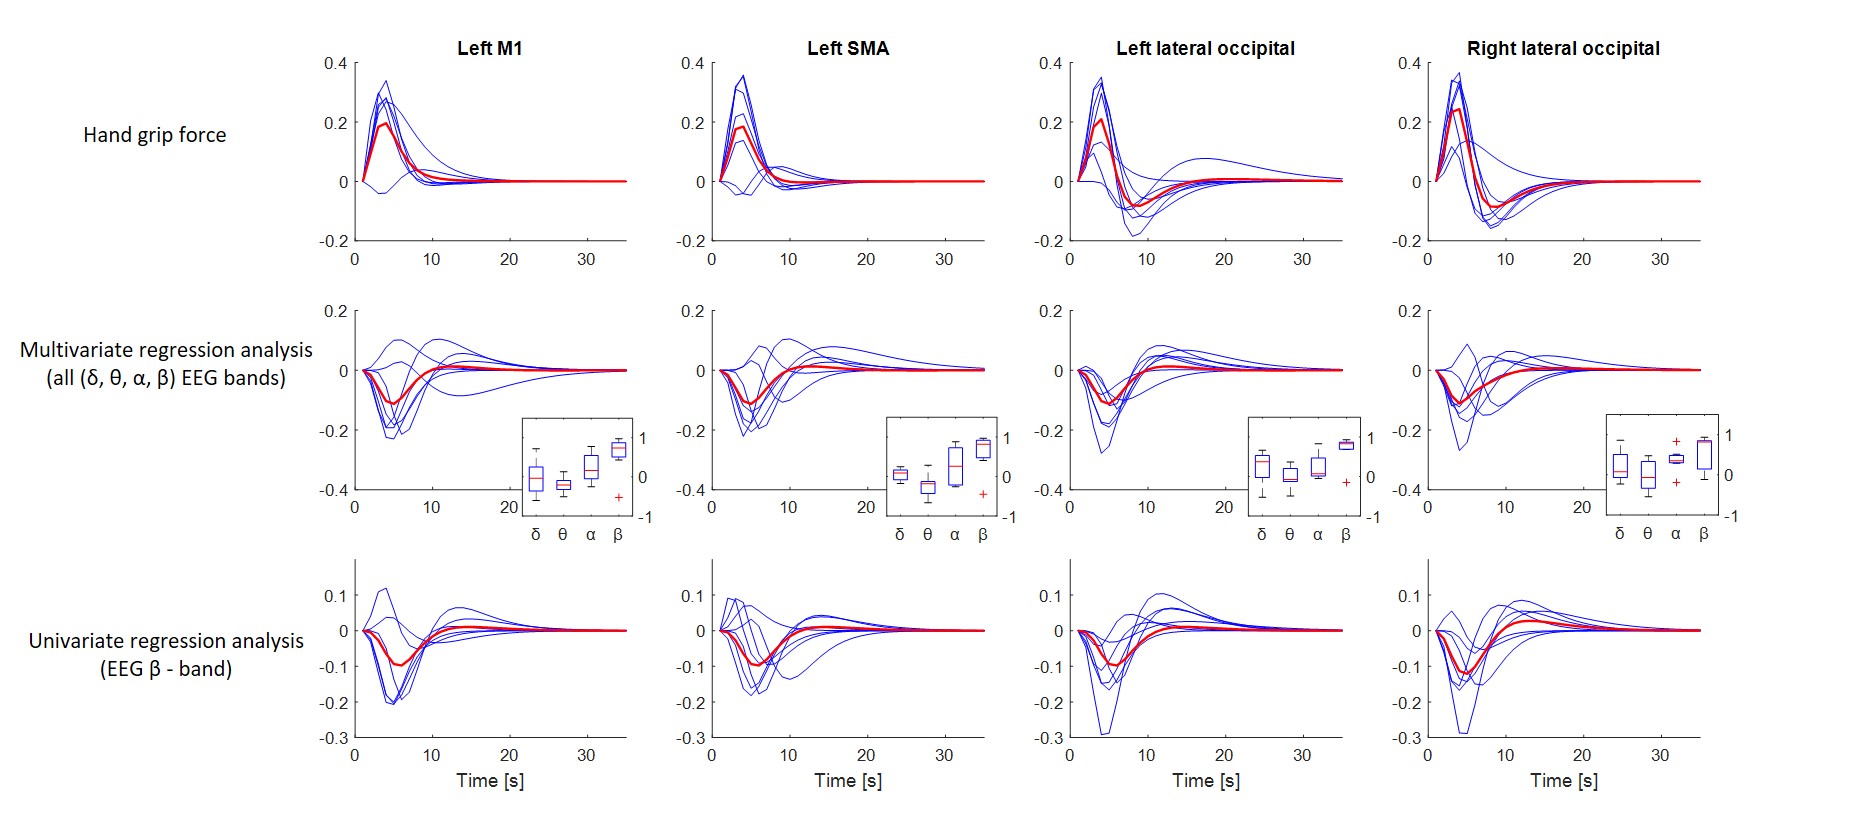
Fig. 2 shows HRF estimates obtained in four ROIs during the motor task. The top row shows estimates obtained using the hand grip time-series. The middle row shows HRF estimates obtained using the power in different EEG bands (θ,δ,α,β). The insets show box plots of the regression coefficients obtained for each EEG band. The median of each box plot suggests that the β-band had a more pronounced contribution to the BOLD signal compared to other bands. The bottom row shows HRF estimates obtained using univariate regression between power in the β-band and BOLD. In this case, the estimated HRF curves are similar to the curves obtained using all EEG bands, which also suggests that the β-band has a stronger effect on the BOLD signal.
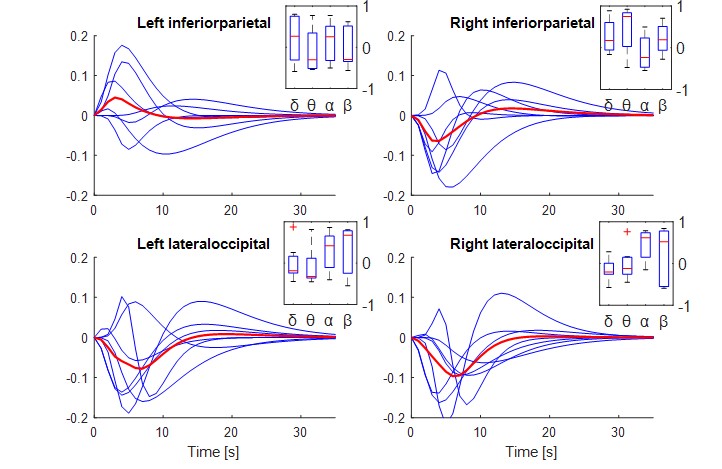
Fig. 3 shows HRF estimates obtained during resting-state. In this case, the HRF estimates were less consistent across subjects, possibly due to lower SNR. The insets show box plots of the regression coefficients obtained for each EEG band (p<0.05). The range of the regression coefficients in the box plots suggests that the contribution of each EEG band in explaining the BOLD signal varied considerably across subjects.
Discussion and conclusions
In this work, we proposed a method for HRF estimation using EEG-fMRI. The proposed model does not require any assumptions regarding the HRF shape or the relative contribution of different EEG bands. Using this, we observed contributions from all EEG bands in the BOLD, particularly in the case of resting state, in accordance with previous results9.
During the motor task, our results suggest stronger contributions from the β-band. In addition, the HRF estimates obtained using EEG were anticorrelated with the estimates obtained using the hand-grip time-series due to β-band desynchronization and post-movement β-rebound10,11. Our results obtained during resting-state suggest that the HRF in the occipital and parietal cortex is mainly negative, which agrees with similar findings in the literature8. However, these results were found to vary considerably across subjects. This is possibly due to the lower SNR associated with resting-state data, as well as differences in the subjects’ brain state, such as vigilance fluctuations12, which remains to be studied in future research. Future research also includes voxel-wise analysis of EEG-fMRI data using the proposed methodology aiming to investigate the spatiotemporal characteristics of neurovascular coupling in a higher spatial resolution.
Acknowledgements
No acknowledgement found.References
1. Handwerker, D. A., Ollinger, J. M. & D’Esposito, M. Variation of BOLD hemodynamic responses across subjects and brain regions and their effects on statistical analyses. Neuroimage 21, 1639–1651 (2004).
2. Lindquist, M. A., Meng Loh, J., Atlas, L. Y. & Wager, T. D. Modeling the hemodynamic response function in fMRI: efficiency, bias and mis-modeling. Neuroimage 45, 187–198 (2009).
3. Wu, G. R. et al. A blind deconvolution approach to recover effective connectivity brain networks from resting state fMRI data. Med. Image Anal. 17, 365–74 (2013).
4. Tagliazucchi, E., Balenzuela, P., Fraiman, D. & Chialvo, D. R. Criticality in large-scale brain fmri dynamics unveiled by a novel point process analysis. Front. Physiol. 3 FEB, (2012).
5. Petridou, N., Gaudes, C. C., Dryden, I. L., Francis, S. T. & Gowland, P. A. Periods of rest in fMRI contain individual spontaneous events which are related to slowly fluctuating spontaneous activity. Hum. Brain Mapp. 34, 1319–1329 (2013).
6. Karahanoǧlu, F. I., Caballero-Gaudes, C., Lazeyras, F. & Van De Ville, D. Total activation: FMRI deconvolution through spatio-temporal regularization. Neuroimage 73, 121–134 (2013).
7. Sato, J. R., Rondinoni, C., Sturzbecher, M., de Araujo, D. B. & Amaro, E. From EEG to BOLD: Brain mapping and estimating transfer functions in simultaneous EEG-fMRI acquisitions. Neuroimage 50, 1416–1426 (2010).
8. de Munck, J. C. et al. The hemodynamic response of the alpha rhythm: An EEG/fMRI study. Neuroimage 35, 1142–1151 (2007).
9. Goense, J. B. M. & Logothetis, N. K. Neurophysiology of the BOLD fMRI Signal in Awake Monkeys. Curr. Biol. 18, 631–640 (2008).
10. Pfurtscheller, G., Graimann, B., Huggins, J. E., Levine, S. P. & Schuh, L. A. Spatiotemporal patterns of beta desynchronization and gamma synchronization in corticographic data during self-paced movement. Clin. Neurophysiol. 114, 1226–1236 (2003).
11. Jurkiewicz, M. T., Gaetz, W. C., Bostan, A. C. & Cheyne, D. Post-movement beta rebound is generated in motor cortex: Evidence from neuromagnetic recordings. Neuroimage 32, 1281–1289 (2006).
12. Falahpour, M., Chang, C., Wong, C. W. & Liu, T. T. Template-based prediction of vigilance fluctuations in resting-state fMRI. Neuroimage 174, 317–327 (2018).
Figures