2669
MRI Evaluation of Cerebrovascular Reactivity in Obstructive Sleep Apnea1Department of Radiology, University of Pennsylvania, Philadelphia, PA, United States, 2Department of Neurology, University of Pennsylvania School of Medicine, Philadelphia, PA, United States, 3Division of Sleep Medicine, Department of Medicine, University of Pennsylvania, Philadelphia, PA, United States
Synopsis
Obstructive sleep apnea (OSA) is a chronic disorder caused by intermittent obstruction of the upper airways during sleep. OSA patients are prone to cardiovascular disease and stroke. Cerebrovascular reactivity (CVR) is an index to assess the degree of impairment of cerebrovascular regulation. Here, a breath-hold index (BHI) was introduced as a surrogate for CVR to evaluate subjects with OSA and their controls. Preliminary results from an ongoing study found BHI to be significantly elevated in OSA for both BOLD based regional, and global CBF. The results agree with a recent MRI-based CVR study using an exogenously administered hypercapnia stimulus.
Background and Motivation
Obstructive sleep apnea (OSA), a prevalent chronic disorder, is characterized by periodic cessation or reduction in breathing and subsequent cyclic desaturation of arterial blood. OSA-related hypoxemia and hypercapnia predispose subjects to cardiovascular disease and stroke.1 To assess the degree of impairment of cerebrovascular regulation, cerebrovascular reactivity (CVR), defined as the cerebral blood flow (CBF) response to a vasoactive stimulus, serves as an index of cerebral vessels’ ability to adapted to fluctuations in oxygen and carbon dioxide blood levels.2 The purpose of this study was to evaluate the hypothesis that OSA entails altered CVR expressed in terms of the breath-hold index (BHI).3, 4 Specifically, the response to a breath-hold challenge was evaluated both globally by phase-contrast flow measurement and voxel-wise via blood oxygenation level-dependent (BOLD) contrast.Methods
Participants were subjected to a vasodilatory stimulus paradigm consisting of five 24s breath-hold (BH) cycles, followed by 66 s of recovery, totaling 10 minutes of continuous scanning. Subjects were instructed to hold the breath after expiration. Thirty subjects with OSA (mean age 50.3 years, BMI 31.5, apnea–hypopnea index [AHI] 39.0) and 21 controls (mean age 48.6 years, BMI 31.0, AHI 2.8) were enrolled. The five successive BH cycles yielding BOLD contrast and total CBF (tCBF) were then averaged into 90s blocks. BHI was determined as the temporal change within the BH period (Fig. 1B). Two-sample t-tests were applied to determine significance of differences between paired variables in OSA and control groups, with P < 0.05 being considered statistically significant.
Imaging was performed at 3T (Siemens Prisma) using a 20-channel head coil. Imaging parameters for the BOLD protocol were: 3x3x3 mm3 voxel size, 40° flip angle, TR/TE = 760/30 ms repeated 800 times. BOLD data were spatially and temporally preprocessed by SPM12 and MATLAB, and subsequently normalized by the mean signal during the baseline period to obtain % functional contrast. Further, blood flow velocity and rate in the superior sagittal sinus (SSS) were determined via phase-contrast MRI, and upscaled to tCBF by using the information from a calibration scan in which velocity was measured once at baseline in the internal carotid and vertebral arteries.5, 6 Total CBF was then normalized to 100g of brain tissue. Phase-contrast (PC) MRI parameters were: 1x1x5 mm3 voxel size, flip angle of 15°, TR/TE=19/5.5 ms, VENC=76.42cm/sec, 446 successive measurements with effective temporal resolution of 1.3 s. MPRAGE images used for calculation of brain volume were segmented into grey and white matter using SPM12.
Results
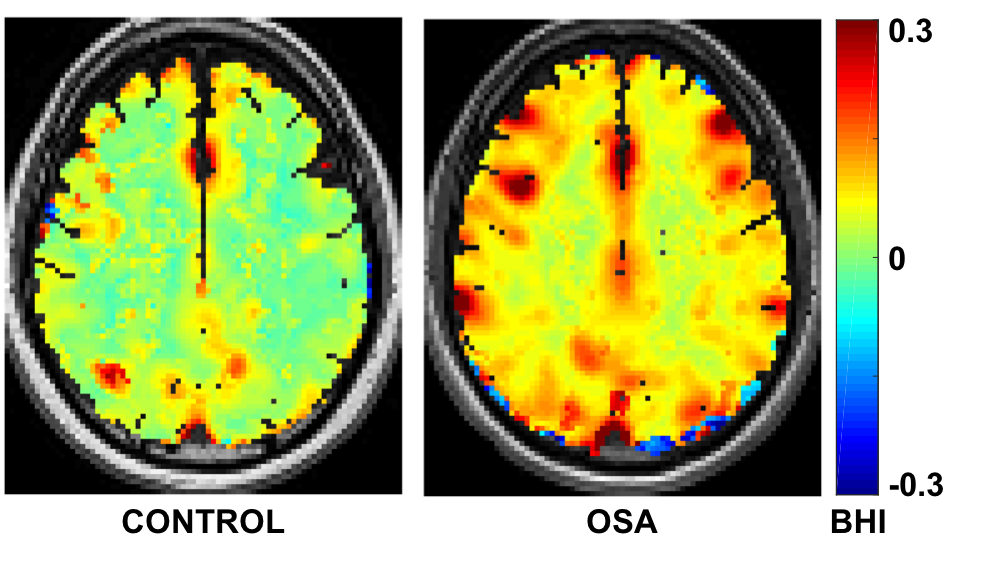
Table 1 lists the demographics of 30 OSA subjects and 21 matched controls, indicating no significant differences in age, weight, height, and BMI between groups. An example of a BOLD time-course in Figure 1A shows the response to the BH challenge averaged across the whole brain (blue), grey matter (black), and white matter (red). Averaged time-courses over five BH cycles are illustrated in Figure 1B. The BHI maps overlaid on their MPRAGE images in Figure 2 show greater CVR in OSA patients. Figure 3 displays group comparisons in three brain regions, indicating that BH indices in OSA were significantly greater than those in controls, with mean estimates of 0.19 vs. 0.15 %/s (P=0.02), 0.22 vs. 0.17 %/s (P=0.03), and 0.14 vs. 0.11 %/s (P=0.02), in whole brain/GM/WM, respectively. Compared with controls, subjects with OSA had significantly greater CVR when the BHI was expressed in terms of the temporal changes in phase-contrast derived tCBF (81.39 versus 61.35 mL/min2/100g, P=0.01). BHI based on SSS flow velocity was also significantly different between groups (0.50 versus 0.37 cm/s2, P=0.003, Fig. 4).Conclusions
In this study, breath-hold as a vasodilatory stimulus mimicking sleep apnea, was performed to assess cerebrovascular reactivity in patients with OSA compared to matched controls. Greater CVR in OSA relative to controls was observed when expressed as the BH response to global CBF measured by PC MRI, as well as voxel-wise BOLD-based measurements. While BH-induced changes in CBF are often considered unreliable due to variations in subjects’ adherence to the paradigm, it is, when properly administered, a better match to nocturnal spontaneous apneas as in both cases the stimulus is both hypercapnic and hyperoxic, which is not the case for exogenously supplied CO2. These results, while counter to expectation, are in overall agreement with a very recent study evaluating CVR on the basis of an exogenous hypercapnic stimulus.2Acknowledgements
NIH Grant RO1 HL122754.References
1. Pack, A.I. and T. Gislason, Obstructive sleep apnea and cardiovascular disease: a perspective and future directions. Prog Cardiovasc Dis, 2009. 51(5): p. 434-51.
2. Ryan, C.M., et al., Evaluation of Cerebrovascular Reactivity in Subjects with and without Obstructive Sleep Apnea. J Stroke Cerebrovasc Dis, 2018. 27(1): p. 162-168.
3. Oz, O., et al., Decreased cerebral vasomotor reactivity in patients with obstructive sleep apnea syndrome. Sleep Med, 2017. 30: p. 88-92.
4. Silvestrini, M., et al., Impaired cerebral vasoreactivity and risk of stroke in patients with asymptomatic carotid artery stenosis. JAMA, 2000. 283(16): p. 2122-7.
5. Rodgers, Z.B., et al., High temporal resolution MRI quantification of global cerebral metabolic rate of oxygen consumption in response to apneic challenge. J Cereb Blood Flow Metab, 2013. 33(10): p. 1514-22.
6. Cao, W., et al., High-speed whole-brain oximetry by golden-angle radial MRI. Magn Reson Med, 2017.
Figures