2662
High-resolution Brain 3D-TOF MRA of Critical Fine Branches from Major Trunks Using Deep Learning Reconstruction and High-gradient Magnetic Field1Radiology, Korin University Faculty of Medicine, Mitaka, Japan, 2Radiology, Saitama Medical Center, Saitama Medical University, Kawagoe, Japan, 3Radiology, Korin University Hospital, Mitaka, Japan
Synopsis
Problem
Using a 3-T MRI scanner with a high gradient magnetic field (100mT/m), we evaluated the depiction of the intracranial fine branches on high-resolution 3D-TOF MRA (HR-TOF). We also assessed whether depiction can be improved by deep learning reconstruction (DLR).
Methods
Ten healthy volunteers were imaged by HR-TOF with DLR, and the sharpness of origin and the overall depiction of branches were assessed.
Results
SNR, the sharpness of the origin and the overall depiction of branches were superior in HR-TOF with DLR.
Conclusion
HR-TOF can well depict fine branches from major trunks. By performing DLR processing, depiction can be improved.
Introduction
Precise depiction of several kinds of critical fine branches from intracranial major trunks is desired in making strategies of direct surgery for adjacent lesions as well as for stroke management. There was a report that 3D time-of-flight MR angiography (TOF-MRA) of the lenticulostriate artery (LSA) was initially demonstrated successfully at 7 TeslaMRI scanner1. The state-of-the-art Vantage Galan ZGO ™ (Canon Medical Systems, Tochigi, Japan) recently introduced in our hospital is a 3-T MRI scanner with the world's strongest gradient magnetic field (100mT/m) at present. In addition to free parameter setting, deep learning reconstruction (DLR) of noise reduced function is installed. Therefore, high-resolution (HR) cerebral artery imaging is expected to be performed. We examined the usefulness of HR TOF-MRA using DLR for depiction of such critical fine arterial branches.Methods
MR imaging was performed with a 3T MR imaging system (Vantage Galan ZGO ™) using a 32-channel head coil. Using an infusion pump system, we flowed water into a small vessel phantom (diameter, 1.1 mm) while reducing the flow rate from 0.1 ml / sec to 0.01 ml / sec, and TOF-MRA was performed for each flow rate. The HR-TOF was set to the minimum in-plane resolution to be iso voxel. On the other hand, the FOV of TOF-MRA for comparison (TOF) was set so that the entire brain to be imaged, and the slice thickness was unified with HR-TOF. The imaging parameters for TOF and HR-TOF were as follows: TR, 18 ms; TE, 3.9 ms; FOV, 200 200 / 130 130 mm; matrix, 224 224 / 320 320; in-plane resolution, 0.98 0.98 / 0.4 0.4 mm; slice thickness, 0.8 mm; NEX, 1; scan time, 3 minutes, 48 seconds / 5 minutes, 24 seconds; flip angle, 10. Both TOF and HR-TOF were performed using 1, 2 and 4 slabs. In the 4-slab setting, bandwidth (BW) used the minimum value of 122 kHz in addition to the conventional 391 kHz. In each imaging setting, contrast-to-noise ratio (CNR) was calculated from the MIP image and compared. Subsequently, ten healthy volunteers were imaged with TOF and HR-TOF using scan parameters with the highest CNR. Furthermore, DLR was performed in HR-TOF. For both TOF and HR-TOF, the signal-to-noise ratio (SNR) of the internal carotid artery (ICA), M1, M2 and M3 segments of the middle cerebral artery was measured on source images. In addition, using the MIP image, the sharpness of the origin and the overall depiction of LSA, the Heubner artery, the anterior choroidal artery (Anchor A) and the ophthalmic artery (OA), which are clinically important small arteries, were scored using a visual assessment score. Both SNR and the visual assessment score were statistically examined using Steel Dwass of multiple comparison test.Results
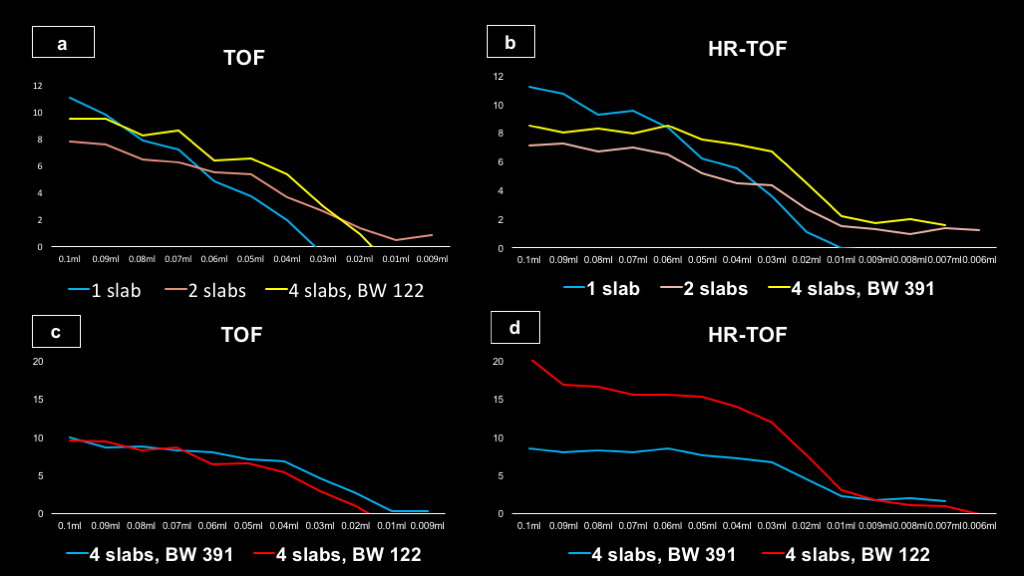
1. Small vessel phantom (Figure 1)
In normal BW, the CNR of each slab was not different between TOF and HR-TOF, and CNR was the highest at 4 slabs for both TOF and HR-TOF at the slow rate. Furthermore, in the 4-slab setting using the minimum BW, CNR of HR-TOF increased.
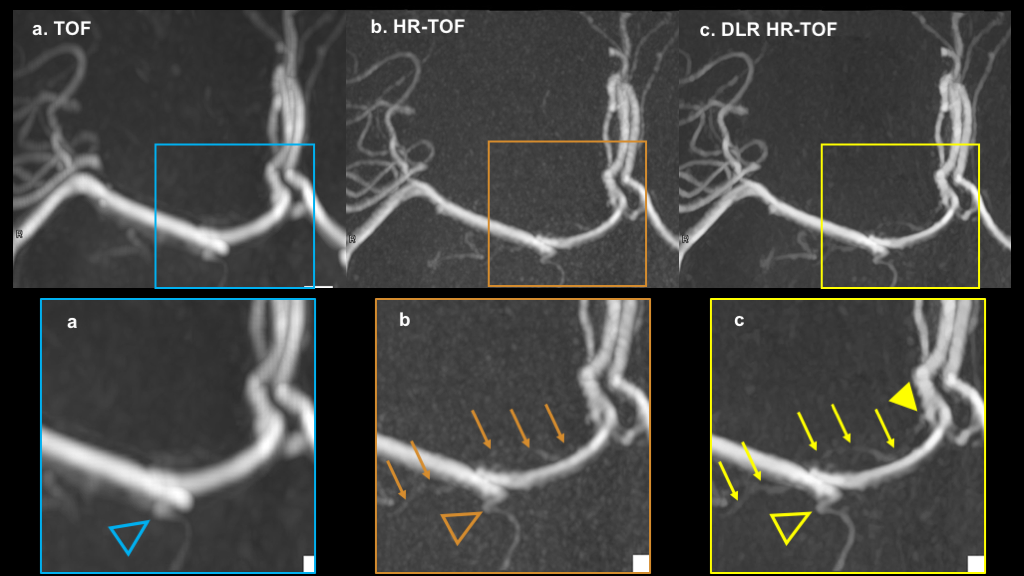
2. Healthy volunteer images (Figure 2-5)
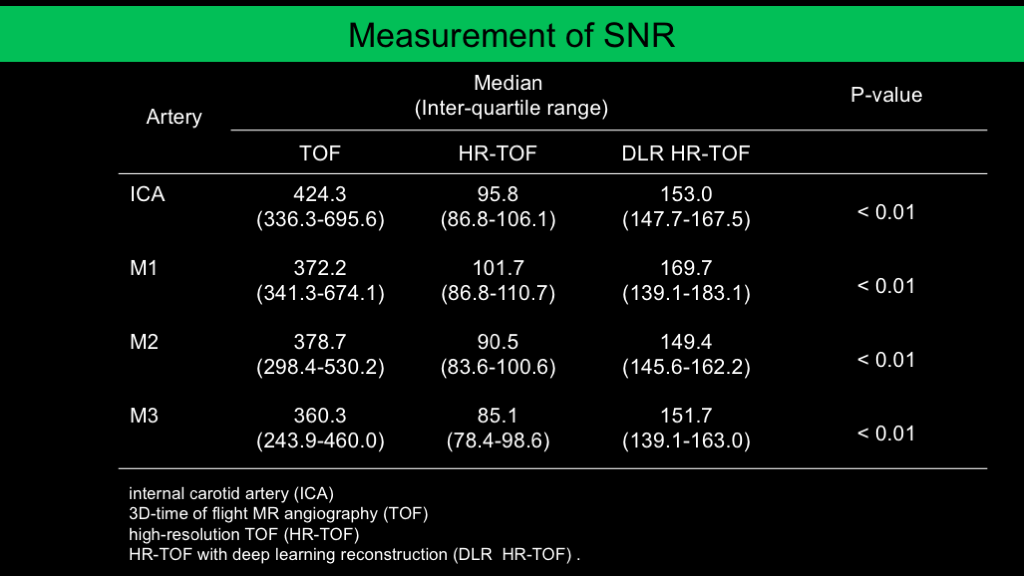
2-1. SNR
Imaging was performed using 4 slabs and BW of 122 kHz. In both ICA, M1, M2 and M3, the SNR was significantly higher in the order of TOF, HR-TOF with DLR (DLR HR-TOF) and HR-TOF.
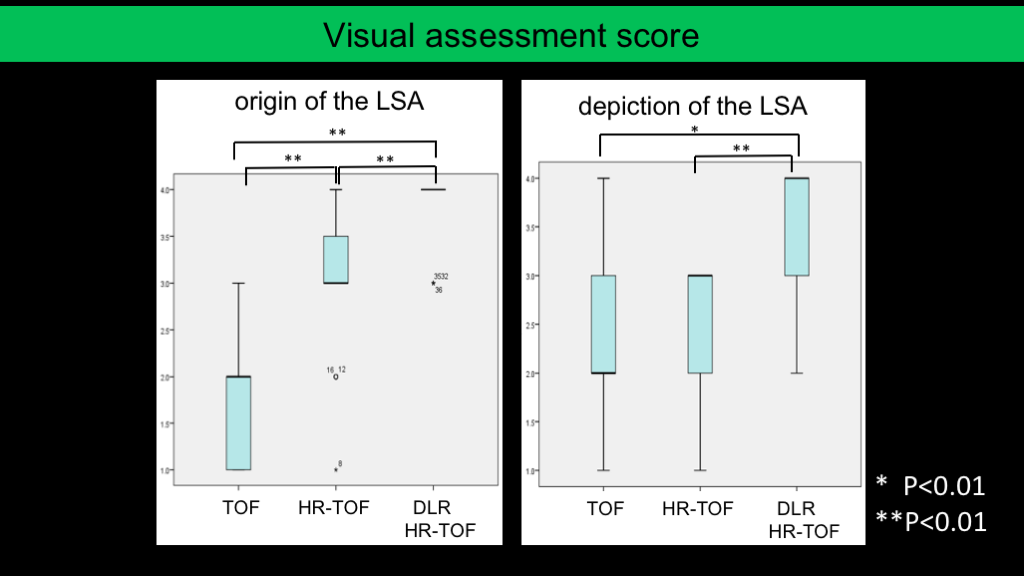
2-2. The visual assessment score of the origin
In the LSA, the visual assessment score was significantly superior in the order of DLR HR-TOF, HR-TOF and TOF. In the Heubner artery, Anchor A and OA, there was no significant difference between DLR HR-TOF and HR-TOF, but it was significantly superior to TOF.
2-3. The overall depiction
In the LSA and Anchor A, DLR HR-TOF was significantly superior to HR-TOF and TOF. In the OA, there was no significant difference between DLR HR-TOF and HR-TOF, but both were significantly superior to TOF. On the other hand, there was no significant difference in the Heubner artery.
Discussion
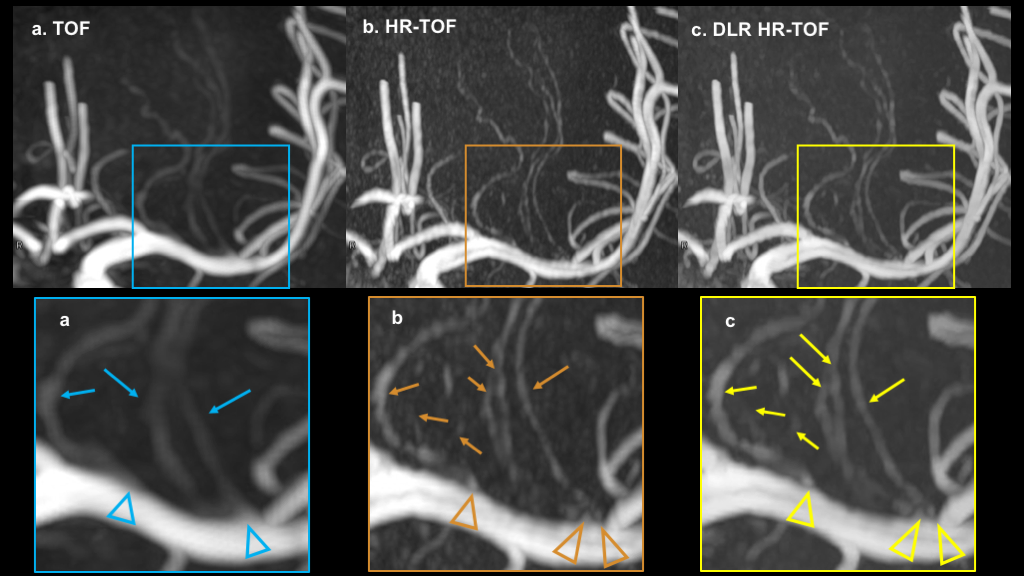
In volunteer imaging, the SNR of DLR HR-TOF was higher than that of HR-TOF. It is indicated the effect of noise reduction of DLR. Only in the LSA, the sharpness of the arterial origin was significantly superior in DLR HR-TOF than in HR-TOF. It is likely to have been caused by the fact that the in-flow effect was stronger because only the LSA was running in the cranio-caudal direction. No artery disappeared on images DLR was applied.Conclusion
HR-TOF can well depict fine branches from intracranial major trunks of clinical importance. By performing DLR processing, their depiction can be improved.Acknowledgements
No acknowledgement found.References
1. Zhang Z, Fan Z, Kong Q1, et al. Visualization of the lenticulostriate arteries at 3T using black-blood T1-weighted intracranialvessel wall imaging: comparison with 7T TOF-MRA. Eur Radiol. 2018 Aug 27 [Epub ahead of print]Figures