2661
Assessment of cerebral pulsatility using high temporal-resolution MRI1Wellcome Centre for Integrative Neuroimaging, University of Oxford, Oxford, United Kingdom, 2Stroke Prevention Research Unit, University of Oxford, Oxford, United Kingdom
Synopsis
High frequency resting state BOLD MRI (rs-fMRI, TR=0.43s) detects effects of blood flow pulsatility on the cerebrovasculature, but no systematic comparison of analysis methods has been performed. In ten healthy subjects, we compared three pulsatility quantification methods (iterative GLM, mean-squared coherence (MSC), number of standard deviations (nSD)), with or without external physiological measurements. MSC detected the greatest proportion of voxels with significant pulsatility, but iGLM analysis was the most specific method, identified greater normalised pulsatility magnitude in arteries, and was the only approach that produced similar estimates of pulsatility magnitude and extent independently of external physiological data.
Introduction
Resting state functional MRI (rs-fMRI) with a short TR can be used to image the effect of cardiac-driven blood flow pulsatility on the cerebrovasculature, and many approaches for quantification of pulsatility from rs-fMRI data have been used1-5. Here, we compare three pulsatility quantification methods to discern whether they are collectively consistent. Additionally, we investigate whether rs-fMRI data alone can be used to measure pulsatility.Methods
Ten healthy subjects were scanned at 3T (Siemens Verio). A T1-weighted scan was followed by rs-fMRI (TR=430ms, TE=40ms, multiband 6, 30 slices, 3mm isotropic, 1400 volumes, 12min, FA=90°). Brachial blood pressure (BP) was continuously measured (100Hz) throughout3.
T1-weighted images were processed to generate masks of grey matter (GM), white matter (WM) and cerebrospinal fluid (CSF)6. The rs-fMRI data were brain extracted, motion corrected, distortion corrected and de-meaned6. An arterial vessel mask was generated based on voxels with high temporal-standard deviation in rs-fMRI data in the neck.
Three methods were used to quantify the magnitude and spatial extent of pulsatility. Each method was run informed (using the external BP trace) or data-driven (only using the MRI data) where possible.
Iterative General Linear Model (iGLM)1,2
- Assume power spectrum (PS) of each voxel is combination of cardiac and respiratory components.
- Estimate initial PS from external BP trace (informed) or MRI data from whole-brain or arterial voxels (data-driven variants).
- Voxelwise fit rs-fMRI PS; extract GLM coefficient in cardiac frequency (0.5Hz<f<1.16Hz) and associated p-value.
- Threshold voxels using P<0.05; estimate refined PS from significantly pulsatile voxels.
- Repeat 2-4 until difference in integrated normalised power between successive PS<0.01%.
- GLM coefficient quantifies pulsatility magnitude, and spatial extent of pulsatility is the proportion of a tissue mask (GM/WM/CSF/Arteries) that showed significant pulsatility.
Magnitude Squared Coherence (MSC)3
- MSC measures how much power from known input signals (informed: BP trace, data-driven: arterial voxels) propagates to measured outputs (voxelwise rs-fMRI data).
- MSC calculated using mscohere in MATLAB. Integrated MSC over cardiac frequency range (0.5Hz<f<1.16Hz) used to quantify pulsatility magnitude.
- MSC calculation repeated for 100 random permutations of input signal to assess significance of the pulsatility effect; spatial extent of pulsatility extracted as for iGLM method above.
Number of Standard Deviations (nSD)4
- Sort rs-fMRI data based on when in the cardiac-cycle they were acquired to produce a voxelwise single cardiac-cycle MRI waveform.
- Fit waveform with 7-term Fourier series to generate R2 map.
- Randomly permute each voxel’s waveform, re-fit, and extract all R2 values to generate a null-distribution of R2 values.
- Significant pulsatility was detected as an R2>5σ from the null-distribution mean; number of standard deviations from the null-distribution mean quantified pulsatility magnitude.
To compare pulsatility magnitudes, each magnitude measurement was normalised to that measured in the whole brain (GM+WM+CSF masks). Two-way ANOVA with Tukey’s multiple-comparison test was used to establish whether pulsatility magnitude or spatial extent was significantly differently estimated by each method.
Results
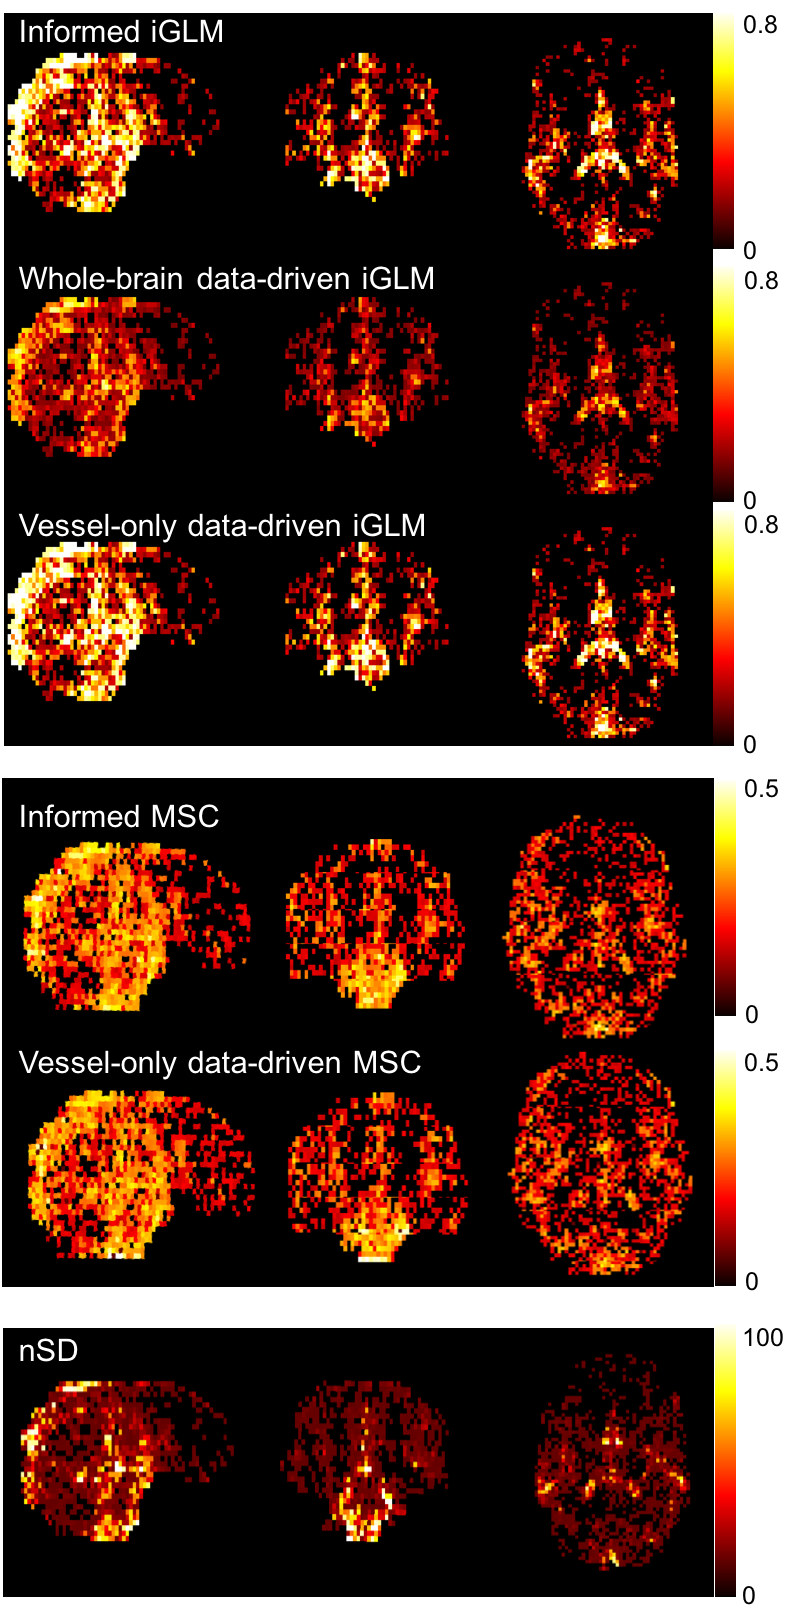
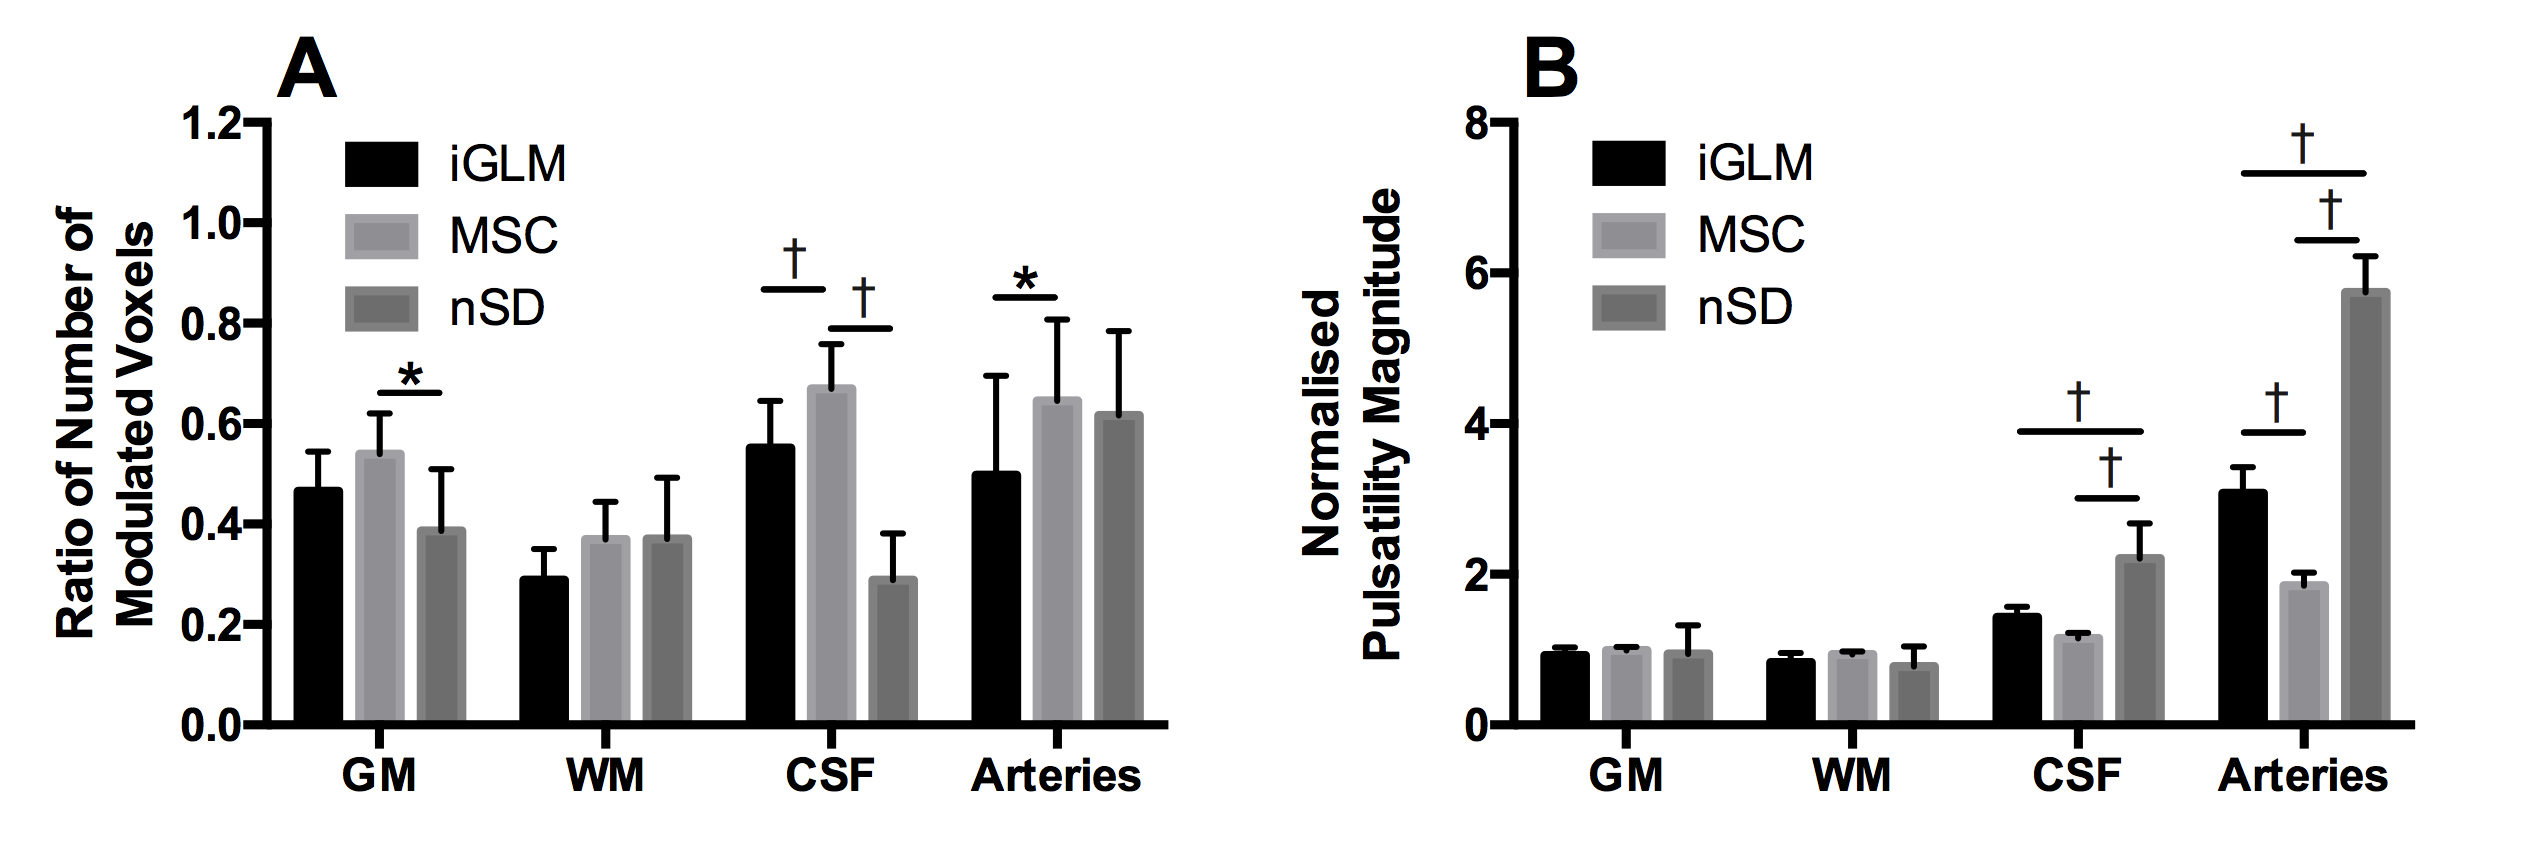
Figure 1 shows example pulsatility magnitude maps from all analyses. Figure 2 shows the comparison of normalised pulsatility magnitude and spatial extent from informed analyses. MSC detected pulsatility in the greatest proportion of voxels in all tissue types, and this increase was significant compared to nSD in GM (P<0.05), to iGLM and nSD in CSF (both P<0.001) and to iGLM in arteries (P<0.05). The normalised magnitude of pulsatility was greatest in arteries using all methods, and no significant difference was detected between methods in GM or WM.
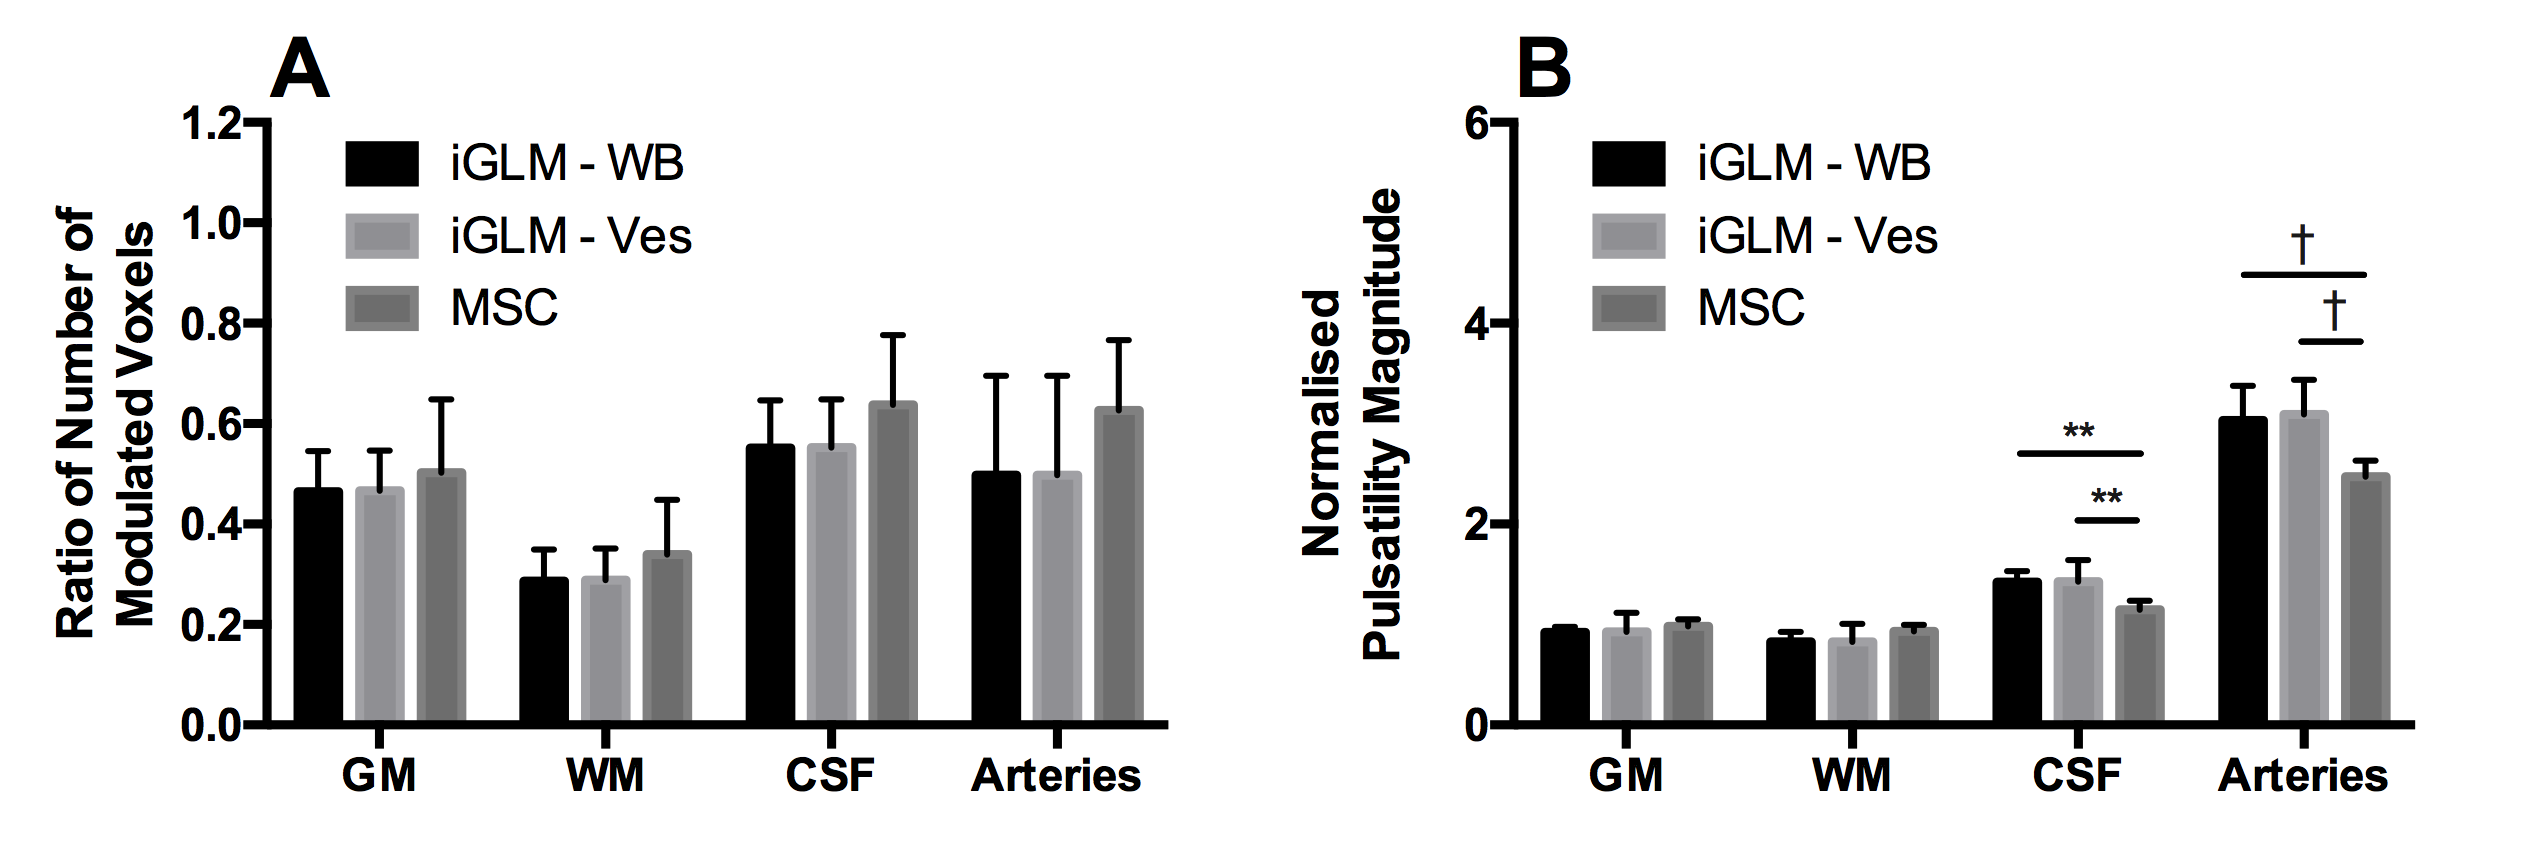
The results of the data-driven analyses are shown in Figure 3. Since nSD requires the external BP trace to sort MRI data, nSD could not be run data-driven. No significant differences were detected between methods for the data-driven spatial extent of pulsatility in any tissue mask. MSC gave significantly lower estimates of normalised pulsatility magnitude compared to both iGLM data-driven approaches in CSF and arteries (all P<0.001).
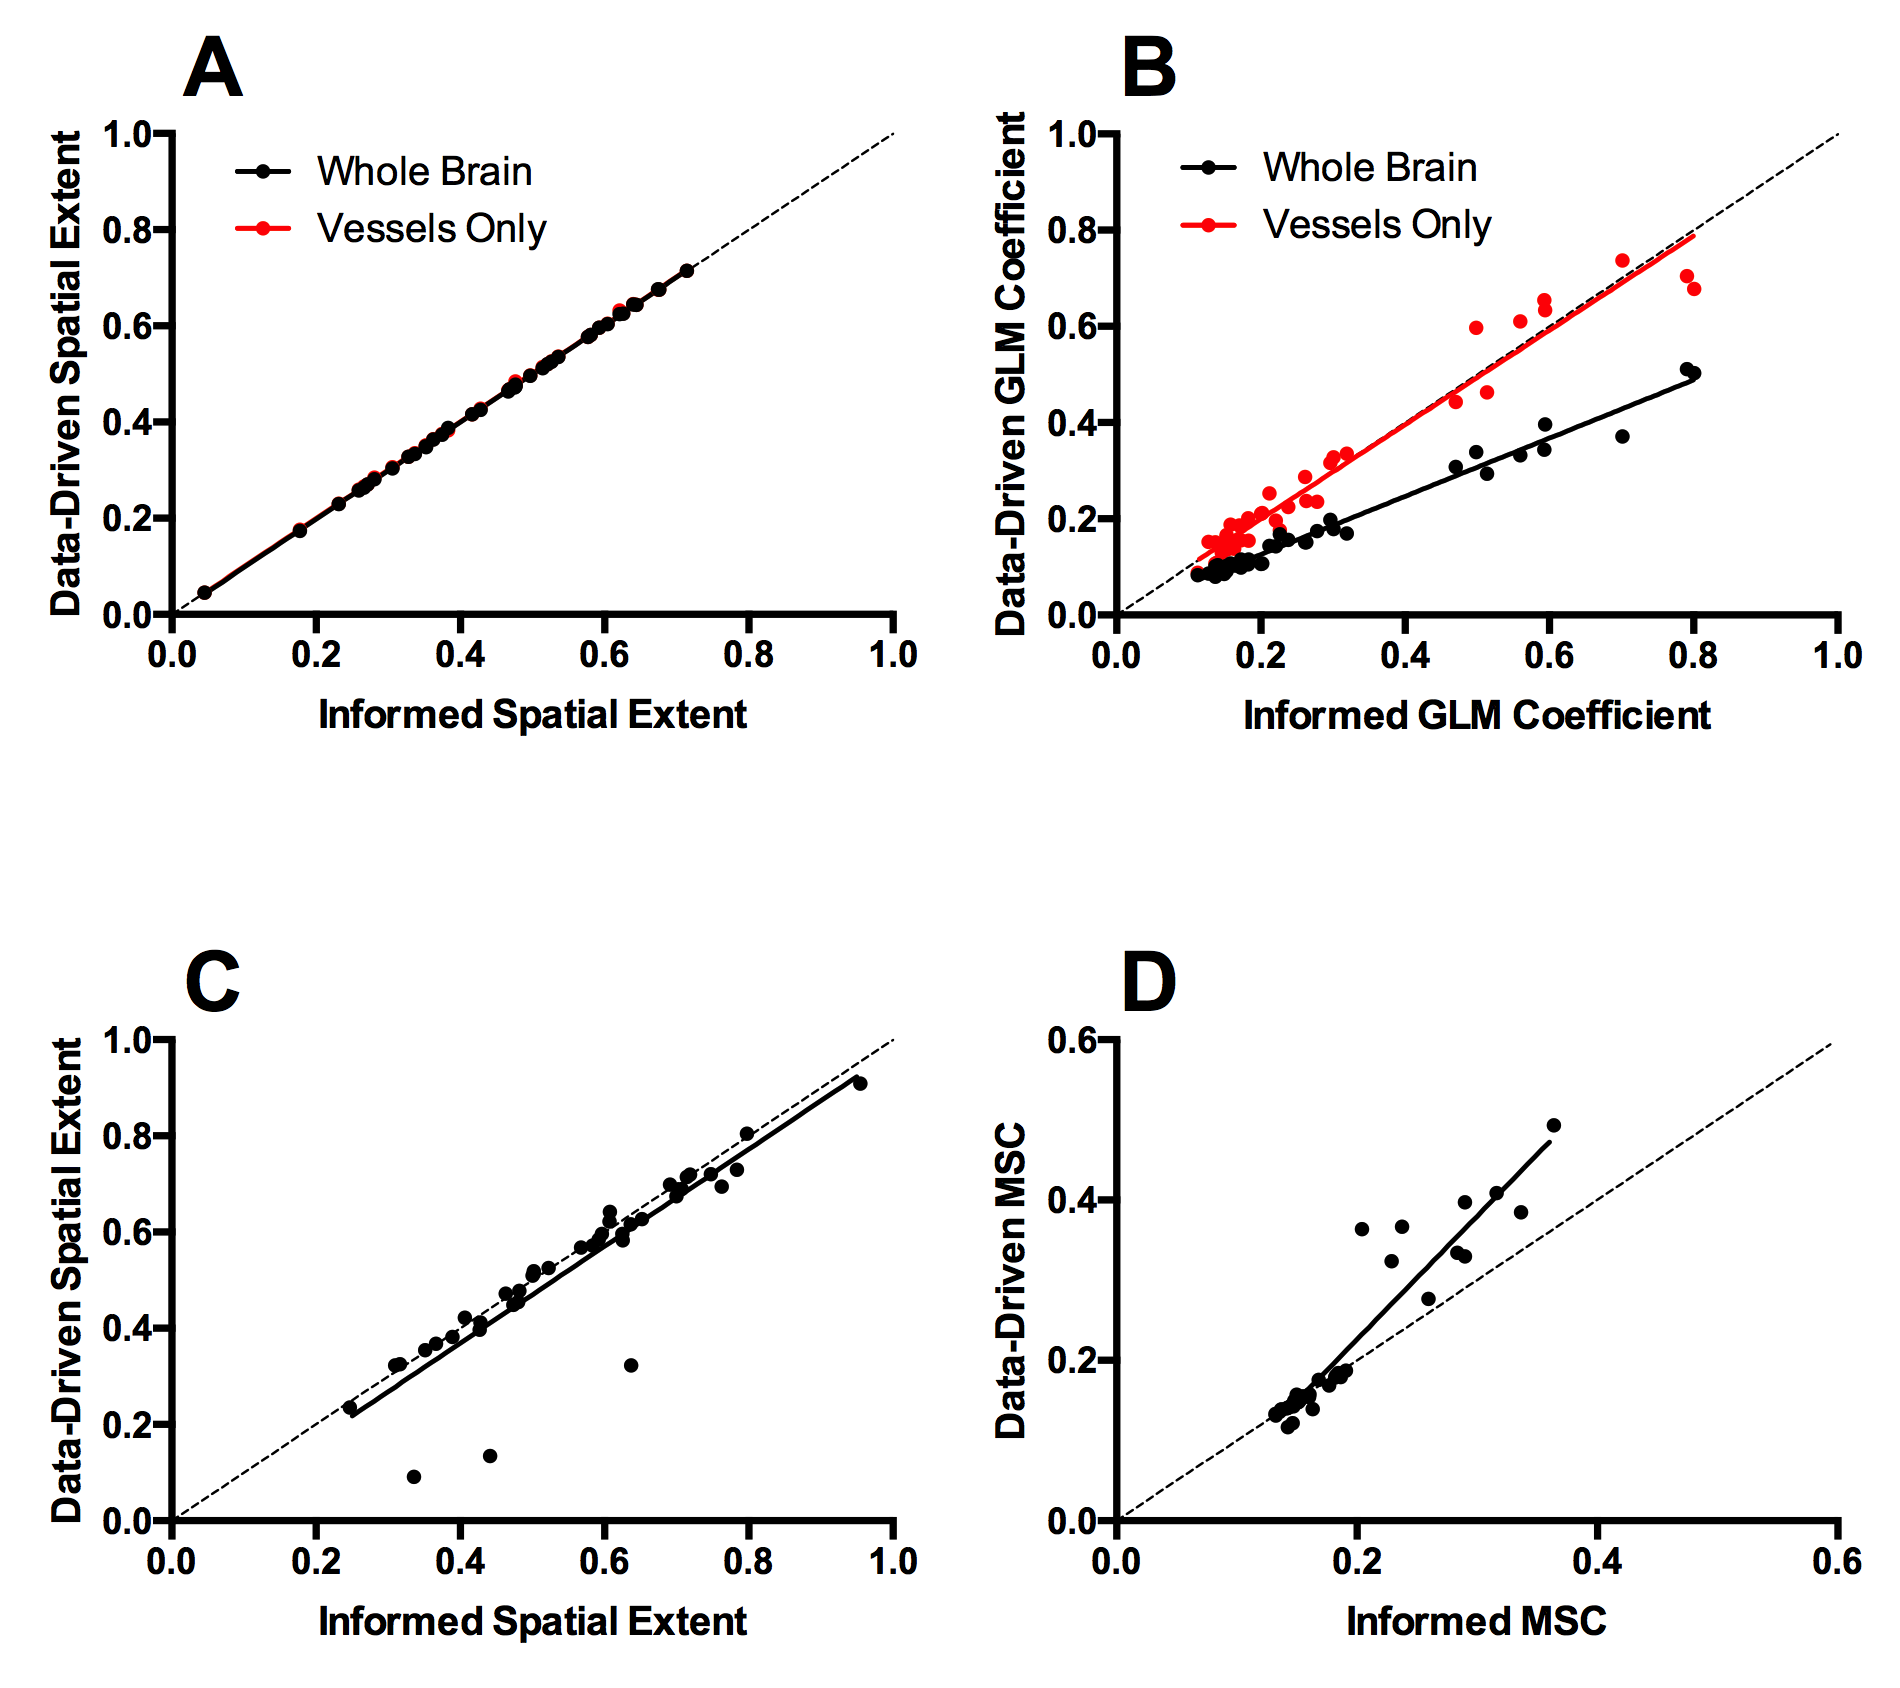
Direct comparison of non-normalised pulsatility magnitudes estimated by informed or data-driven approaches shows that the iGLM–Ves method (using arterial voxels only) gives pulsatility magnitude and spatial extent estimates that agree with the informed approach, which no other data-driven analysis achieves.
Discussion & Conclusion
The novel iGLM vessel-only data-driven approach was the only data-driven method that derived estimates in agreement with the informed analysis for both pulsatility magnitude and spatial extent, suggesting that it may be able to measure pulsatility where external cardiac recordings are not available. Future work will explore further quantification techniques5 and investigate the ability of independent component analysis to de-noise rs-fMRI data to increase sensitivity to pulsatility6.Acknowledgements
We acknowledge support from the Oxford NIHR Biomedical Research Centre.References
1 – Viessmann et al. Neuroimage 162: 93–105 (2017)
2 – Viessmann et al. Neuroimage in press doi:10.1016/j.neuroimage.2018.01.011 (2018)
3 – Webb et al. Stroke 47(6) 1669–1672 (2016)
4 – Theyers et al. JCBFM in press doi:10.1177/0271678X18766771 (2018)
5 – Bianciardi et al. Philos Trans A Math Phys Eng Sci 374(2067): 20150184 (2016)
6 – Jenkinson et al. NeuroImage 62:782-90 (2012)
Figures