2659
Comparison of the BOLD-evoked response to hypercapnic challenge in mice anesthetized under isoflurane and dexmedetomidine.1Integrated Program in Neuroscience, Mcgill university, Montreal, QC, Canada, 2Douglas Mental Health University Institute, Montreal, QC, Canada, 3Department of Psychiatry, McGill University, Montreal, QC, Canada, 4Department of Psychiatry, Mcgill university, Montreal, QC, Canada, 5Biological & Biomedical Engineering, McGill University, Montreal, QC, Canada
Synopsis
Small animal functional magnetic resonance imaging has great potential in a range of basic neuroscientific applications. To maintain stable experimental conditions, animals are usually anesthetized during acquisition. However, anesthesia regimes influence neural activity through their influence on neurovascular coupling. To investigate these mechanisms, we compared the BOLD response following hypercapnia in mice anesthetized under isoflurane or dexmedetomidine. We found that the impact of hypercapnia is much more potent in animals anesthetized under dexmedetomidine, but that FC is much stronger under isoflurane, suggesting that this response does not predict a more pronounced reduction in FC as a consequence of anesthesia.
Introduction
Small animal functional magnetic resonance imaging (fMRI) can be used to examine functional connectivity (FC) and has great potential in a range of basic neuroscientific applications. To maintain stable experimental conditions in small animal resting state fMRI studies mice are usually anesthetized during acquisition. However, anesthesia regimes influence neural activity through their influence on neurovascular coupling1. Studies of anesthetic regimens have demonstrated that the choice of anesthetic can have a substantial impact on FC, the frequency spectrum of the blood-oxygen-level dependent (BOLD) signal2 and the stimulus-evoked BOLD and cerebral blood volume (CBV) response3. Here we examined the BOLD-evoked response to hypercapnic challenge (increase in CO2) during anesthesia using isoflurane or dexmedetomidine, two commonly used anesthetics that have never been compared in the context of BOLD-response. The relative increases in BOLD with hypercapnia are diminished with higher doses of isoflurane4, suggesting that higher anesthesia doses may blunt the hypercapnic response, and that a better-conserved hypercapnia-induced response reflects minimal influence of the anesthesia protocol on neural-related signal. The BOLD-evoked response to hypercapnia is mediated mainly through the vasodilatory properties of CO21. Isoflurane is a vasodilator, whereas medetomidine is a vasoconstrictor1, and thus, interactions between the anesthetic and CO2 on the neurovascular coupling could be reflected in differences in the BOLD-evoked response.Methods
Two groups of 5 C57BL/6 (male, 11-12 weeks) were anesthetized briefly with 3% isoflurane, then under either 1% isoflurane or 0.1 mg/kg/h dexmedetomidine. Gradient echo echo planar imaging (EPI) images were acquired on a Bruker Biospec 7T scanner equipped with a CryoProbe (matrix of 64x66, in-plane resolution 0.3x0.3, 22 slices of 0.7mm thickness, TE/TR 18ms/1200ms TR, 13 mins total; anesthesia depth monitored through respiration rate.). The initial 6 minutes were of resting-state data, followed by 3min of hypercapnic challenge (10% increase in CO2), and a further 5min with return to baseline. A T1 FLASH (0.1mm isotropic, TE/TR 4.5/20ms) structural image was also acquired after the EPI sequence.
EPI volumes were preprocessed using rigid-body realignment to correct for motion, EPI to T1 nonlinear coregistration and normalization of the structural images to an atlas common space5–8. For functional connectivity analysis, the white matter and cerebrospinal fluid signals, and 6 rigid-body motion parameters were regressed from the time series, and a high pass 0.01Hz filter and a Gaussian filter of 0.3 mm FWHM were applied.
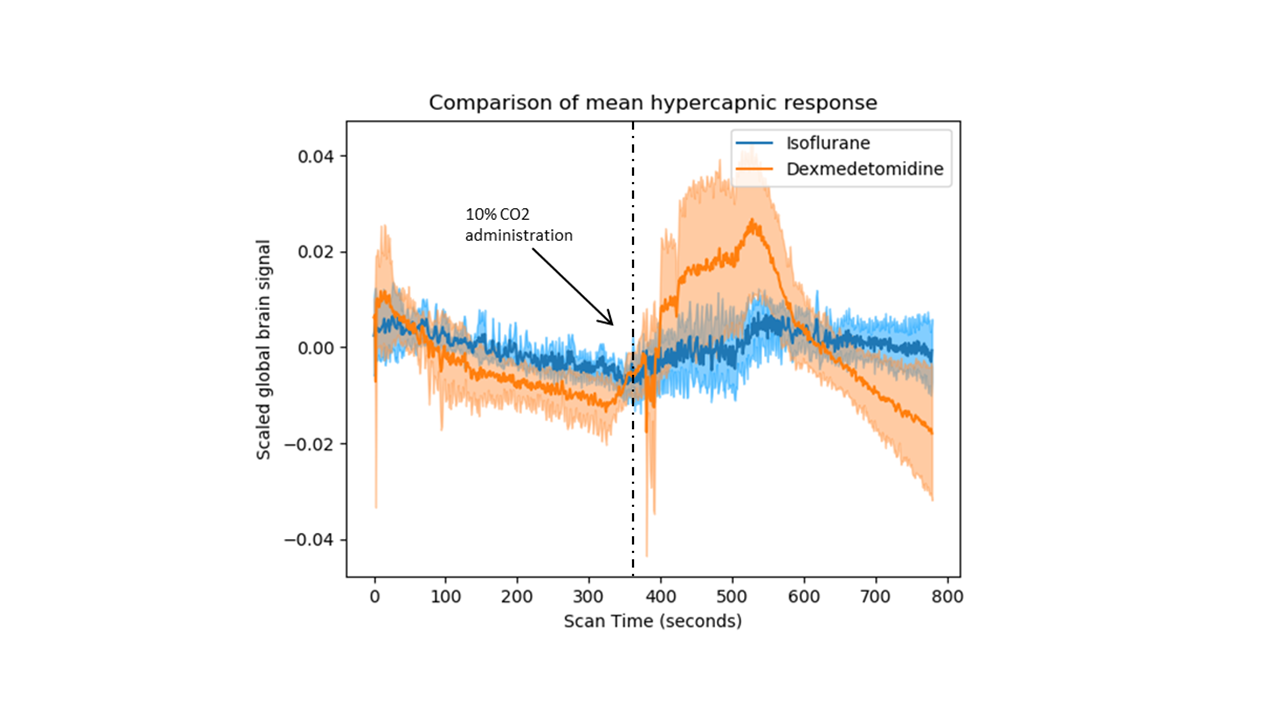
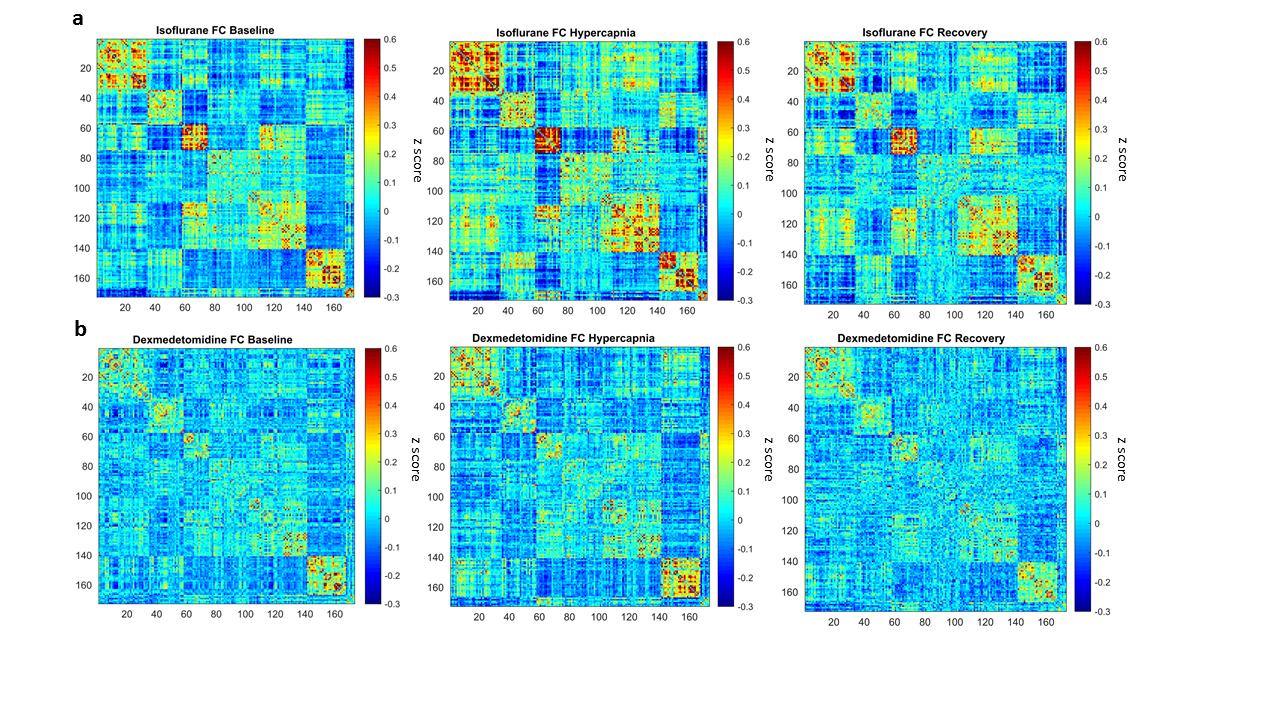
The global brain signal traces across time were extracted from each subject and scaled to compare group differences in the hypercapnic responses. For FC analysis, 172 regions of interest (ROI) were defined based on the atlas. The average voxel timeseries were extracted and the pairwise correlations between each ROI was computed and Fischer z-transformed to derive connectivity matrices for each subject. For each group, K-means clustering was applied on the connectivity matrices to derive 7 ROI clusters based on the connectivity profile and visualize connectivity within brain regions expressing similar connectivity patterns.
Results
In our comparison of the BOLD-evoked hypercapnic response, although both groups demonstrated a relative increase in signal during hypercapnia, the response to hypercapnia was much stronger in the dexmedetomidine group (figure 1). In the FC analysis, we observe that the isoflurane group expressed greater FC within ROI clusters compared to the dexmedetomidine group (figure 2a,b). Interestingly, when comparing FC across different time windows, we could observe that FC increases during the hypercapnic period in both anesthetic groups compared to the initial baseline period and the recovery periods, which are essentially similar.Discussion
Our results demonstrate that the choice of anesthetic can have striking effects both on the BOLD response to hypercapnia and on whole brain FC. The discrepancies in hypercapnic responses could be explained by the vasocontrictor properties of dexmedetomidine as opposed to the vasodilatory properties of isoflurane. Since CO2 alters CBV through vasodilation, its effect may be more potent in the dexmedetomidine group where vessels may hold more potential to dilate relative to the isoflurane group, whose vessels are already dilated. On the other hand, dexmedetomidine anesthesia resulted in a widespread loss of FC across the brain compared to isoflurane. Hence, a better-conserved BOLD response to hypercapnia does not predict a more pronounced reduction in FC as a consequence of anesthesia. Finally, the increased connectivity under hypercapnia most likely results from increases in CBV through vasodilation. Whether a neural component contribute to these changes remains to be investigated.Acknowledgements
I would like to thank Daniel Gallino and Gabriel Devenyi for their support on the development of the data acquisition and the preprocessing of images respectively. I also thank my supervisor, the Dr. Mallar Chakravarty, for his ideas and contributions for the development of this project and for offering me the opportunity to carry out this work.References
1. Chuang, K.-H. & Nasrallah, F. A. Functional networks and network perturbations in rodents. NeuroImage 163, 419–436 (2017).
2. Grandjean, J., Schroeter, A., Batata, I. & Rudin, M. Optimization of anesthesia protocol for resting-state fMRI in mice based on differential effects of anesthetics on functional connectivity patterns. NeuroImage 102, 838–847 (2014).
3. Schroeter, A., Schlegel, F., Seuwen, A., Grandjean, J. & Rudin, M. Specificity of stimulus-evoked fMRI responses in the mouse: The influence of systemic physiological changes associated with innocuous stimulation under four different anesthetics. NeuroImage 94, 372–384 (2014).
4. Nair, G. & Duong, T. Q. Echo-planar BOLD fMRI of mice on a narrow-bore 9.4 T magnet. Magn. Reson. Med. 52, 430–434 (2004).
5. Dorr, A. E., Lerch, J. P., Spring, S., Kabani, N. & Henkelman, R. M. High resolution three-dimensional brain atlas using an average magnetic resonance image of 40 adult C57Bl/6J mice. NeuroImage 42, 60–69 (2008).
6. Ullmann, J. F. P., Watson, C., Janke, A. L., Kurniawan, N. D. & Reutens, D. C. A segmentation protocol and MRI atlas of the C57BL/6J mouse neocortex. NeuroImage 78, 196–203 (2013).
7. Richards, K. et al. Segmentation of the mouse hippocampal formation in magnetic resonance images. NeuroImage 58, 732–740 (2011).
8. Steadman, P. E. et al. Genetic Effects on Cerebellar Structure Across Mouse Models of Autism Using a Magnetic Resonance Imaging Atlas. Autism Res. 7, 124–137 (2014).
Figures