2657
Evaluation of image quality of pituitary dynamic contrast-enhanced MRI using TWIST and IT-TWIST.1Department of Diagnostic Imaging and Nuclear Medicine, Graduate School of Medicine, Kyoto University, Kyoto, Japan, 2Human Brain Research Center, Graduate School of Medicine, Kyoto University, Kyoto, Japan
Synopsis
To compare the image quality of pituitary dynamic contrast-enhanced (DCE) MRI using TWIST and iterative reconstruction TWIST (IT-TWIST). IT-TWIST images were created from the identical rawdata of TWIST. ROI analyses were conducted to evaluate enhancement slope in PS, PL, bilateral cavernous sinus (CS) in enhancement slope map. Four ROIs were applied to temporal SD map as an indicator of temporal noise to evaluate image noise. Enhancement slope of all ROIs but PS was significantly higher in IT-TWIST than that in TWIST. Temporal noise in IT-TWIST was significantly less than that in TWIST in all ROIs.
Introduction
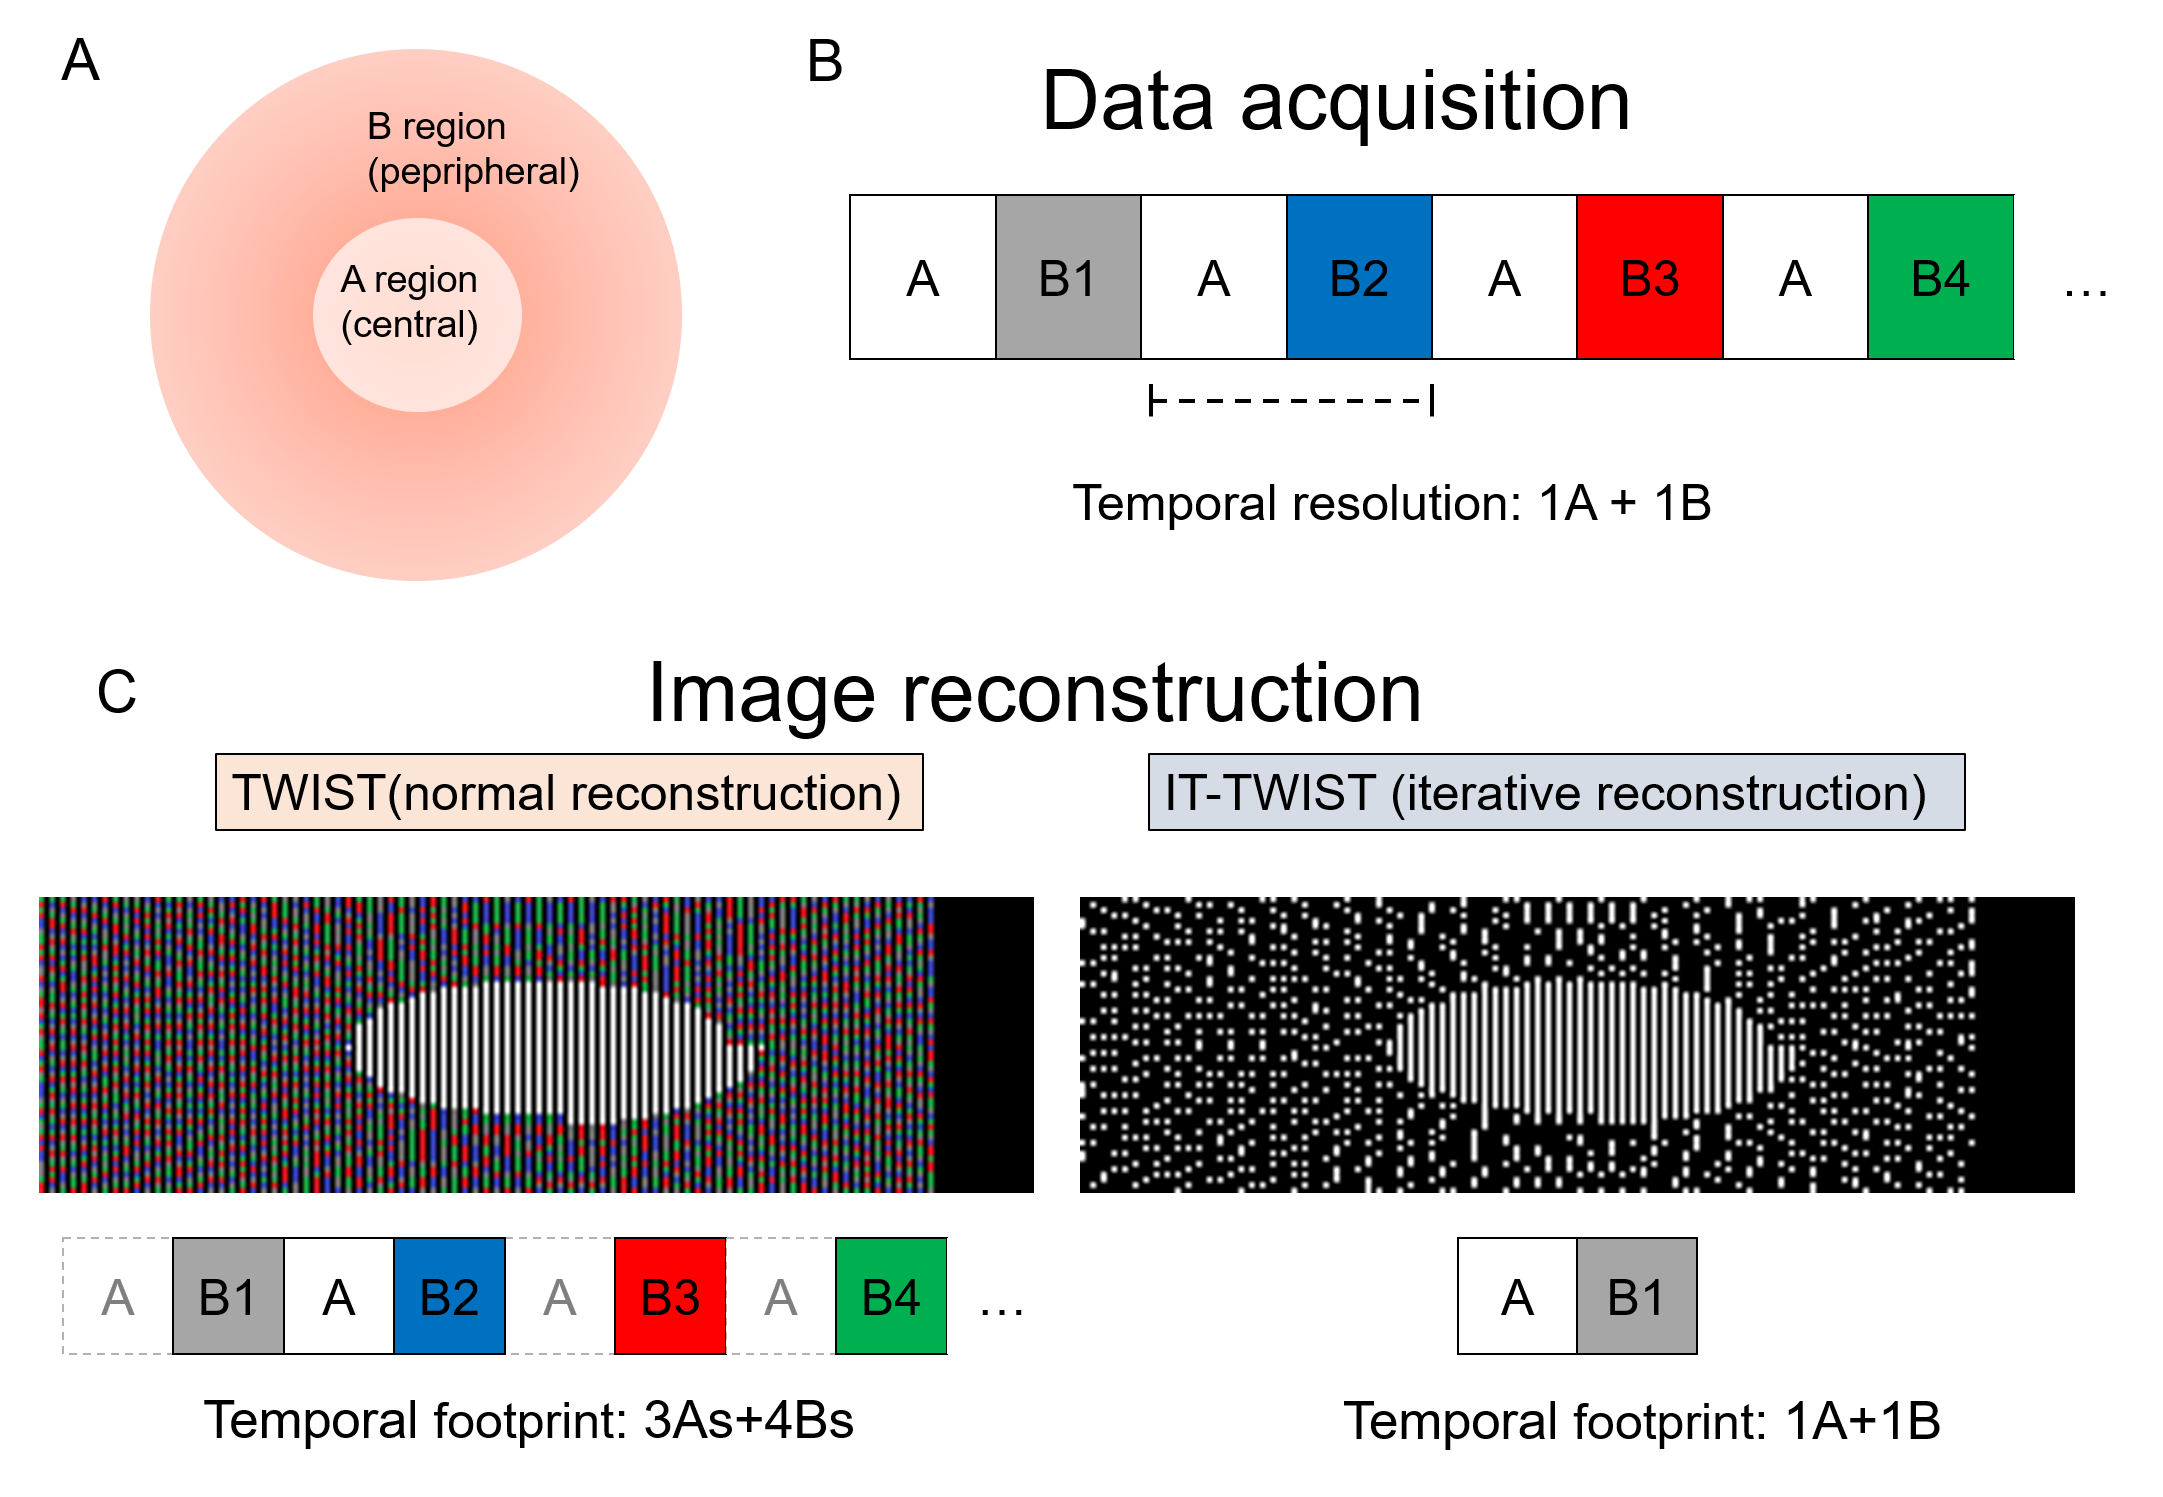
Time-resolved angiography with interleaved stochastic trajectories (TWIST) is advanced technique, which is a keyhole imaging with frequent sampling of central k-space data and view-sharing for peripheral k-space of dynamic phases[1]. IT-TWIST is a another technique with shorter temporal footprint to reconstruct images with smaller temporal footprint using the same rawdata obtained with TWIST by iterative reconstruction using compressed sensing technique[2]. There is no report using TWIST and IT-TWIST techniques for pituitary DCE-MRI. The aim of this study was to compare the image quality of TWIST and IT-TWIST in 3D pituitary DCE-MRI.Materials and methods
This retrospective observation study was approved by the institutional review board and informed consent was waived. 52 DCE-MRI examinations were obtained.
MR imaging:
Three-dimensional (3D) pituitary DCE-MRI imaging was conducted on a clinical 3T MR unit (MAGNETOM Skyra, Siemens Healthineers AG, Erlangen, Germany) using 32-channel head coil.
TWIST and IT-TWIST imaging:
TWIST improves the apparent temporal resolution by an unique k-space acquisition method. The k-space is divided into the central part (region A) and the peripheral part (region B) (Figure 1A). The region A contributes to the overall contrast of the image and the area, and region B contributes to the rendering of a fine structure. In TWIST, the region A and one of subsegments of the region B (B1-B4, in this case) are alternately acquired for each phase (Figure1B), and at that time, the region A data is fully acquired and the region B data is acquired sparsely. Images for each time frame are created from 1 specified region A and a collection of subsegments in region B of the neighboring other dynamic phases. On the other hand, in IT-TWIST, images for each time frame are created from 1 region A and 1 subregion in B by using iterative reconstruction algorithm. Imaging parameters of TWIST DCE-MRI in this study were as follows: coronal acquisition; TR/TE, 2.84/1.10 ms; flip angle, 5°; slice thickness 1 mm, isotropic voxel of 1mm, slice per slab, 52 ; PAT, 2. size of the fully sampled central k-space region A, 20%; sampling density of the peripheral k-space region B, 25%; acquisition time of each time frame, 6.17 s; number of time frames, 15. TWIST images were reconstructed with the online (product) reconstruction pipeline. Afterwards, iterative reconstruction based on prototype software was retrospectively performed on the scanner, (using a k-t regularization factor of 0.002 and 20 iterations. Temporal footprint of “3 region As and 4 region Bs” was 21.60 s in TWIST, and that of “1 region A and 1 region B” was 6.17 s in IT-TWIST. Retrospective reconstruction time of IT-TWIST was about 8 min employing the graphic processing unit (GPU) of the reconstruction hardware.
ROI evaluation:
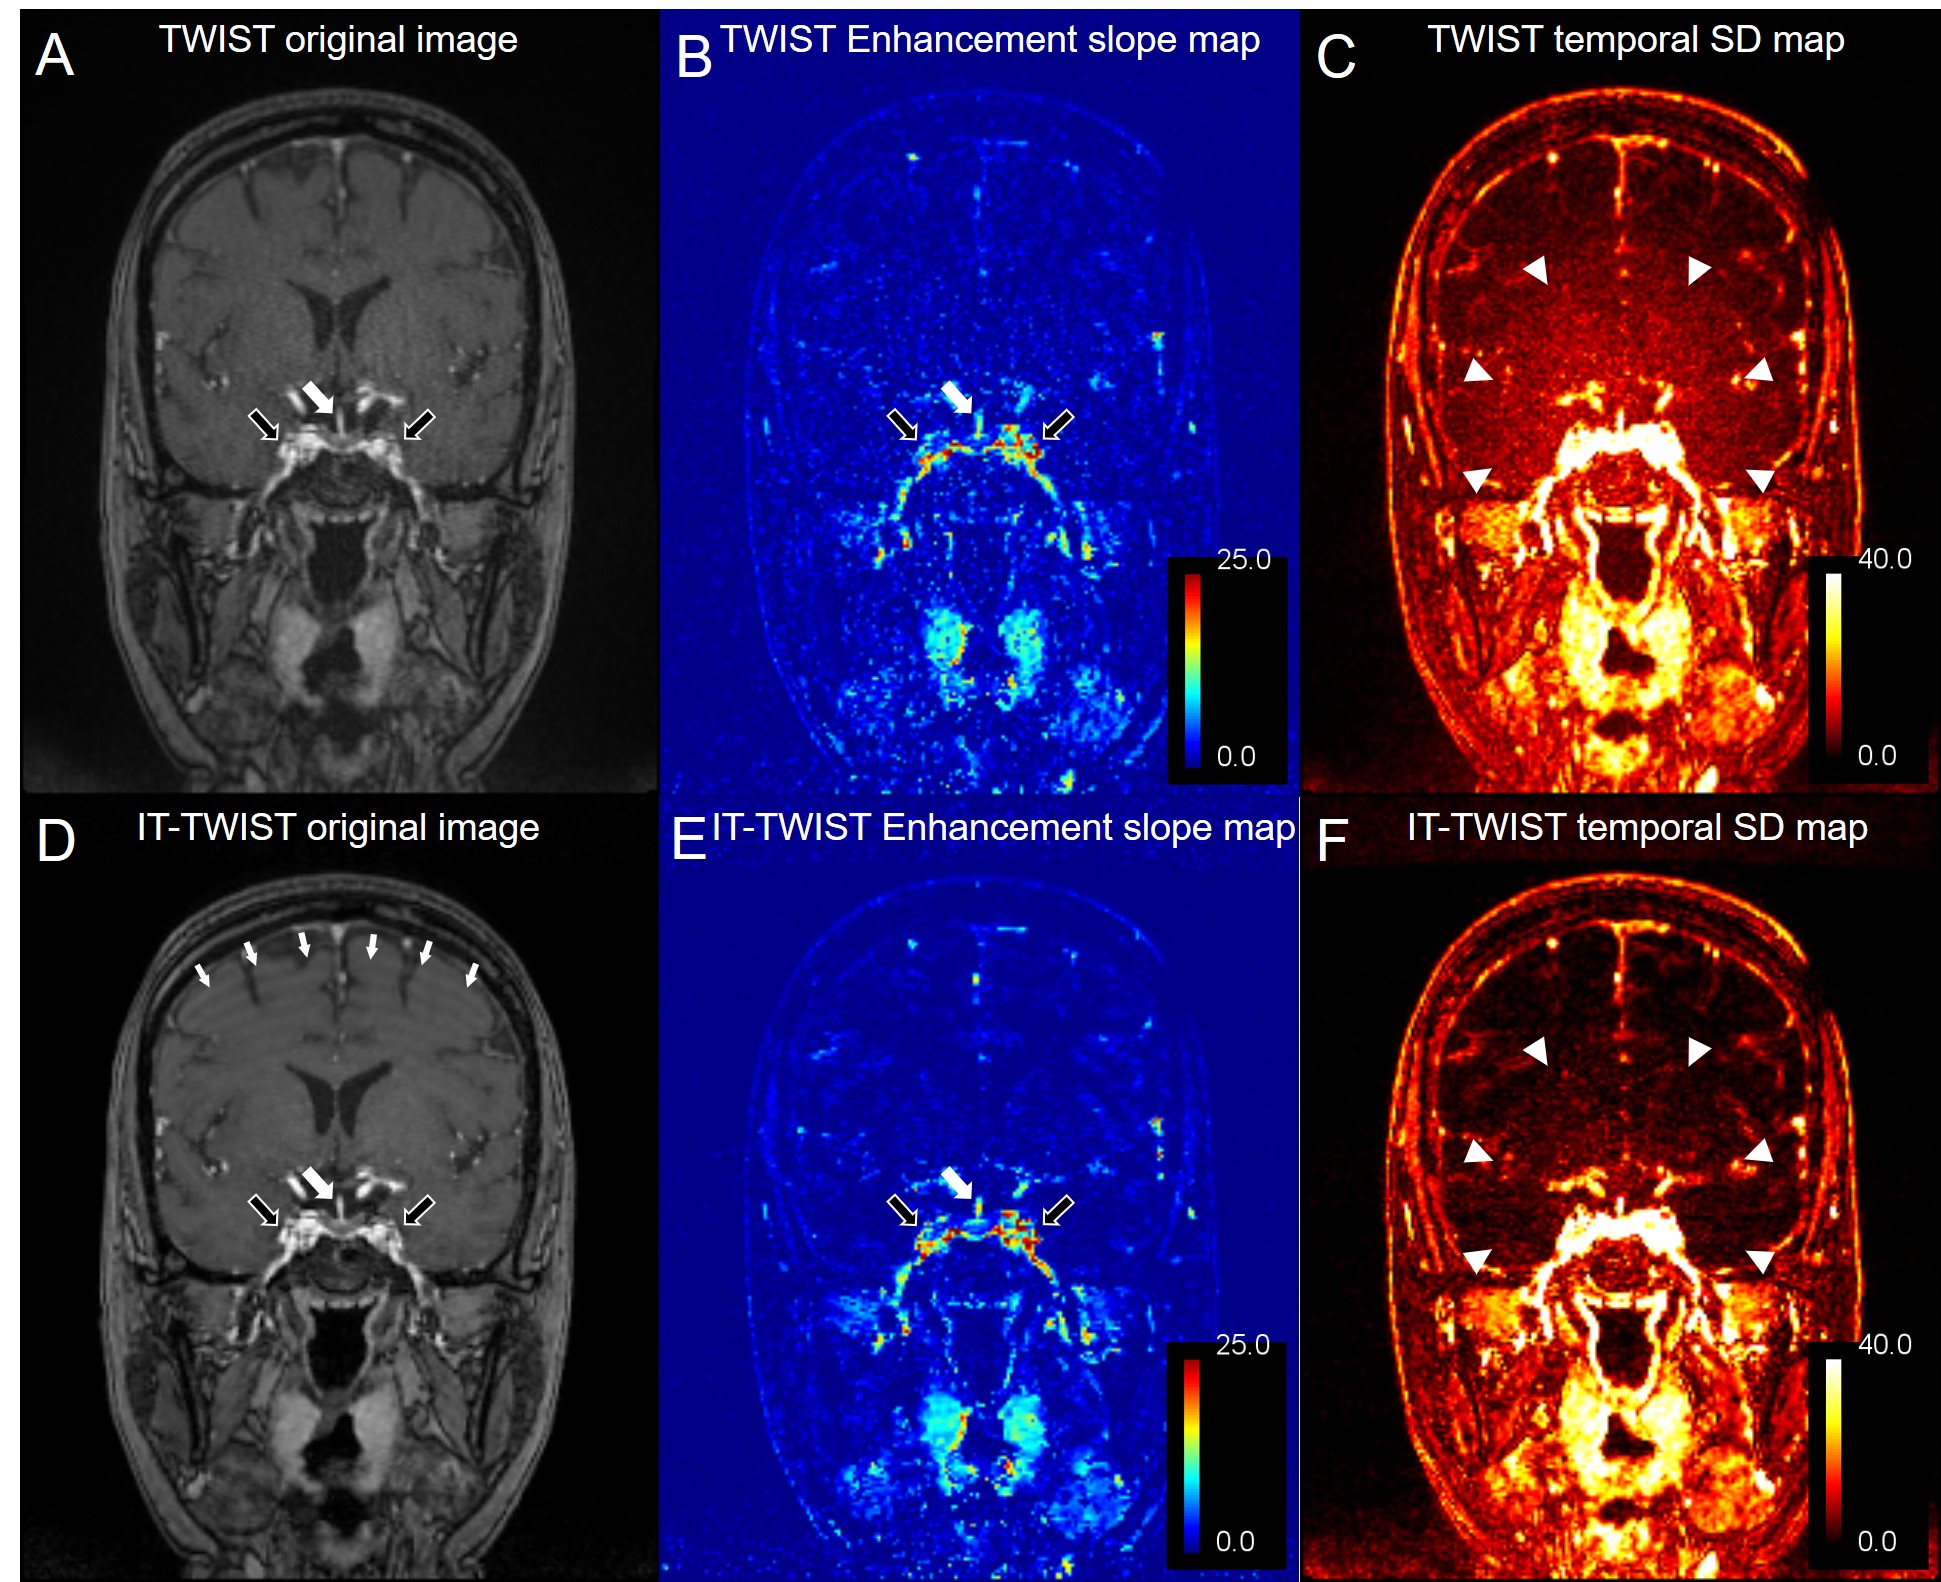
To evaluate DCE bolus sharpness and intensity stability among each dynamic phase, two parameter images were created. (a) Enhancement slope maps were defined as the linear slope passing through the points of 20% and 80% between minimal and maximum signal intensity in curve-fitted time intensity curve (TIC), thus enhancement slope map was created. (b) Temporal standard deviation (SD) maps were created by calculating standard deviation of 15 dynamic phase images (Figure 2). One neuroradiologist placedROIs in PS, PL, bilateral cavernous sinus (CS), sinus air (SA), parasellar cerebrospinal fluid (pCSF), ventricular cerebrospinal fluid (vCSF), and corpus callosum (CC). ROIs of PS, PL, bilateral CS were applied to enhancement slope map image. ROIs of SA, pCSF, vCSF and CC were applied to temporal SD map image.
Statistical analysis:
Paired t-test and Wilcoxon test were used for comparing TWIST and IT-TWIST. p < 0.05 was defined as statistically significant. When Bonferroni correction was used to adjust for multiple comparisons, p < 0.00625 (0.05/8) were defined as statistically significant.
Results
Enhancement slope of PL, PS, and bilateral CS of is significantly higher in IT-TWIST than that in TWIST. (B) Temporal noise of pCSF, vCSF, SA and CC are significantly lower in IT-TWIST compared with TWIST (Figure 3, 4, 5).Discussions
PS, PL and CS are enhanced in early arterial phase, the higher enhancement slope in IT-TWIST represents higher bolus sharpness and higher contrast change among dynamic phases by shorter temporal footprint of IT-TWIST. Although there is a trade off between temporal resolution and image quality, IT-TWIST improved both the time resolution and image quality compared with TWIST.Conclusions
IT-TWIST showed higher enhancement slope in PL and CS, less temporal noise in the neighboring cerebral white matter compared with TWIST on pituitary DCE-MRI.Acknowledgements
We are grateful to Mr. Aurelien Stalder ,Mr. Christoph Forman and Ms. Michaela Schmidt, Siemens Healthineers AG, for their kind help.
References
- Lim RP, Shapiro M, Wang EY et al (2008) 3D time-resolved MR angiography (MRA) of the carotid arteries with time-resolved imaging with stochastic trajectories: comparison with 3D contrast-enhanced Bolus-Chase MRA and 3D time-of-flight MRA. AJNR Am J Neuroradiol 29:1847-1854
- Wetzl J, Forman C, Wintersperger BJ et al (2017) High-resolution dynamic CE-MRA of the thorax enabled by iterative TWIST reconstruction. Magn Reson Med 77:833-840
Figures
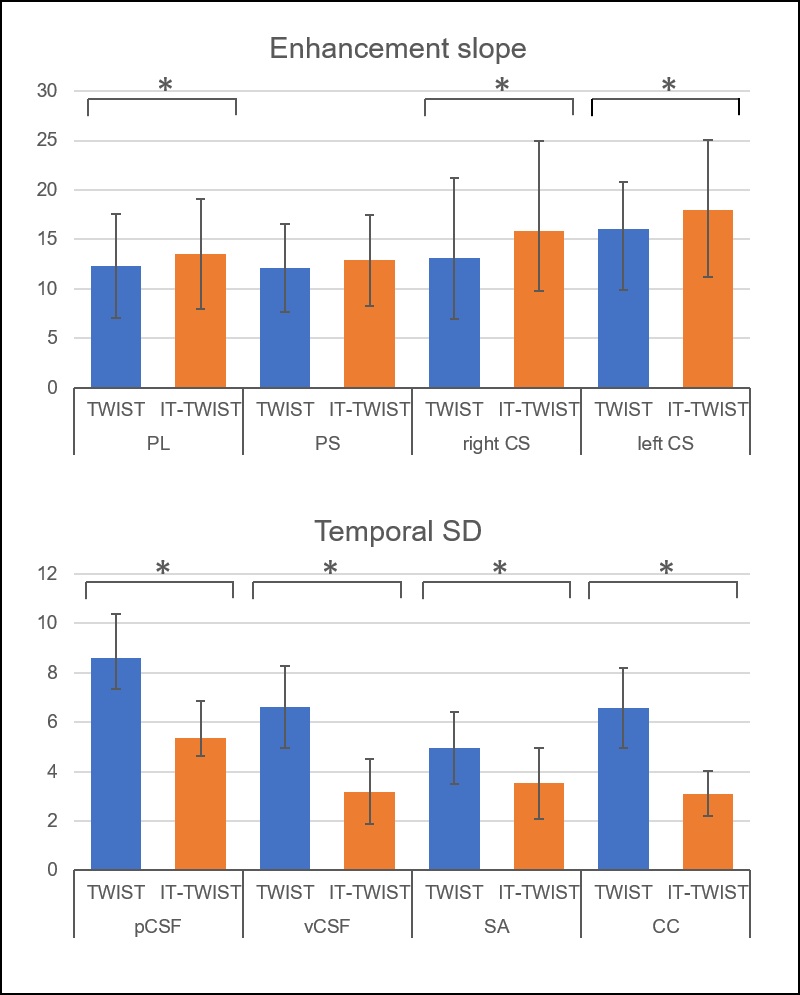
Enhancement slope of PL, PS, and bilateral CS was compared between TWIST and IT-TWIST. Enhancement slope of PL, PS, and bilateral CS of is significantly higher in IT-TWIST than that in TWIST.
(B) Temporal noise of pCSF, vCSF, SA and CC are significantly lower in IT-TWIST compared with TWIST. All error bars except bilateral CS in enhancement slope map indicates standard deviation, error bar of bilateral CS in enhancement slope map indicates interquartile range, because Wilcoxon test was used due to non-normal distribution. Note that asterisks indicate statistical significance (p < 0.0625).