2656
A test-retest multi-site reproducibility study of 4D flow MRI on neurovascular systemYang Fan1, Xiaocheng Wei1, Long Qian1, Jing Wang2, and Bing Wu1
1GE Healthcare China, Beijing, China, 2Center for Medical Device Evaluation, NMPA, Beijing, China
Synopsis
4D flow MRI shows great potential in neurovascular disorders such as stenosis, atherosclerotic disease, aneurysms, and vascular malformations. Its widespread application in neurovascular system requires evidence of good test-retest multi-center reproducibility. The purpose of this study is to assess the multi-center reproducibility and test-retest reliability of 4D flow MRI in measurements of cerebral blood flow/velocity in main intracranial vessels. As a result, high multi-center reproducibility and test-retest reliability was shown for 4D flow MRI in the measurements of blood flow and peak velocity of main intracranial vessels for healthy volunteers.
Introduction
4D flow MRI shows great potential in neurovascular disorders such as stenosis, atherosclerotic disease, aneurysms, and vascular malformations1,2. Its widespread application in neurovascular system requires evidence of good test-retest multi-center reproducibility 3. The purpose of this study is to assess the multi-center reproducibility and test-retest reliability of 4D flow MRI in measurements of cerebral blood flow/velocity in main intracranial vessels.Methods
With the approval of the local ethics board, ten healthy subjects (4 females, age from 22 to 33 years) were included in this study. To assess the multi-center reproducibility and test-retest reliability, all subjects underwent 4D flow MRI scans at three different centers and scanned twice on two different days at each center. All experiments were conducted on GE Discovery MR750 scanners with a standard 8 channel head coil. 4D flow acquisition was performed using the method described in ref (4). A k-t acceleration method, kat-ARC, with a variable density random (VDR) sampling scheme was used leading to an overall under-sampling factor of 8. All 4D flow scans were acquired with the same parameters as following: TE/TR = 2.6 ms/5.1 ms, flip angle = 8o, FOV = 220 x 220 mm2, matrix size = 192 x 192, velocity encoding sensitivity along all three directions = 80 cm/s. A total of 92 sagittal slices were acquired to cover the whole brain with a slice thickness = 2 mm, and was then interpolated to 1 mm using zero filling interpolation. The total scan time was about 6~10 mins depending on the heart rate. 4D flow data analysis was performed using the Arterys software (Arterys Inc, San Francisco, CA). For each scan, region of interest (ROI) based measurements of blood flow (L/min) and peak velocity (cm/s) were performed in five ROIs, bilateral C1 segment of internal carotid arteries (ICAs), bilateral M1 segment of medial cerebral arteries (MCAs) and the superior sagittal sinus. Shapiro-Walk test was conducted to assess normality of measurements in each scan. Coefficient of variances (CV) was computed to evaluate intra- and inter-site variances of all measurements. The multi-center reproducibility was assessed by two-way mixed intra-class correlation coefficient (ICC). Bland-Altman plot and Pearson correlation were used to evaluate test-retest reliability.Results
For illustration, processed 4D flow images of one typical volunteer at two time points from two centers are shown in Fig. 1. Similar vessel morphology and blood velocity field from test and retest scans from different centers were observed. Besides, the blood flow waveforms of left ICA and left MCA of the same subject are also demonstrated in Fig. 1. CVs of both intra- and inter-sites scans are summarized in Fig. 2. Both intra- and inter-site CVs were lower than 12%. Comparing with the CVs of intra-site measurements, inter-sites CVs tend to have higher values for both blood flow and peak velocity. Besides, the CVs of bilateral MCA seem to have increased values compared to those of bilateral ICA. To test the normality of data for further analysis, a series of Shapiro-Walk tests were performed. All p-values for Shapiro-Walk test were greater than 0.05, which indicated the normality of all measurements. Assessment of multi-center reproducibility was performed using ICC (see Table 1). Great multi-center reproducibility was observed for blood flow measurements (all ICC values were larger than 0.9). For peak velocity measurements, all ICC values were greater than 0.8, except that of left MCA (ICC = 0.77). Therefore, good multi-center reproducibility of peak velocity measurements was obtained. The Bland-Altman plot was used to assess test-retest reliability of the blood flow and peak velocity. The Bland-Altman plots and correlation analysis for blood flow and peak velocity are depicted in Fig. 3 and Fig 4, respectively. Both blood flow and peak velocity showed good test-retest agreements in all measured cerebral vessels (mean difference < 5%). Correlation analysis also showed significant test-retest agreement (all r > 0.75 and p < 0.001).Discussion and Conclusion
High multi-center reproducibility and test-retest reliability was shown for 4D flow in the measurements of blood flow and peak velocity of main intracranial vessels for healthy volunteers. Although further studies need to be done in patients, it may facilitate the potential applications of 4D flow MRI in neurovascular system.Acknowledgements
No acknowledgement found.References
[1] Schnell S, Wu C, Ansari SA. 4D MRI flow examinations in cerebral and extracerebral vessels. Ready for clinical routine? Current opinion in neurology 2016;29(4):419. [2] Turski P, Scarano A, Hartman E, et al. Neurovascular 4DFlow MRI (Phase Contrast MRA): emerging clinical applications. Neurovascular Imaging 2016;2(1). [3] Schrauben EM, Johnson K, Huston J, et al. Reproducibility of cerebrospinal venous blood flow and vessel anatomy with the use of phase contrast–vastly undersampled isotropic projection reconstruction and contrast-enhanced MRA. American Journal of Neuroradiology 2014;35(5):999-1006. [4] Lai P, Shimakawa A, Cheng JY, Alley MT, Vasanawala S, Brau AC. Sub-8-minute cardiac four dimensional flow MRI using kat ARC and variable density signal averaging. Journal of Cardiovascular Magnetic Resonance 2015;17(Supplement 1):Q36.Figures
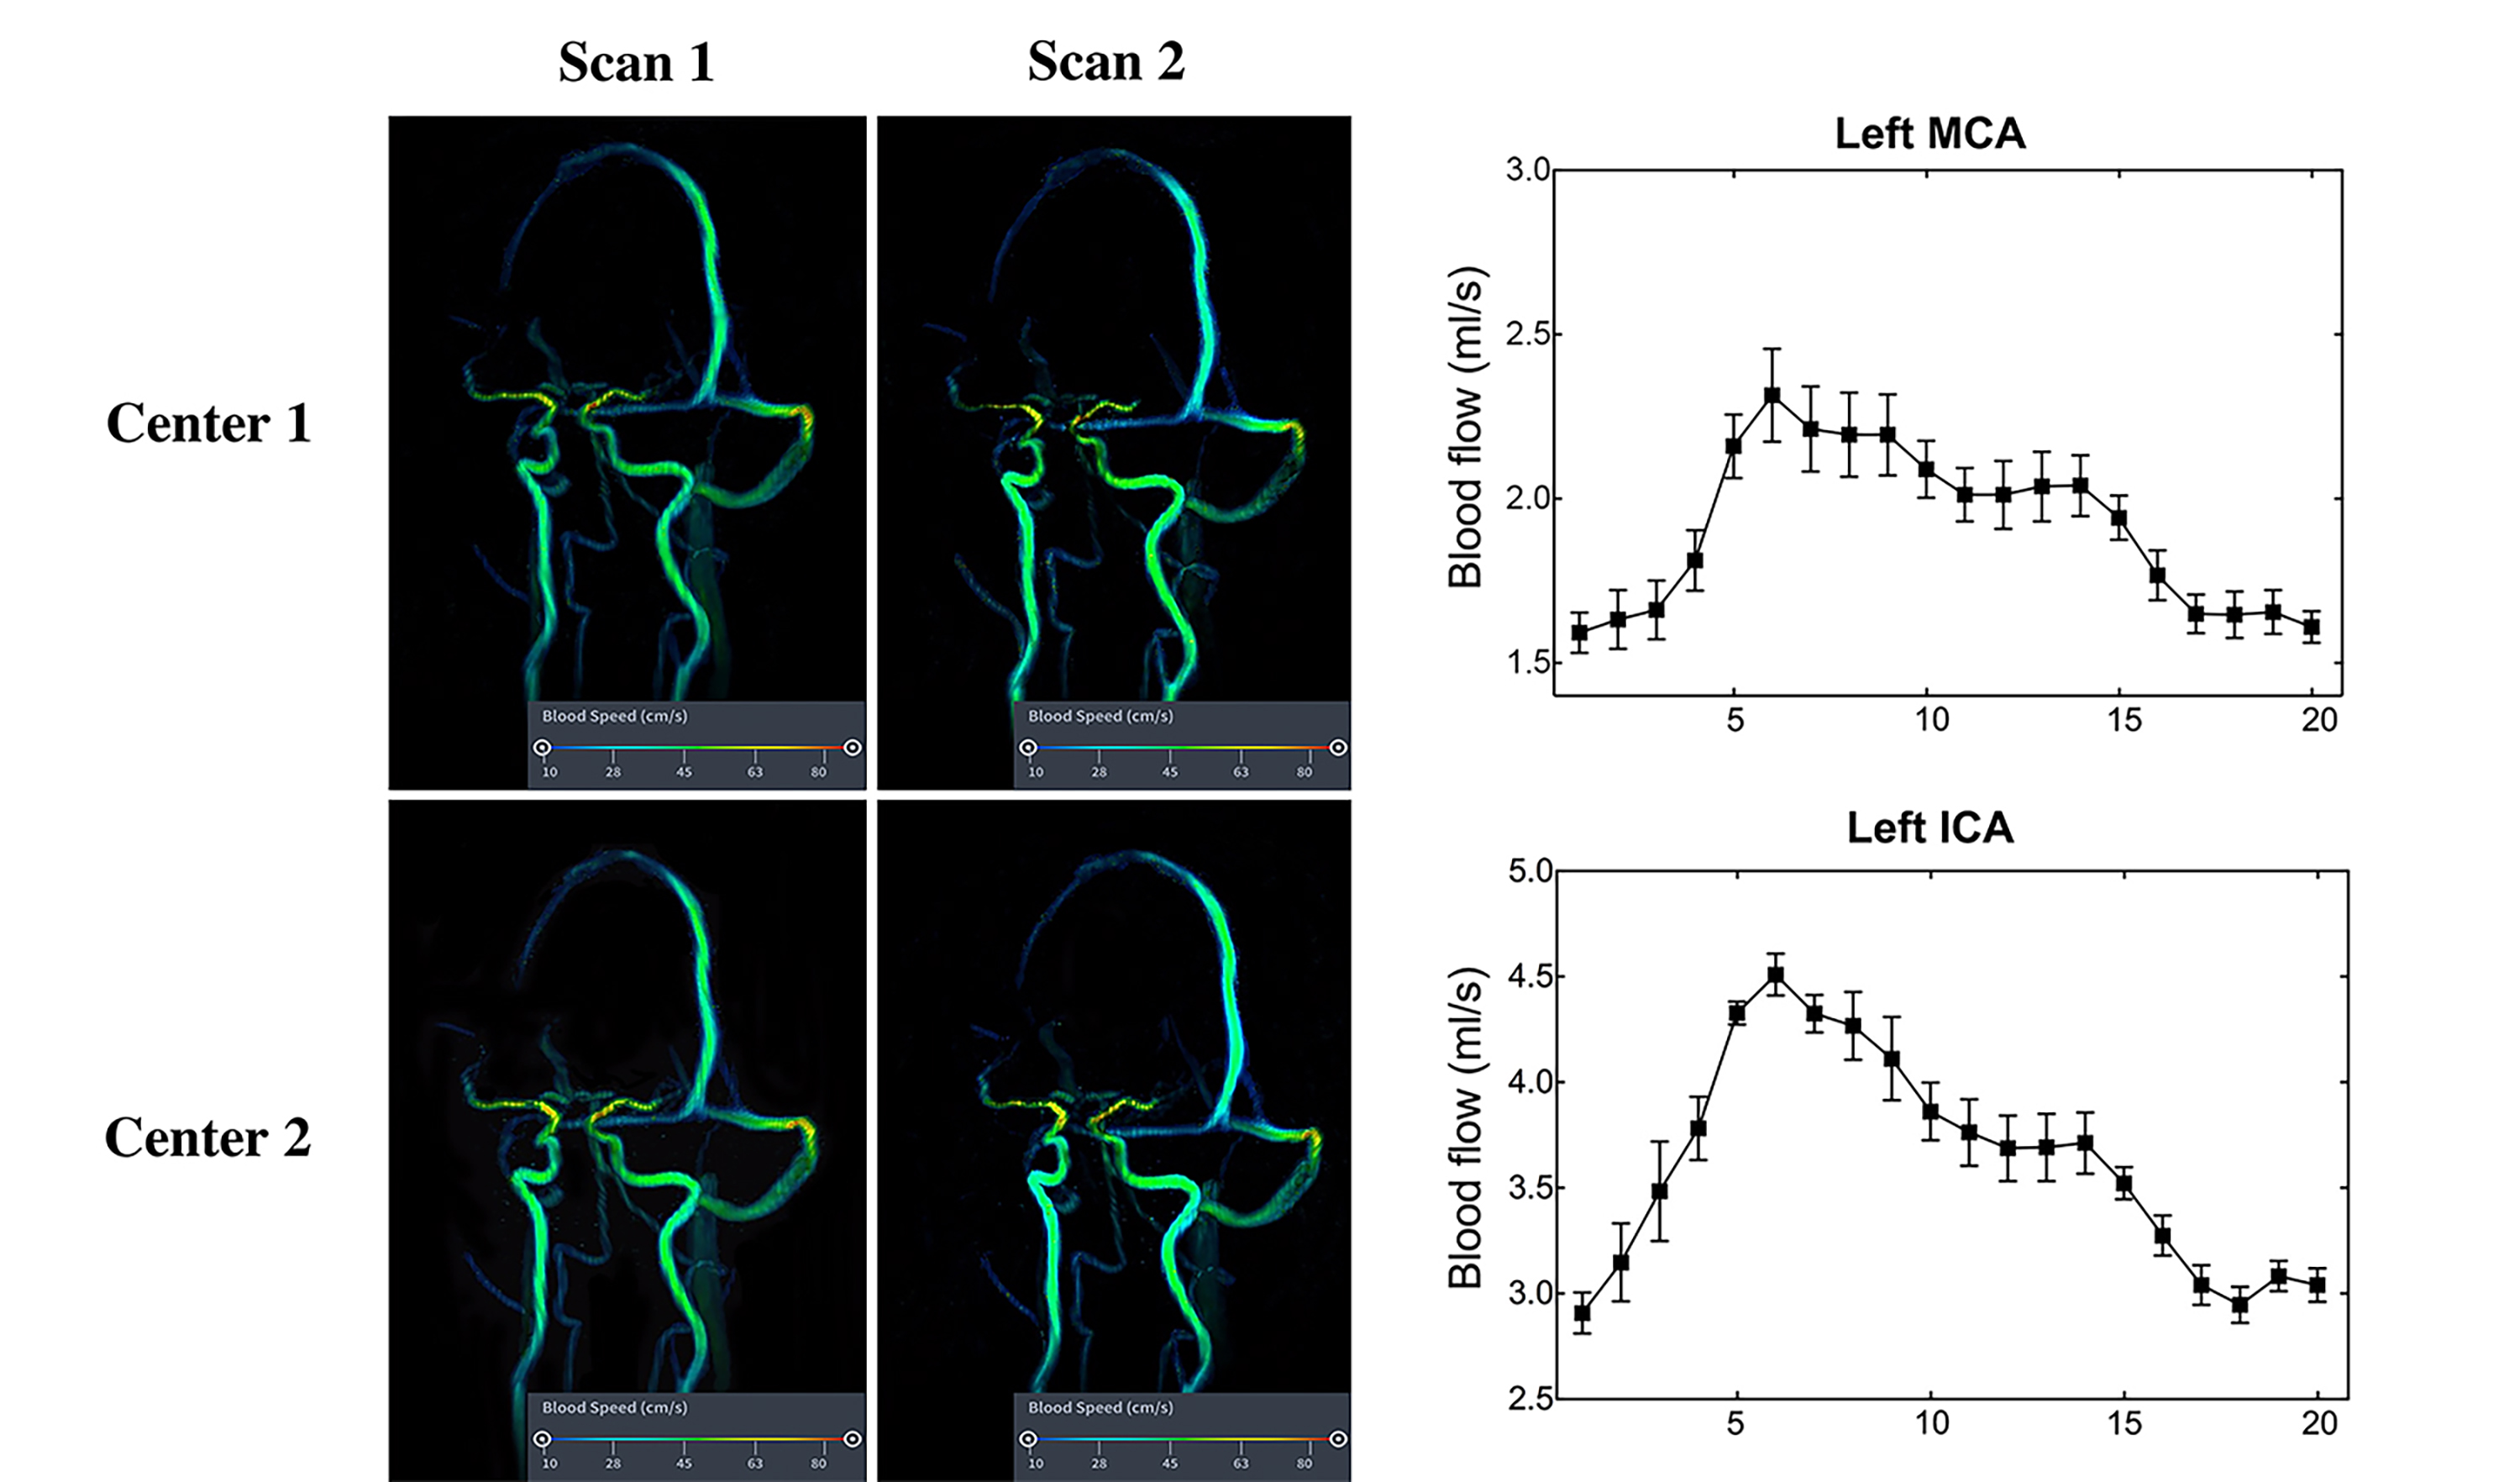
Fig. 1. 4D flow MRI of a typical subject. Post-processing
results from two centers were depicted. For each center, test-retest scans were
shown. Different colors in each figure represents different peak flow velocities.
For each figure, a colorbar was listed. Besides, blood flow waveforms of left
ICA and left MCA from the same subject were shown in the right column. The
black cube represents mean value from all scans and the error bar represents
standard error of all scans. ICA: internal carotid artery; MCA: medial cerebral
artery.
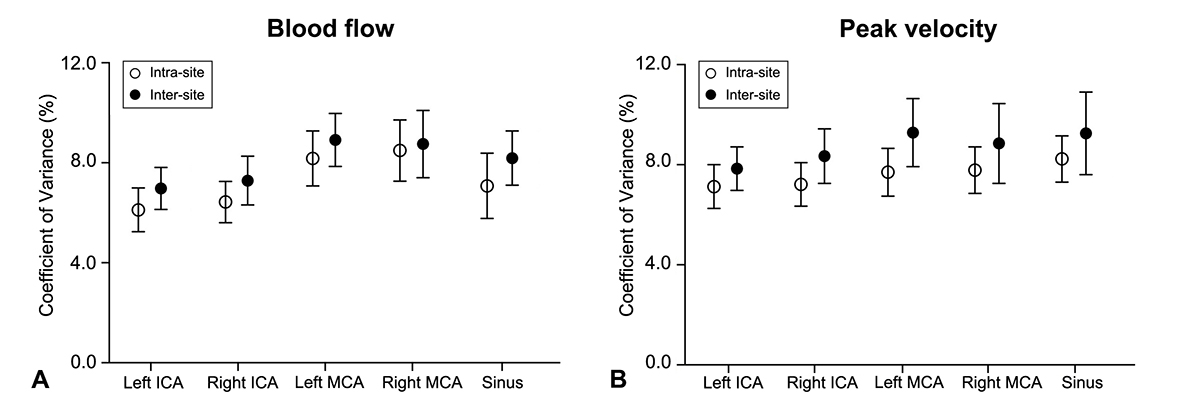
Fig. 2. The coefficient of variance (CV). This
figure shows CV for both intra- and inter-site variances of all measurements. ICA:
internal carotid artery; MCA: medial cerebral artery; Sinus: superior sagittal
sinus.
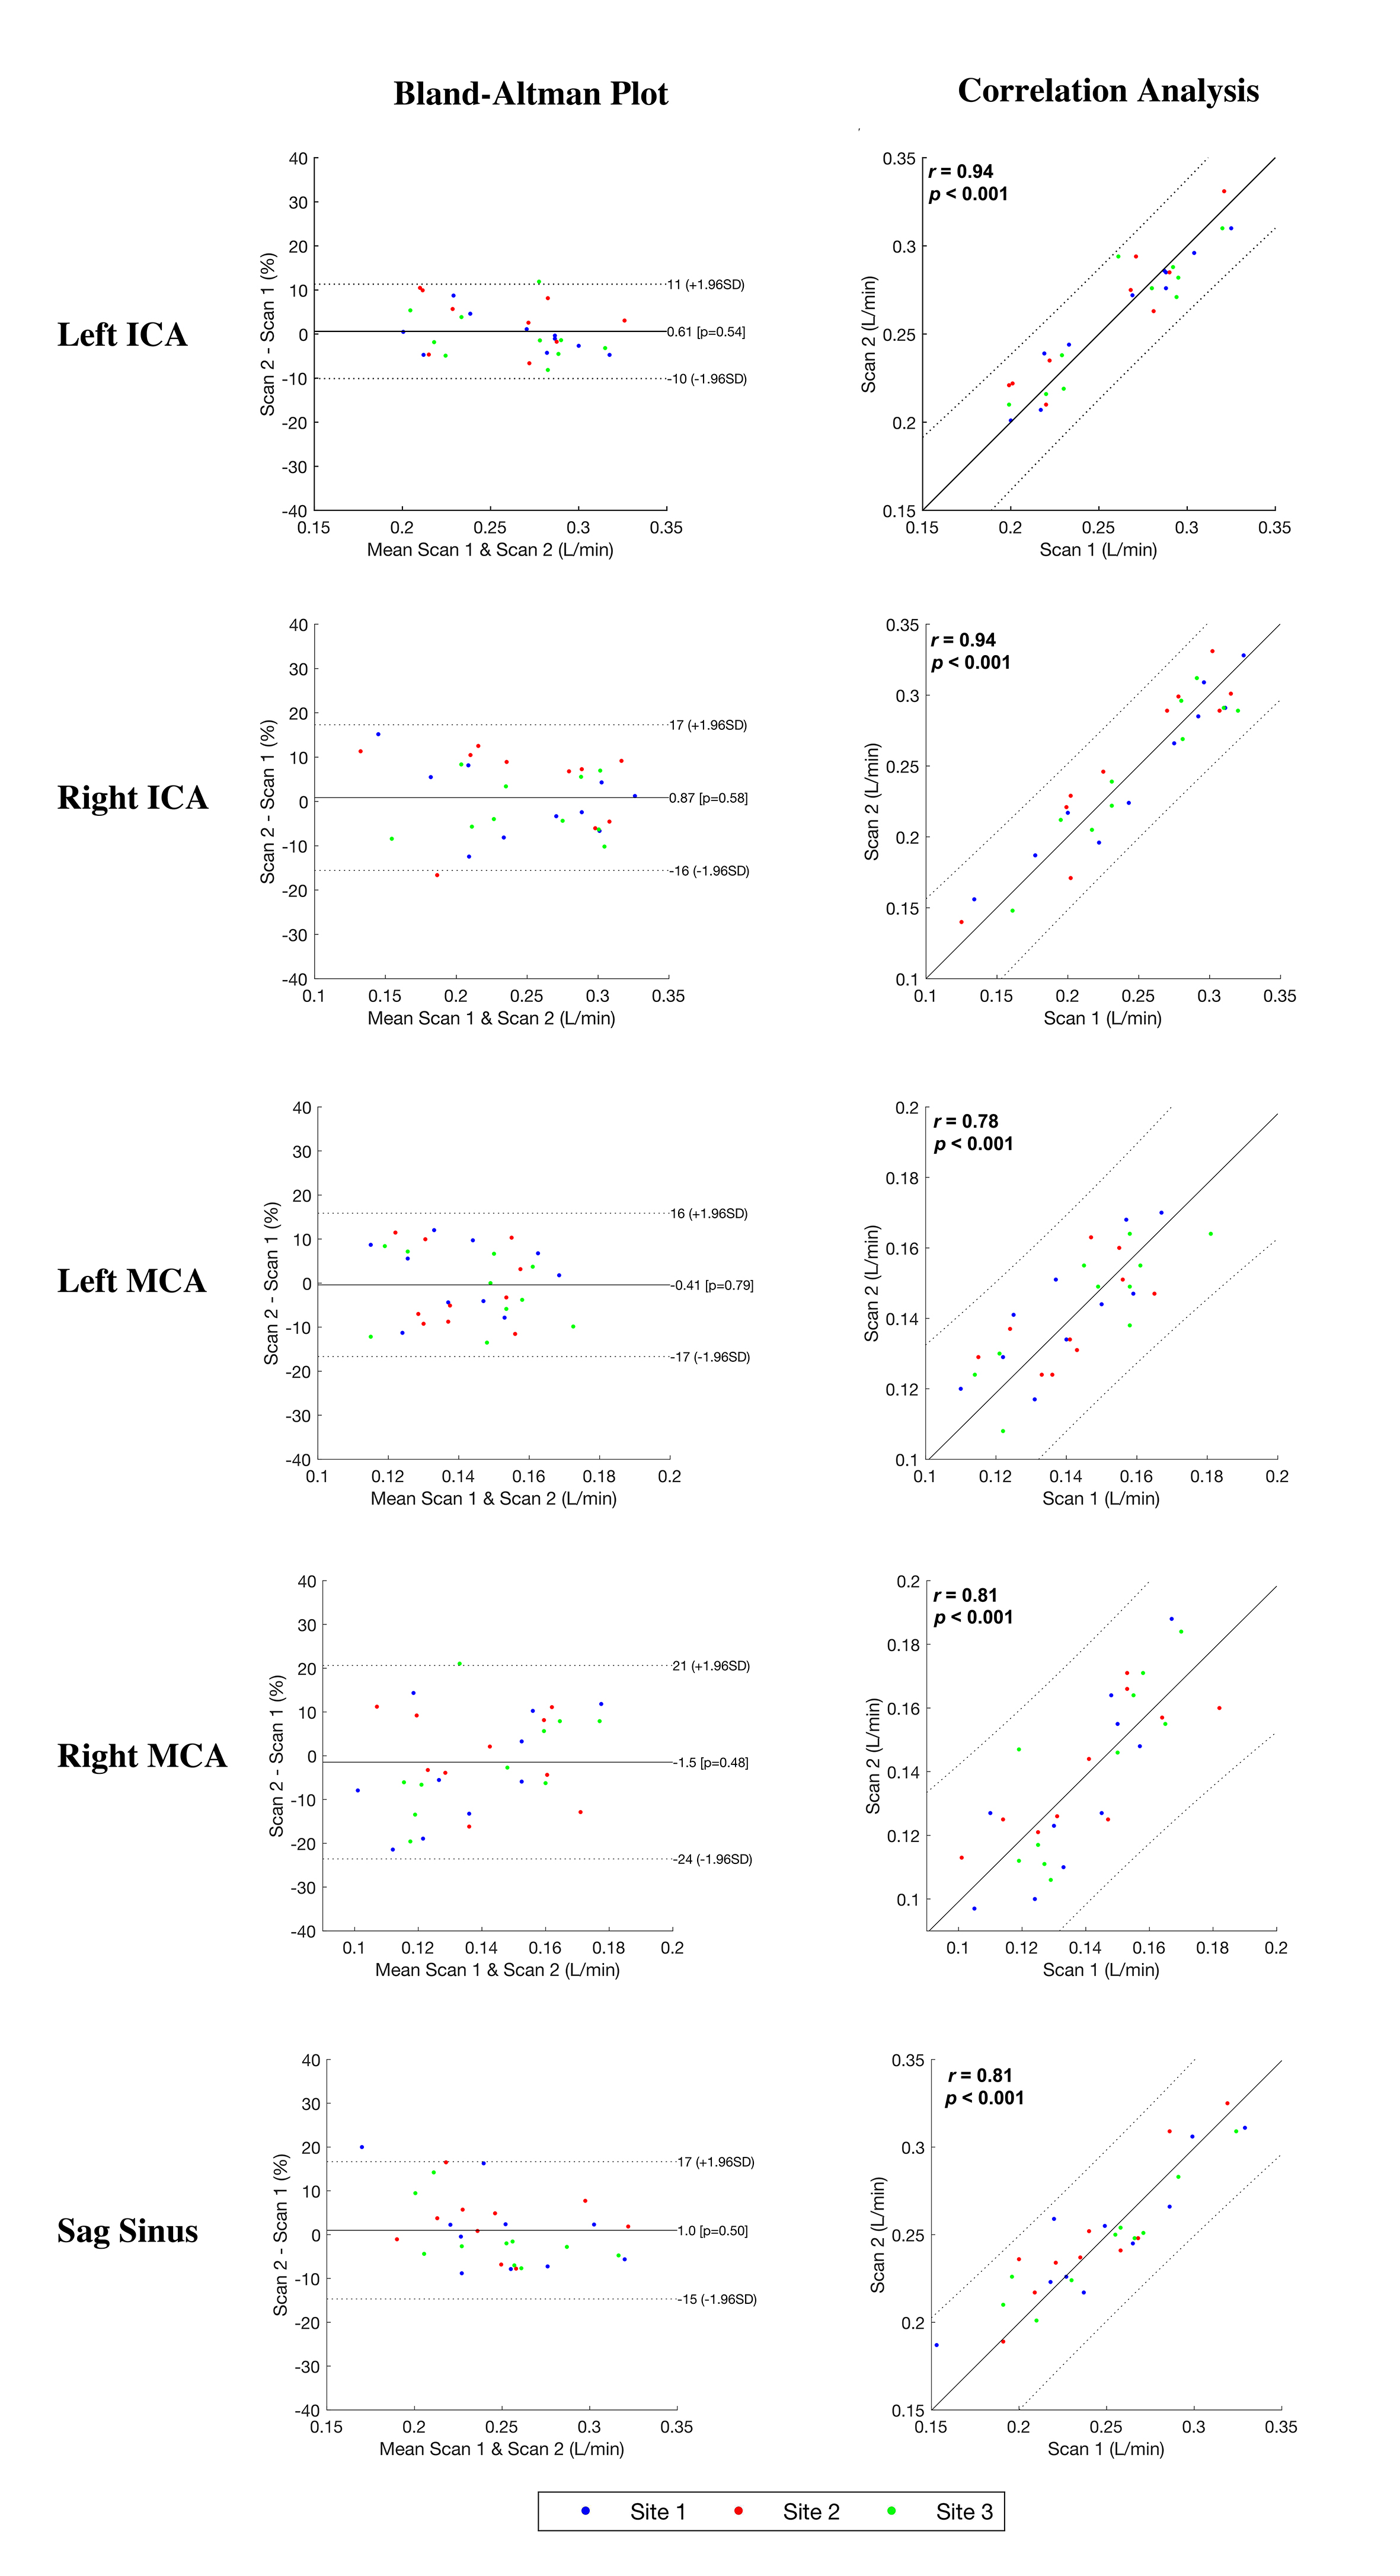
Fig. 3. Bland-Altman plot and correlation
analysis of blood flow from different ROI.
Between-scan
differences are presented using a Bland–Altman plot in the left column.
Between-scan agreements are quantitatively assessed using Pearson correlation
analysis in the right column. Blue, red and green dot represent results from
different sites. ICA: internal carotid artery; MCA: medial cerebral artery; Sag
sinus: superior sagittal sinus.
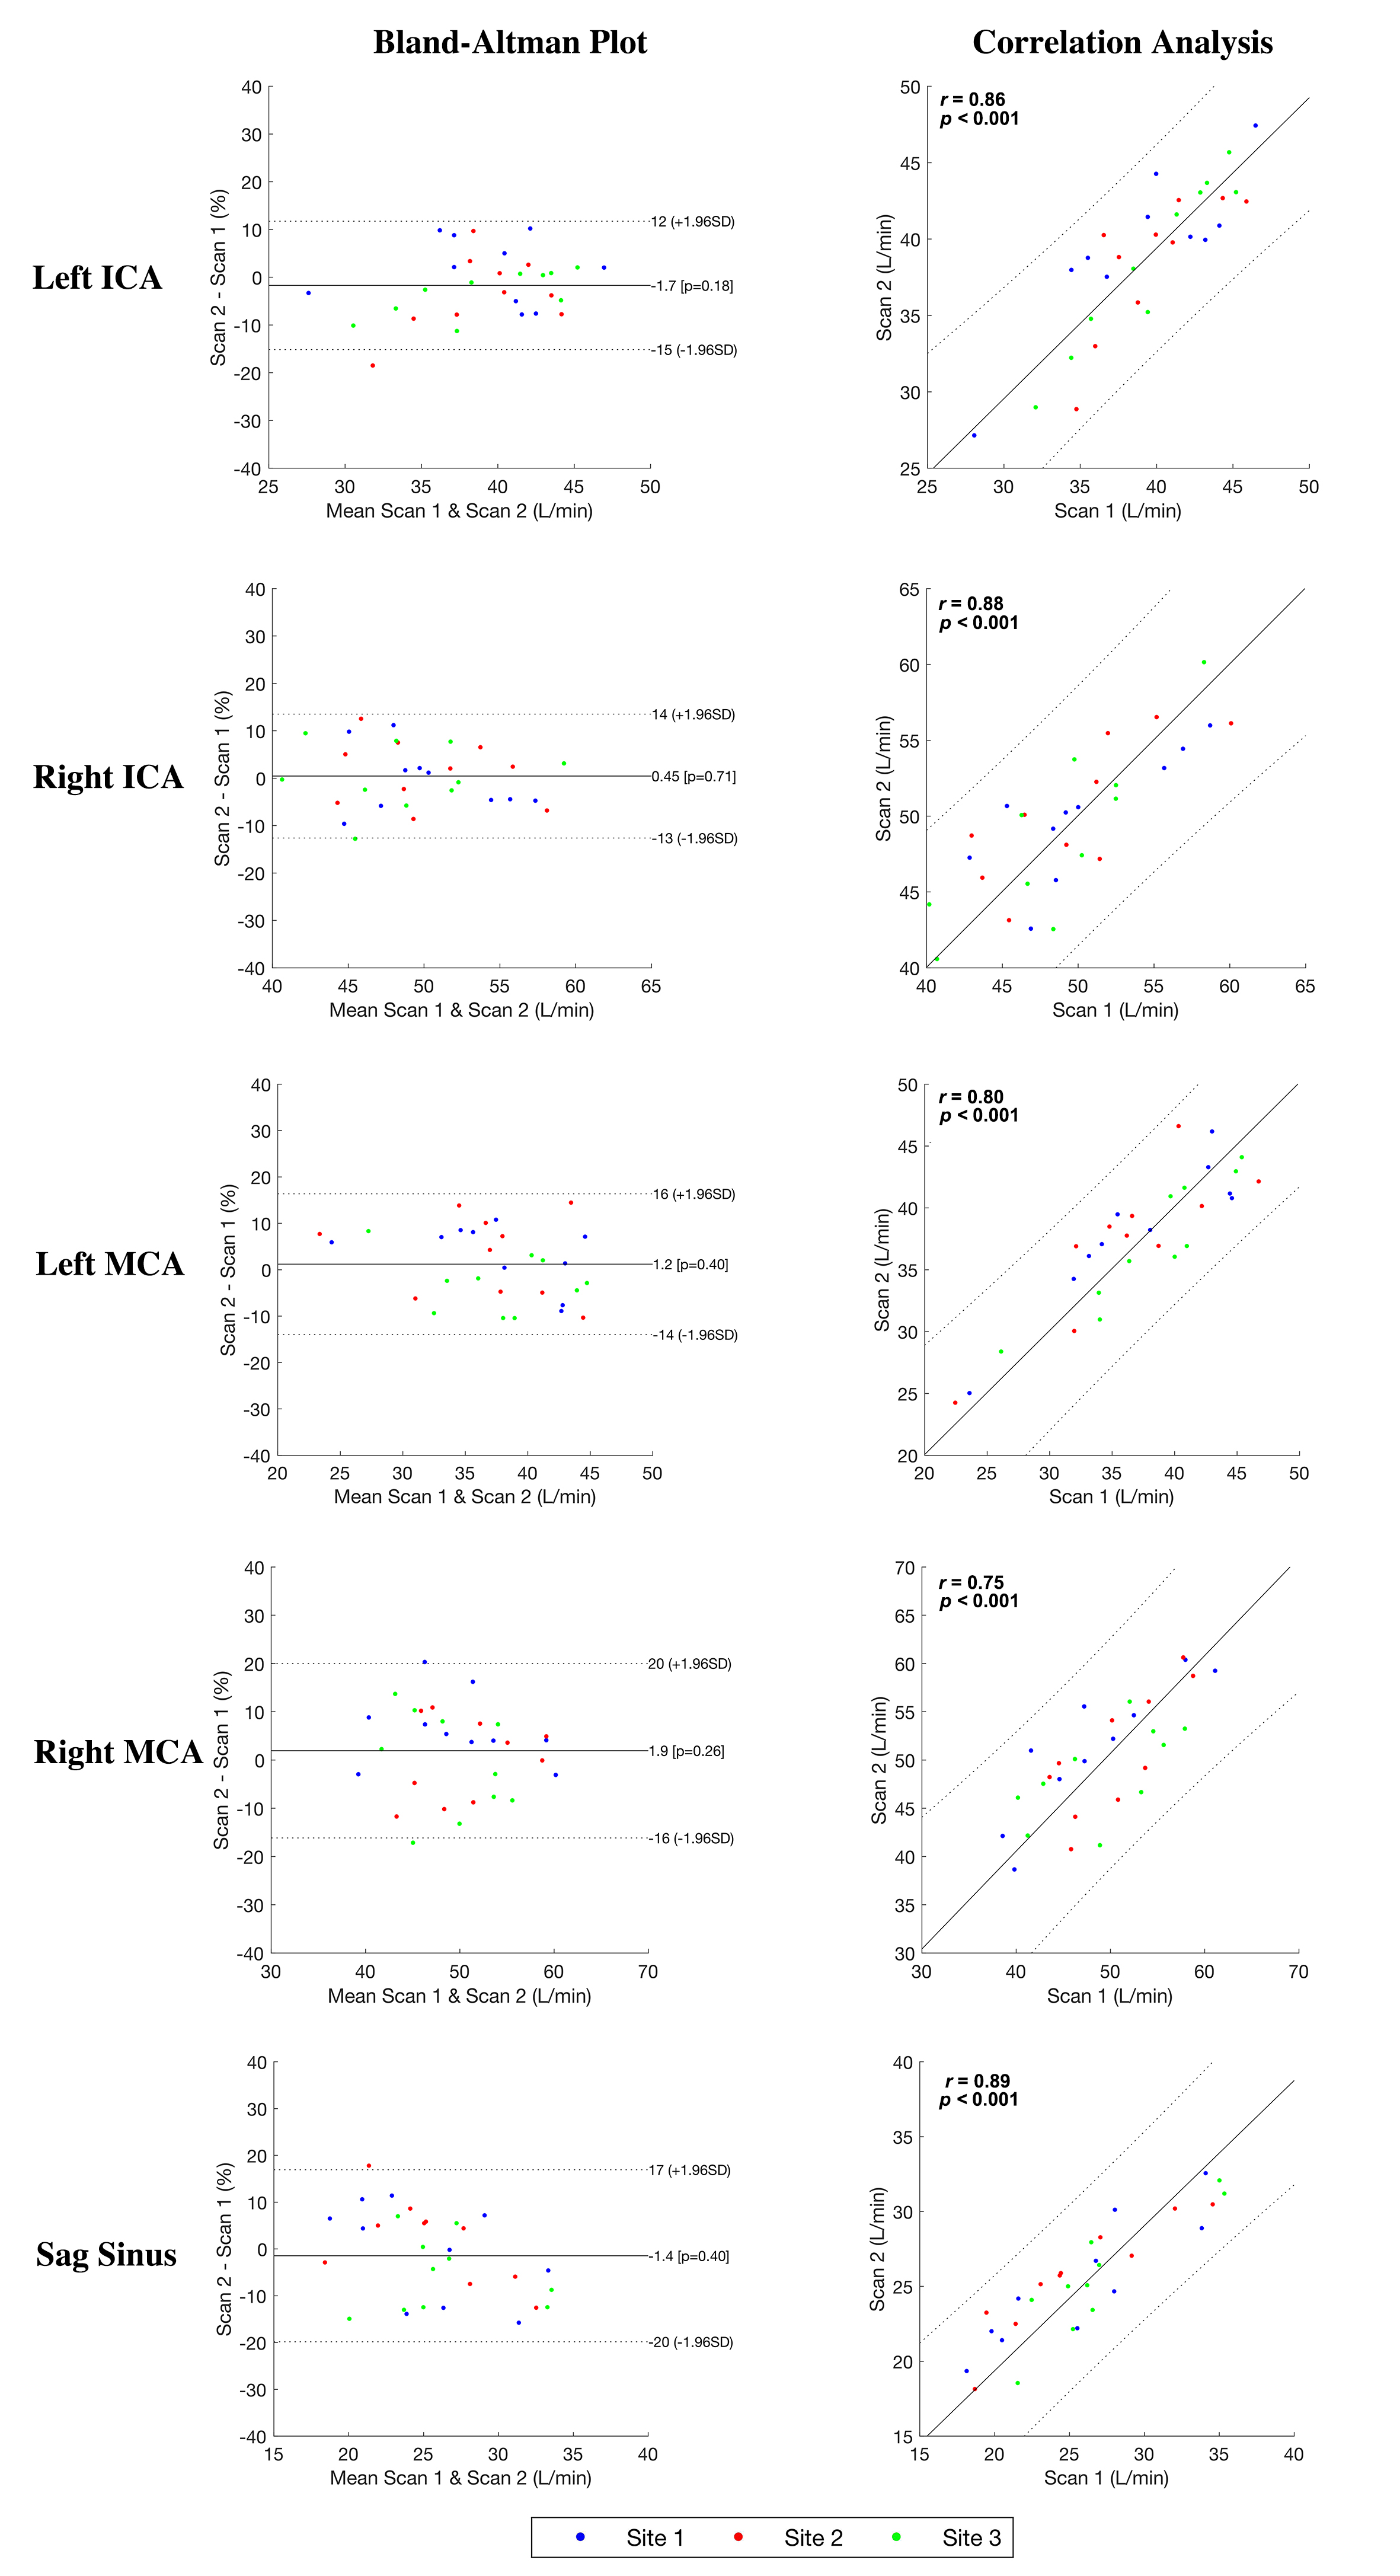
Fig. 4. Bland-Altman plot and correlation
analysis of peak velocity from different ROI.
Between-scan
differences are presented using a Bland–Altman plot in the left column.
Between-scan agreements are quantitatively assessed using Pearson correlation
analysis in the right column. Blue, red and green dot represent results from
different sites. ICA: internal carotid artery; MCA: medial cerebral artery; Sag
sinus: superior sagittal sinus.
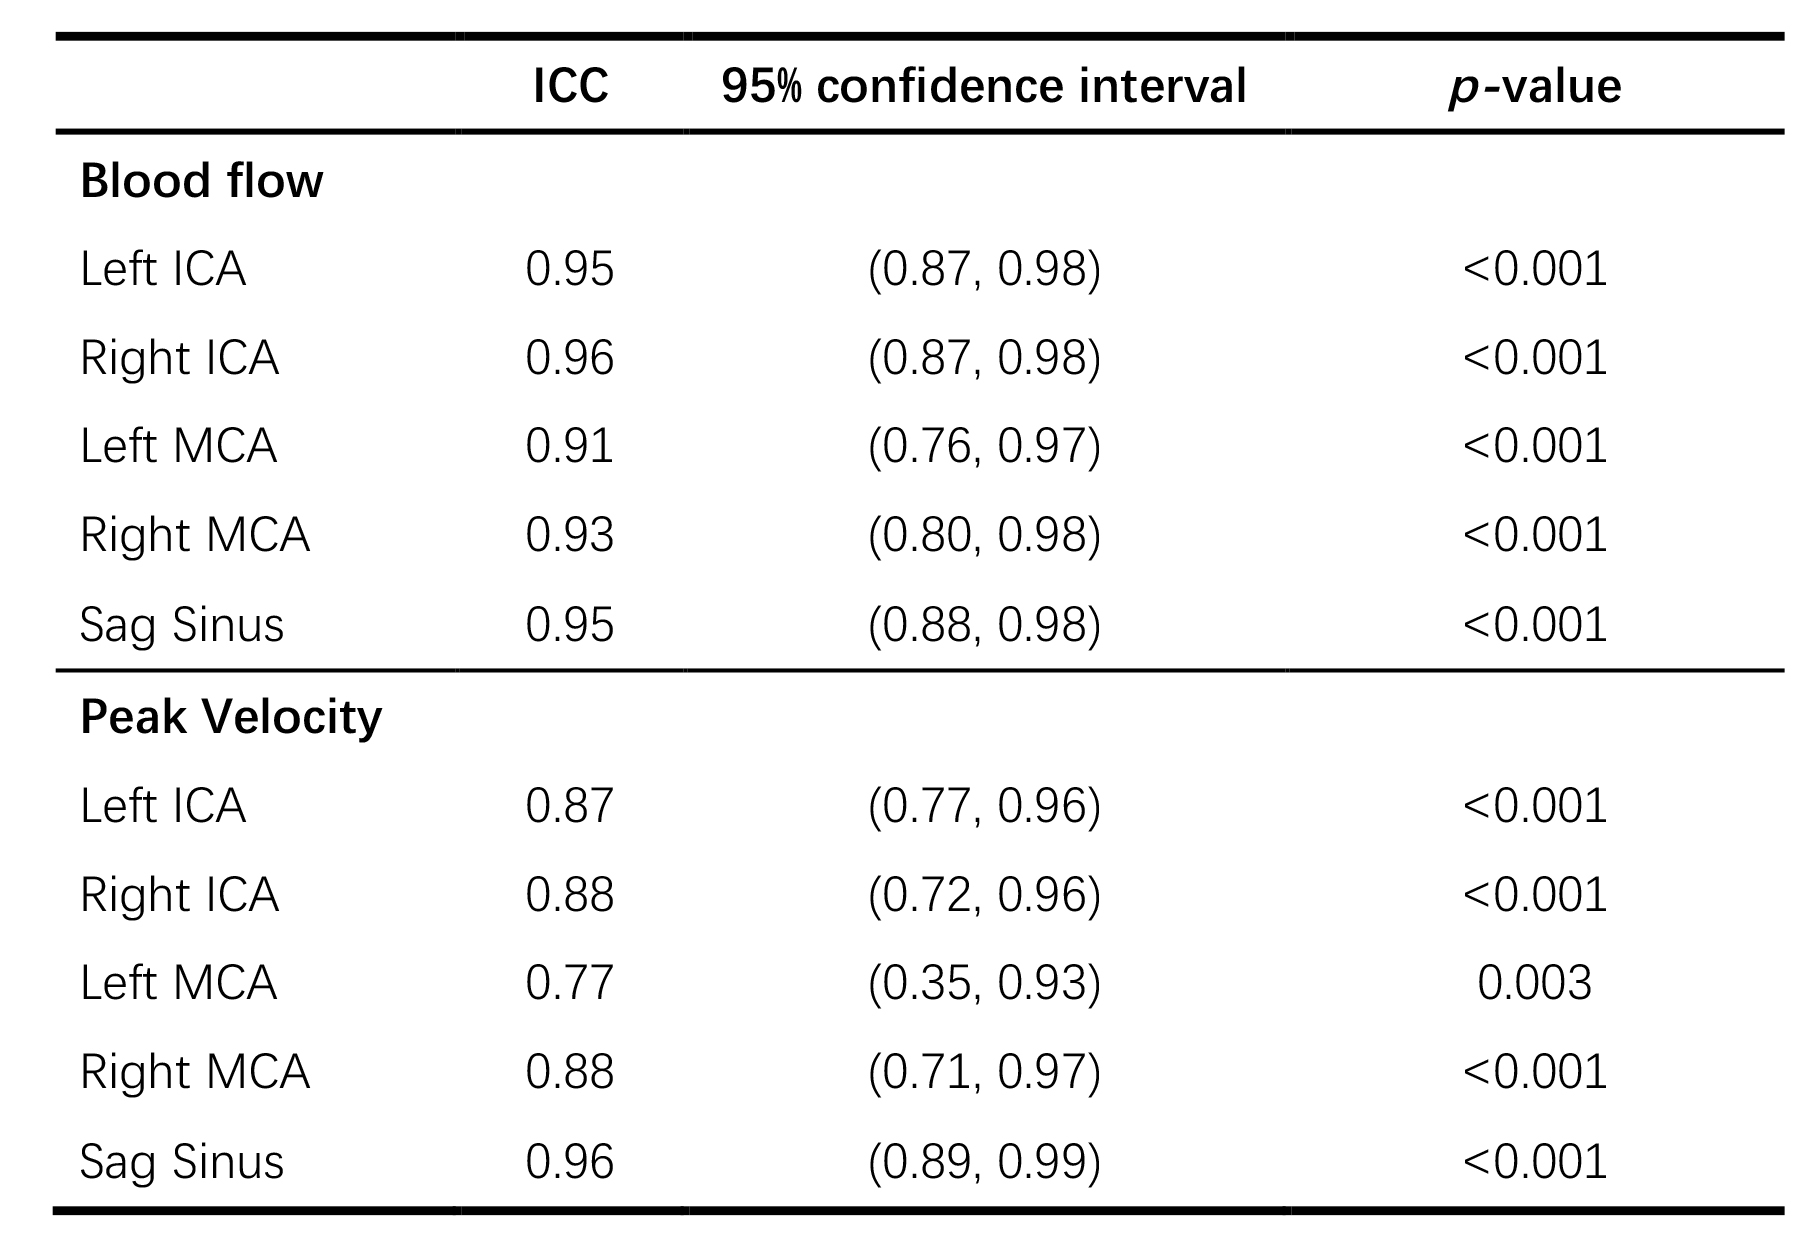
Table 1. Multi-center reproducibility
revealed by intra-class coefficients.
ICA: internal carotid artery, MCA: medial
cerebral artery, sag sinus: superior sagittal sinus.