2652
HIV-Associated Cerebral Small Vessel Disease Measured by Quantitative Susceptibility Mapping1University of Rochester, Rochester, NY, United States, 2Cornell University, Ithaca, NY, United States
Synopsis
HIV-infected older individuals are at increased risk of developing cerebral small vessel disease (CSVD). Quantitative susceptibility mapping (QSM) can be used to asses tissue susceptibility, which can be a measure of CSVD. CSVD tends to occur more frequently in HIV-positive individuals. Limited information in the literature is available on HIV-associated changes in brain tissue susceptibility. In this abstract, we seek to discover relationships between HIV and QSM measures. Brain segmentation and region-based statistics were performed to discover region-based links between HIV and QSM measures and cardiovascular risk factors.
Purpose
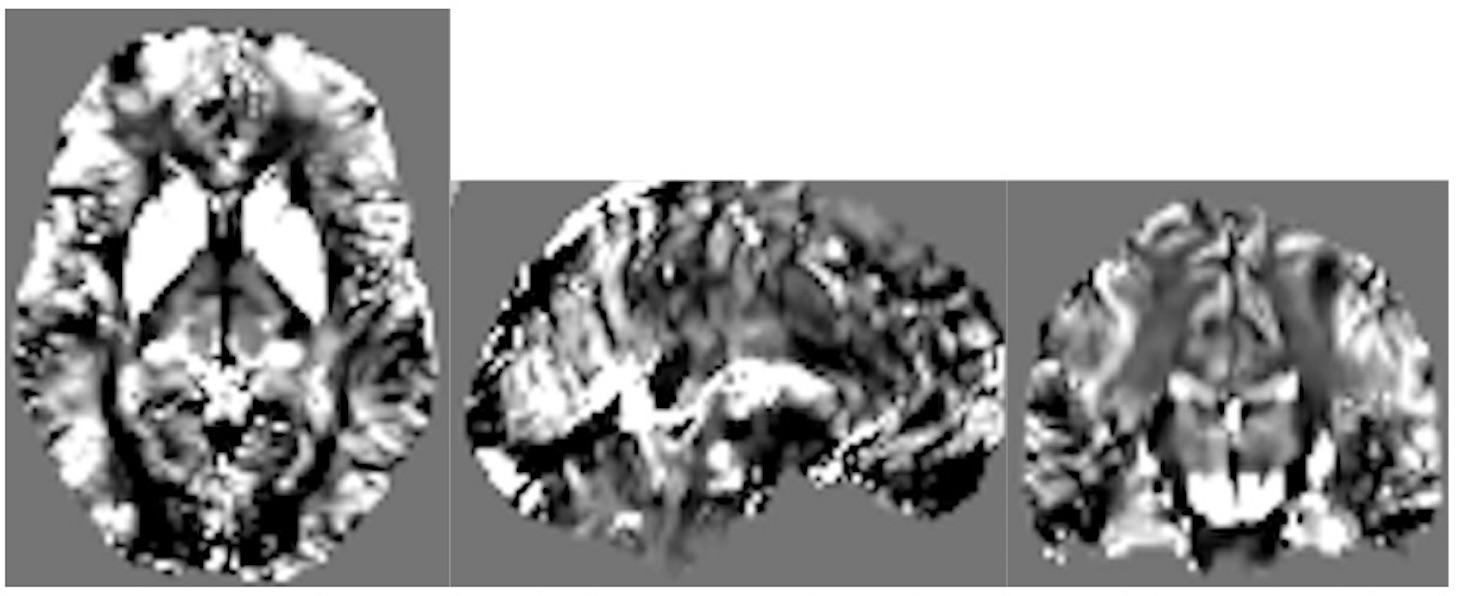
HIV-infected older individuals are at increased risk of developing cerebrovascular disease both in terms of large vessel and cerebral small vessel disease (CSVD).1 CSVD affects small penetrating arteries, arterioles, capillaries and small veins.2 CSVD is clinically diagnosed by the presence of small subcortical infarcts, lacunae, white matter (WM) hyperintensity, enlarged perivascular spaces, cerebral microbleeds and brain atrophy on neuroimaging studies.3 In this regard, Quantitative Susceptibility Mapping (QSM) is a novel approach in MR imaging that maps brain tissue susceptibility throughout the brain by detecting non-heme iron deposition, calcifications, demyelination, and vascular lesions in the brain. Limited information is available in the literature on HIV-associated changes in brain tissue susceptibility. Here we explore global brain tissue susceptibility differences between HIV infected and uninfected individuals matched for age and Reynolds cardiovascular risk score.Methods
In this ongoing study, eighty-seven subjects (mean±SD age = 52.0 ±14.7 years, range = 19 – 78 years) were evaluated to assess CSVD. Thirty-four HIV-positive patients were matched with 53 controls. Brain imaging was conducted on a research dedicated 3T whole-body Siemens Trio Prisma scanner (Erlangen, Germany), equipped with a 64-channel receive-only head coil and body coil transmission, and high-performance gradients of max strength 80mT/m and slew rate of 200mT/m/s. The protocol includes high-resolution T1-weighted anatomical images using the MPRAGE sequence (TI=950ms, TE/TR=3.87ms/1,620ms, 1mm isotropic resolution). QSM data was acquired with a 3D mGRE pulse sequence (8-echo bi-polar readout train, TE of 1st echo=2.7ms, echo spacing =1.5ms, TR=62ms, readout bandwidth=930Hz/pixel, voxel size=0.94×0.94×2mm3, acquisition matrix = 256×256×64). QSM images (Figure 1) were calculated using the Morphology Enabled Dipole Inversion (MEDI) toolbox, with default settings.4,5 T1-weighted images were used to segment subcortical structures in native using FMRIB Software Library’s FIRST and FAST tools.6 We considered major WM tract regions running through the subcortical areas based on the Johns Hopkins University WM atlas.7 Statistical analysis included a two-sample t-test to detect QSM mean difference between HIV cohorts in each region, marginal associations of deep WM and periventricular hyperintensities, and a multivariate linear regression to evaluate the association of QSM on Fazekas scores, hypertension, and Reynolds risk score, after controlling for age and cohort (HIV+ vs. HIV-).Results
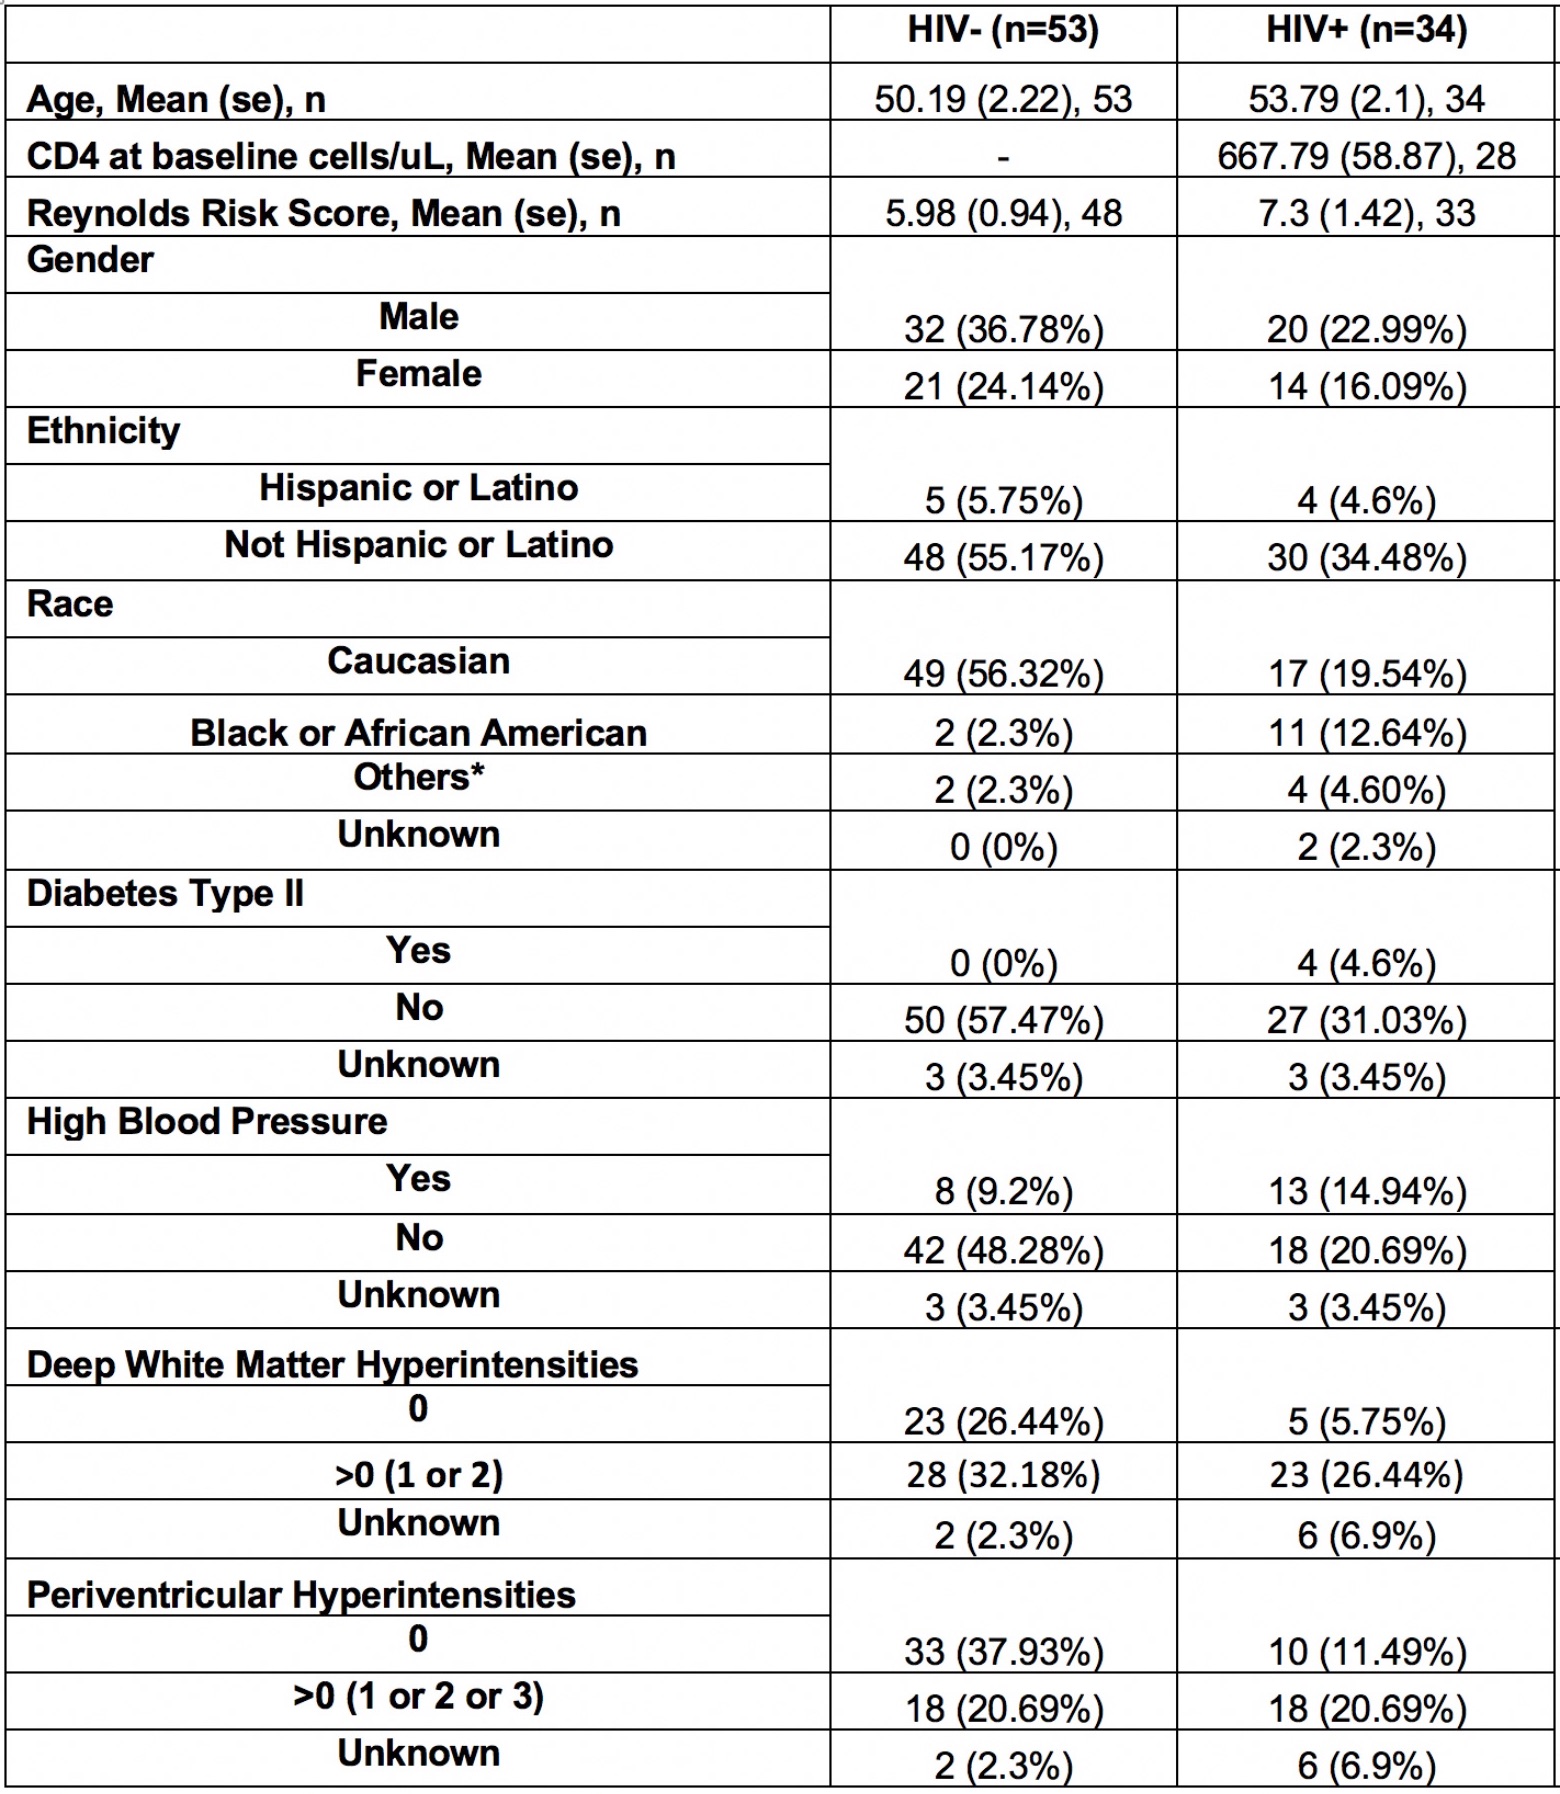
The demographics and clinical variables of interest are listed in Table 1. Of relevance the groups did not differ by age of Reynold CVD score.
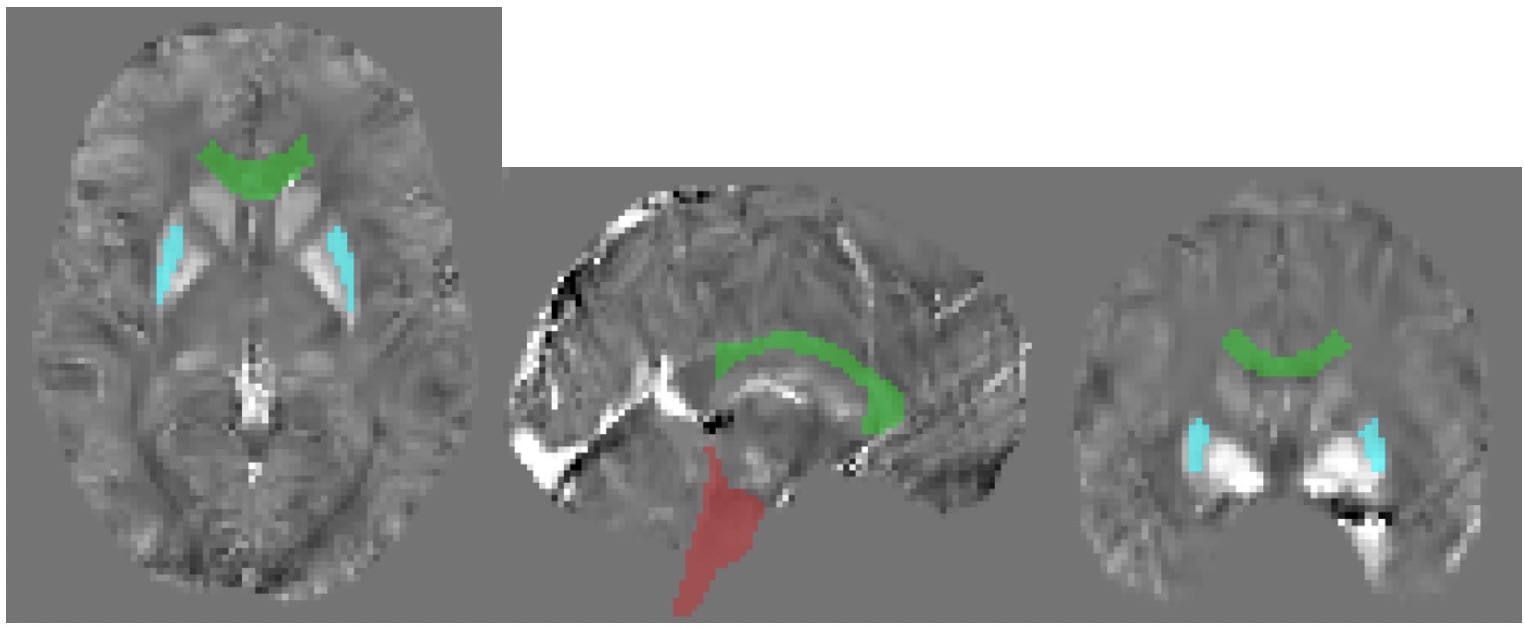
QSM Differences between HIV+ and HIV- among ROIs
The brain stem (p=0.047) and genu of corpus callosum (p=0.028) showed to be statistically significant between the HIV positive and negative populations. The putamen showed marginal significance (p=0.054). All significant structures are shown in Figure 2.
White Matter Hyperintensities (Fazekas Score) vs Clinical Variables and QSM
Reynold’s Risk Scores showed a marginal association with both deep WM and periventricular Fazekas scores with p-values of 0.0123 and 0.0471, respectively. Hypertension was associated only with periventricular hyperintensities.
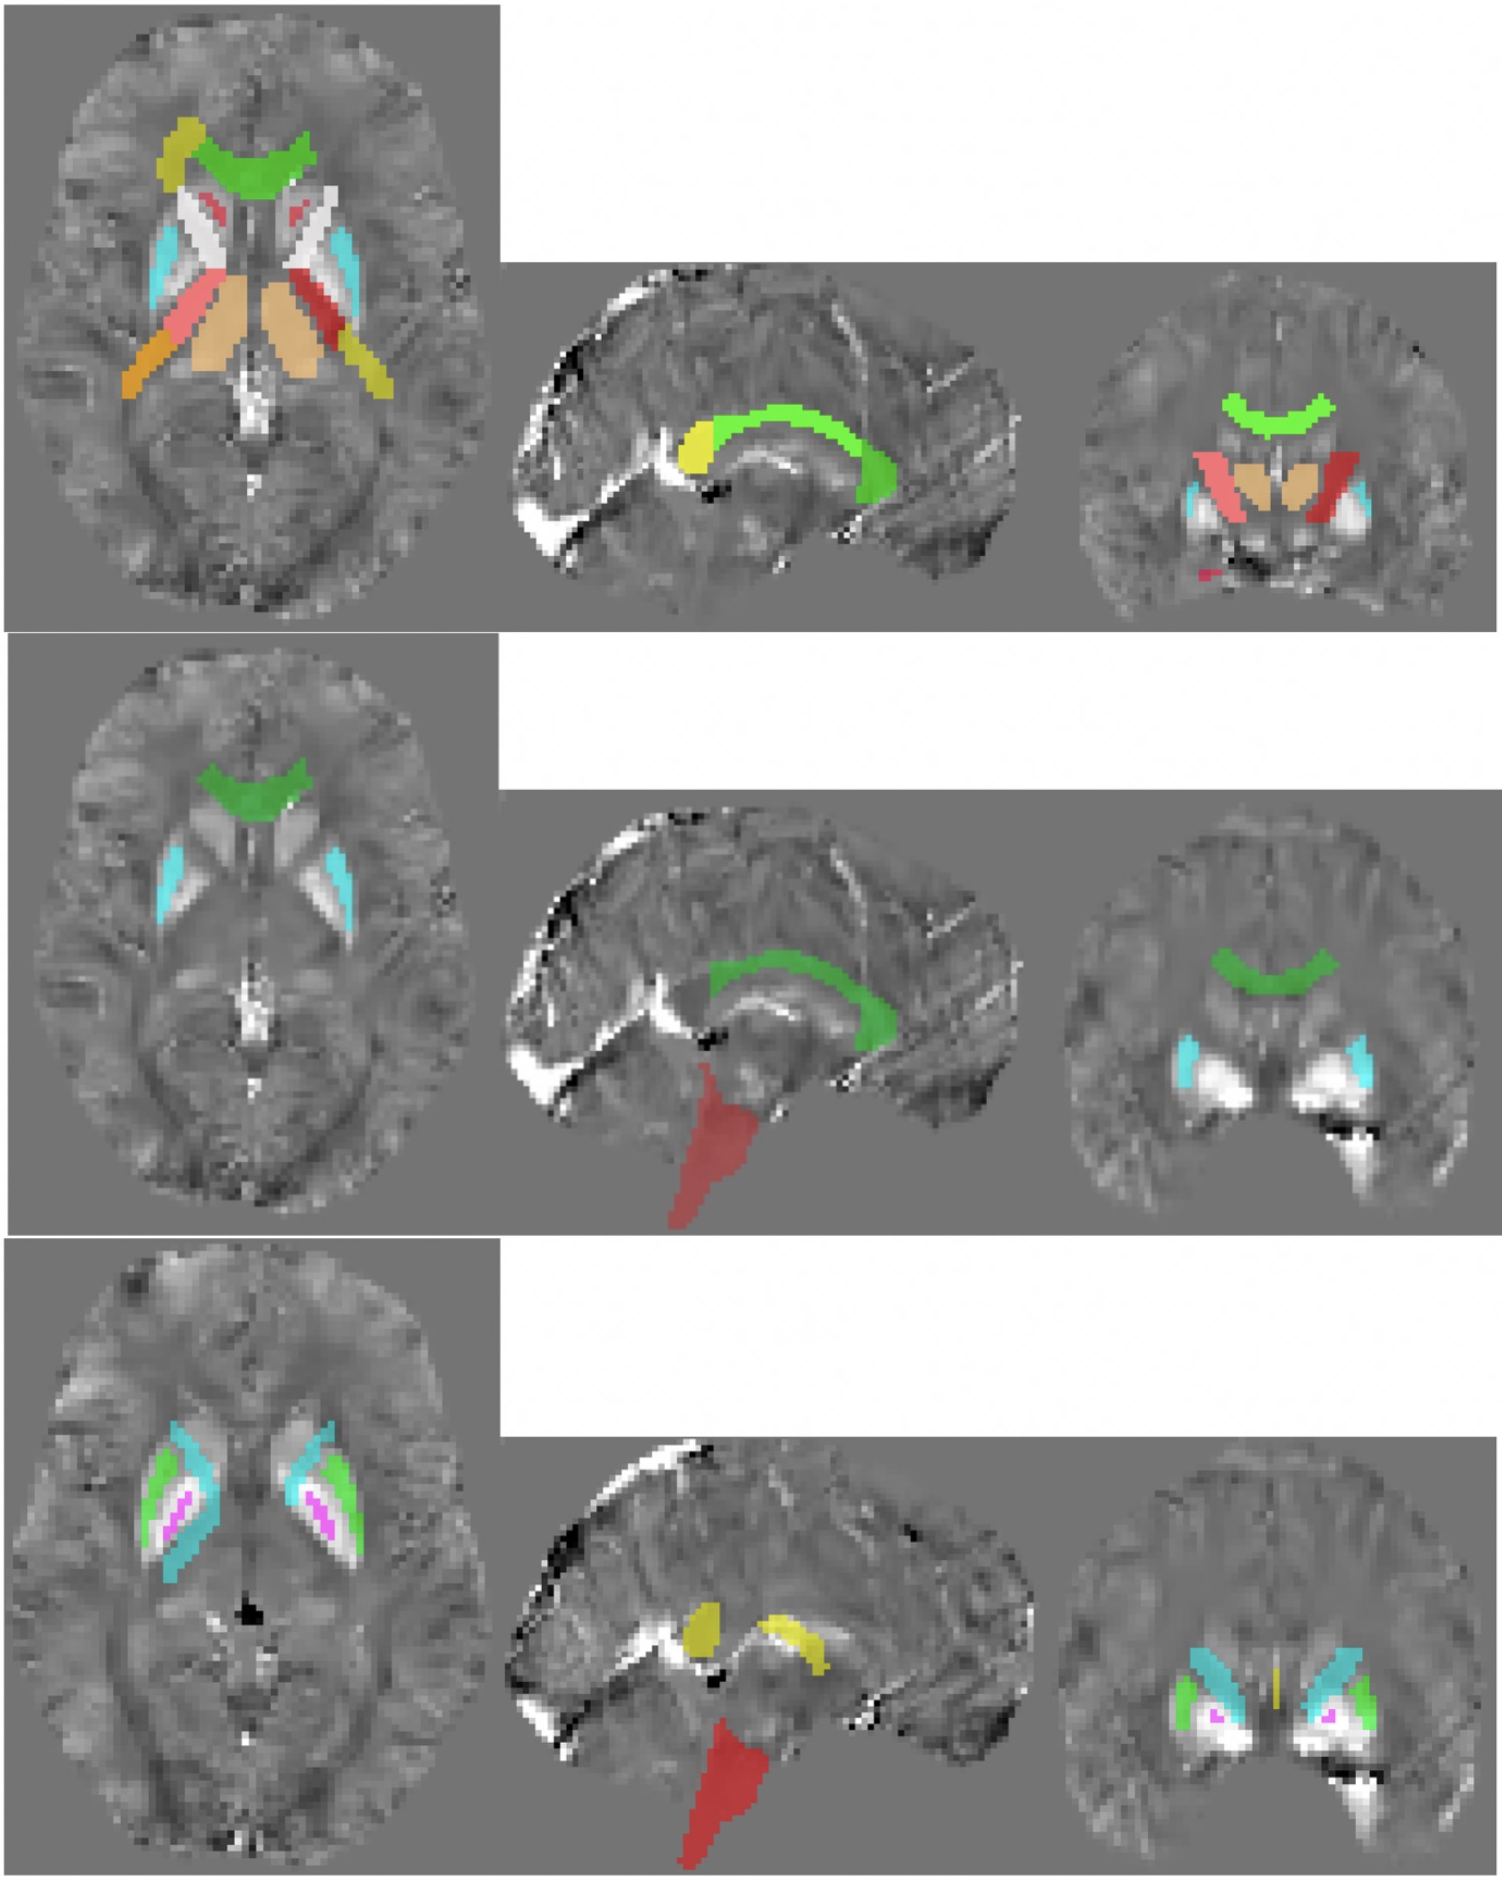
Multivariate Linear Regression Analysis
Reynold’s Risk Score was associated with QSM means in the internal capsule, corpus callosum, caudate, hippocampus, pallidum, and thalamus (p < 0.05 for all). HIV infection was associated with QSM values in the brain stem, genu of corpus callosum, and putamen when adjusting for all other variables. All significant structures per variable are shown in Figure 3.
Discussion
Based on clinical scoring, CSVD tends to occur more frequently in HIV-positive subjects (Fazekas score >0 % vs %). As expected, Reynold’s CVD Risk score is associated with white matter hyperintensity. Lastly, our data suggest that even when accounting for traditional risk factors, HIV is associated with QSM measures in the brain stem, genu of the corpus callosum, and putamen.
Conclusion
In this early evaluation of our ongoing study, we have identified a high percentage of CSVD in HIV infected individuals and also QSM changes reflective of white matter and gray matter abnormalities. Further data acquisition and longitudinal follow-up are expected to strengthen these early conclusions.
Acknowledgements
No acknowledgement found.References
- Vinikoor MJ, et al. Incidence and clinical features of cerebrovascular disease among HIV-infected adults in the Southeastern United States. AIDS Res Hum Retroviruses, 29(7):1068-74, 2013.
- Pantoni L. Cerebral small vessel disease: from pathogenesis and clinical characteristics to therapeutic challenges. Lancet Neurol 9(7):689-701, 2010.
- Wardlaw JM, et al. Neuroimaging standards for research into small vessel disease and its contribution to ageing and neurodegeneration. Lancet Neurol, 12(8):822-38, 2013.
- Liu J, Liu T, et al. Morphology Enabled Dipole Inversion for Quantitative Susceptibility Mapping Using Structural Consistency Between the Magnitude Image and the Susceptibility Map. Neuroimage, 59(3): 2560-2568, 2013.
- Liu T, et al. Nonlinear Formulation of the Magnetic Field to Source Relationship for Robust Quantitative Susceptibility Mapping. Magn Reson Med 69:467-476, 2013.
- Jenkinson M, Beckmann CF, Behrens TE, Woolrich MW, Smith SM. FSL. Neuroimage, 62:782-90, 2012.
- Mori et al. MRI Atlas of Human White Matter. Elsevier, Amsterdam, The Netherlands. 2005.
Figures