2650
Functional and Microstructural Changes in the Brain After Carotid Endarterectomy1Biomedical Engineering, University of Arizona, Tucson, AZ, United States, 2Psychology, University of Arizona, Tucson, AZ, United States, 3Medical Imaging, University of Arizona, Tucson, AZ, United States, 4Vascular Surgery, University of Arizona, Tucson, AZ, United States
Synopsis
Carotid endarterectomy (CEA) for clinically asymptomatic patients has been shown effective in reducing stroke risk. The impact that CEA has on functional connectivity or microstructure in the brain has not been studied. 14 clinically asymptomatic underwent resting state fMRI (rs-fMRI), diffusion MRI (dMRI), and neurocognitive testing pre-operatively and 4-6 months post-operatively. Functional correlation analysis on rs-fMRI was performed by analyzing the average within network correlations. Apparent fiber density calculations were performed to assess the microstructural changes before and after surgery. RS-fMRI and dMRI analysis showed changes before and after CEA.
Introduction
Carotid artery stenosis (CAS) has been associated with increased risk of stroke, but the long term impact on cognition is not clear1. Carotid endarterectomy (CEA), surgery to remove carotid plaque, decreases stroke risk2, but whether CEA affects brain function, structure, and long-term cognition is unknown. To address this issue, the current study was carried out to investigate the impact of CEA on the functional connectivity in the brain as assessed via resting state functional MRI(rs-fMRI), on tissue microstructure using diffusion MRI(dMRI), and on cognitive performance. This study helps to identify quantifiable imaging measures in the asymptomatic CAS population as well as evaluate the contribution of vascular disease to cognitive dysfunction.Methods
Fourteen patients (10 males, age=69.3±7.3) who had clinically asymptomatic internal CAS (9 left side, 5 right side) who were to undergo CEA, were enrolled. Each subject underwent neurocognitive testing and imaging pre-operatively, and 4-6 months post-operatively. In each imaging session, a T1-weighted MPRAGE (TR/TE=2530/3.3 ms, 1mm isotropic resolution), a single shot EPI dMRI (TR/TE=3700/115 ms, 2mm isotropic resolution, MultibandFactor=3, GRAPPA factor=2) with 14 b=0s/mm2, 20 b=1000s/mm2, 32 b=2000s/mm2, and 64 b=3000s/mm2, and resting state fMRI (TR/TE=1200/30ms, 3mm isotropic resolution, MutibandFactor=3, 250 repetitions) were collected on a 3T Siemens Skyra. fMRI data was preprocessed using Matlab, SPM and CONN Toolbox. Motion, field map, and slice timing correction were performed using SPM. Diffusion MRI were preprocessed using FSL’s TOPUP and EDDY, LPCA denoising, and ANTs’ N4 algorithm to correct for EPI distortions, eddy current distortions, noise and bias fields, respectively3-6.
For rs-fMRI data, independent component analysis was performed to ensure data quality and consistency. Further analysis was performed through correlation matrix analysis to look at within functional network correlations. This was done by determining a Fisher z-to-r transformed Pearson correlation coefficient between each ROI within a functional network7, then taking an average of the correlation values for each network. Further analysis was performed to look at the individual correlations between ROIs within the precuneus network. Imaging results were correlated with neurocognitive tests using Spearman’s correlations due to the small sample size and for potential outliers.
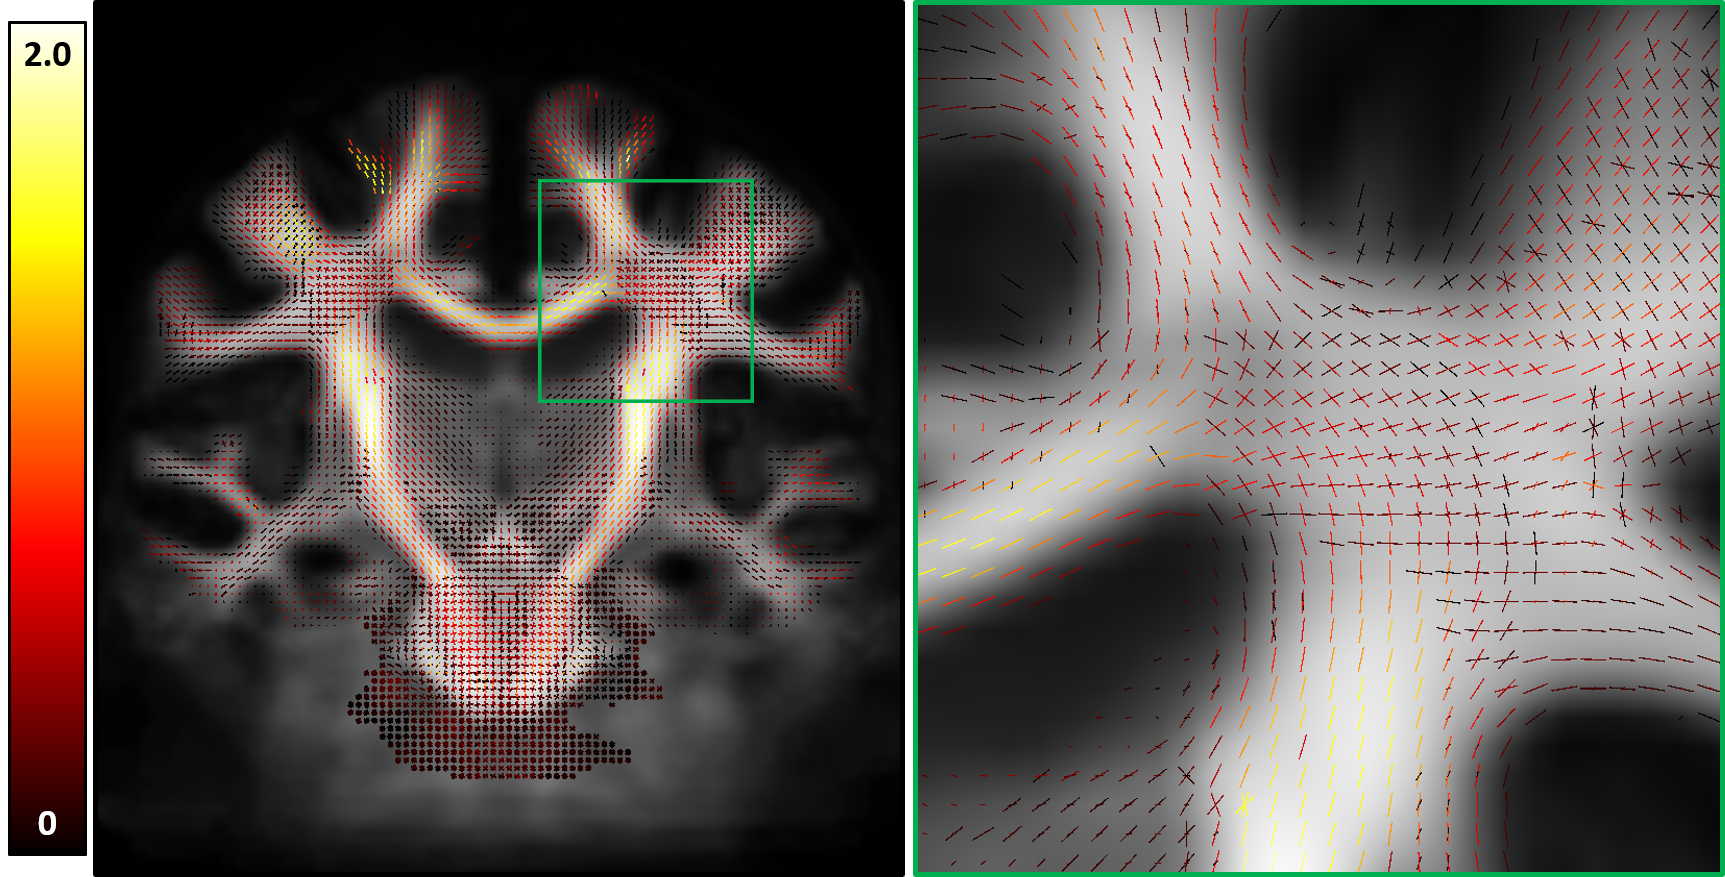
Apparent fiber density (AFD) fixel maps (Figure 1) were produced by first creating a study specific template of fiber orientation distributions (fODFs), computed using multi-shell multi-tissue constrained spherical deconvolution using a group average white matter response function. Each subjects’ fODF image was then registered to the template, fODFs were reoriented according to the local affine transformation required to put them in template space, and a white matter fixel correspondence was determined for every fixel between the subject’s registered fODF map and the template fODFs8. Finally, a pairwise difference of AFD was calculated for each subject before and after surgery, and these difference maps were averaged to look for changes in AFD as a result of CEA.
Results
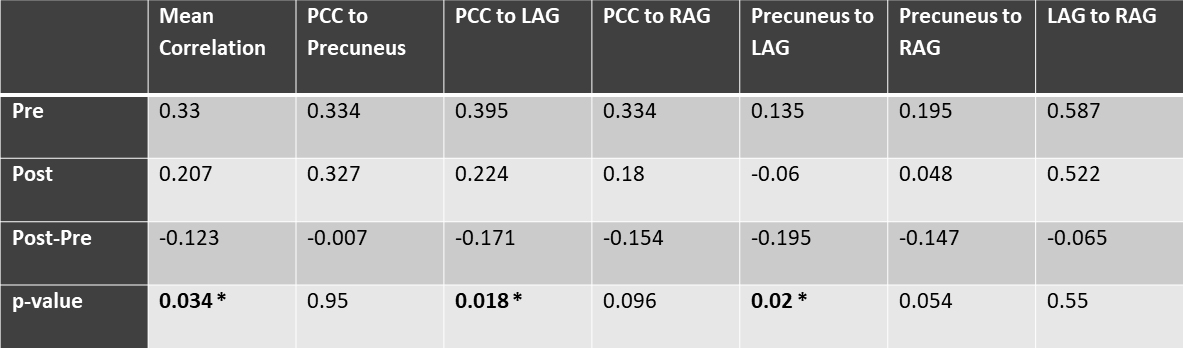
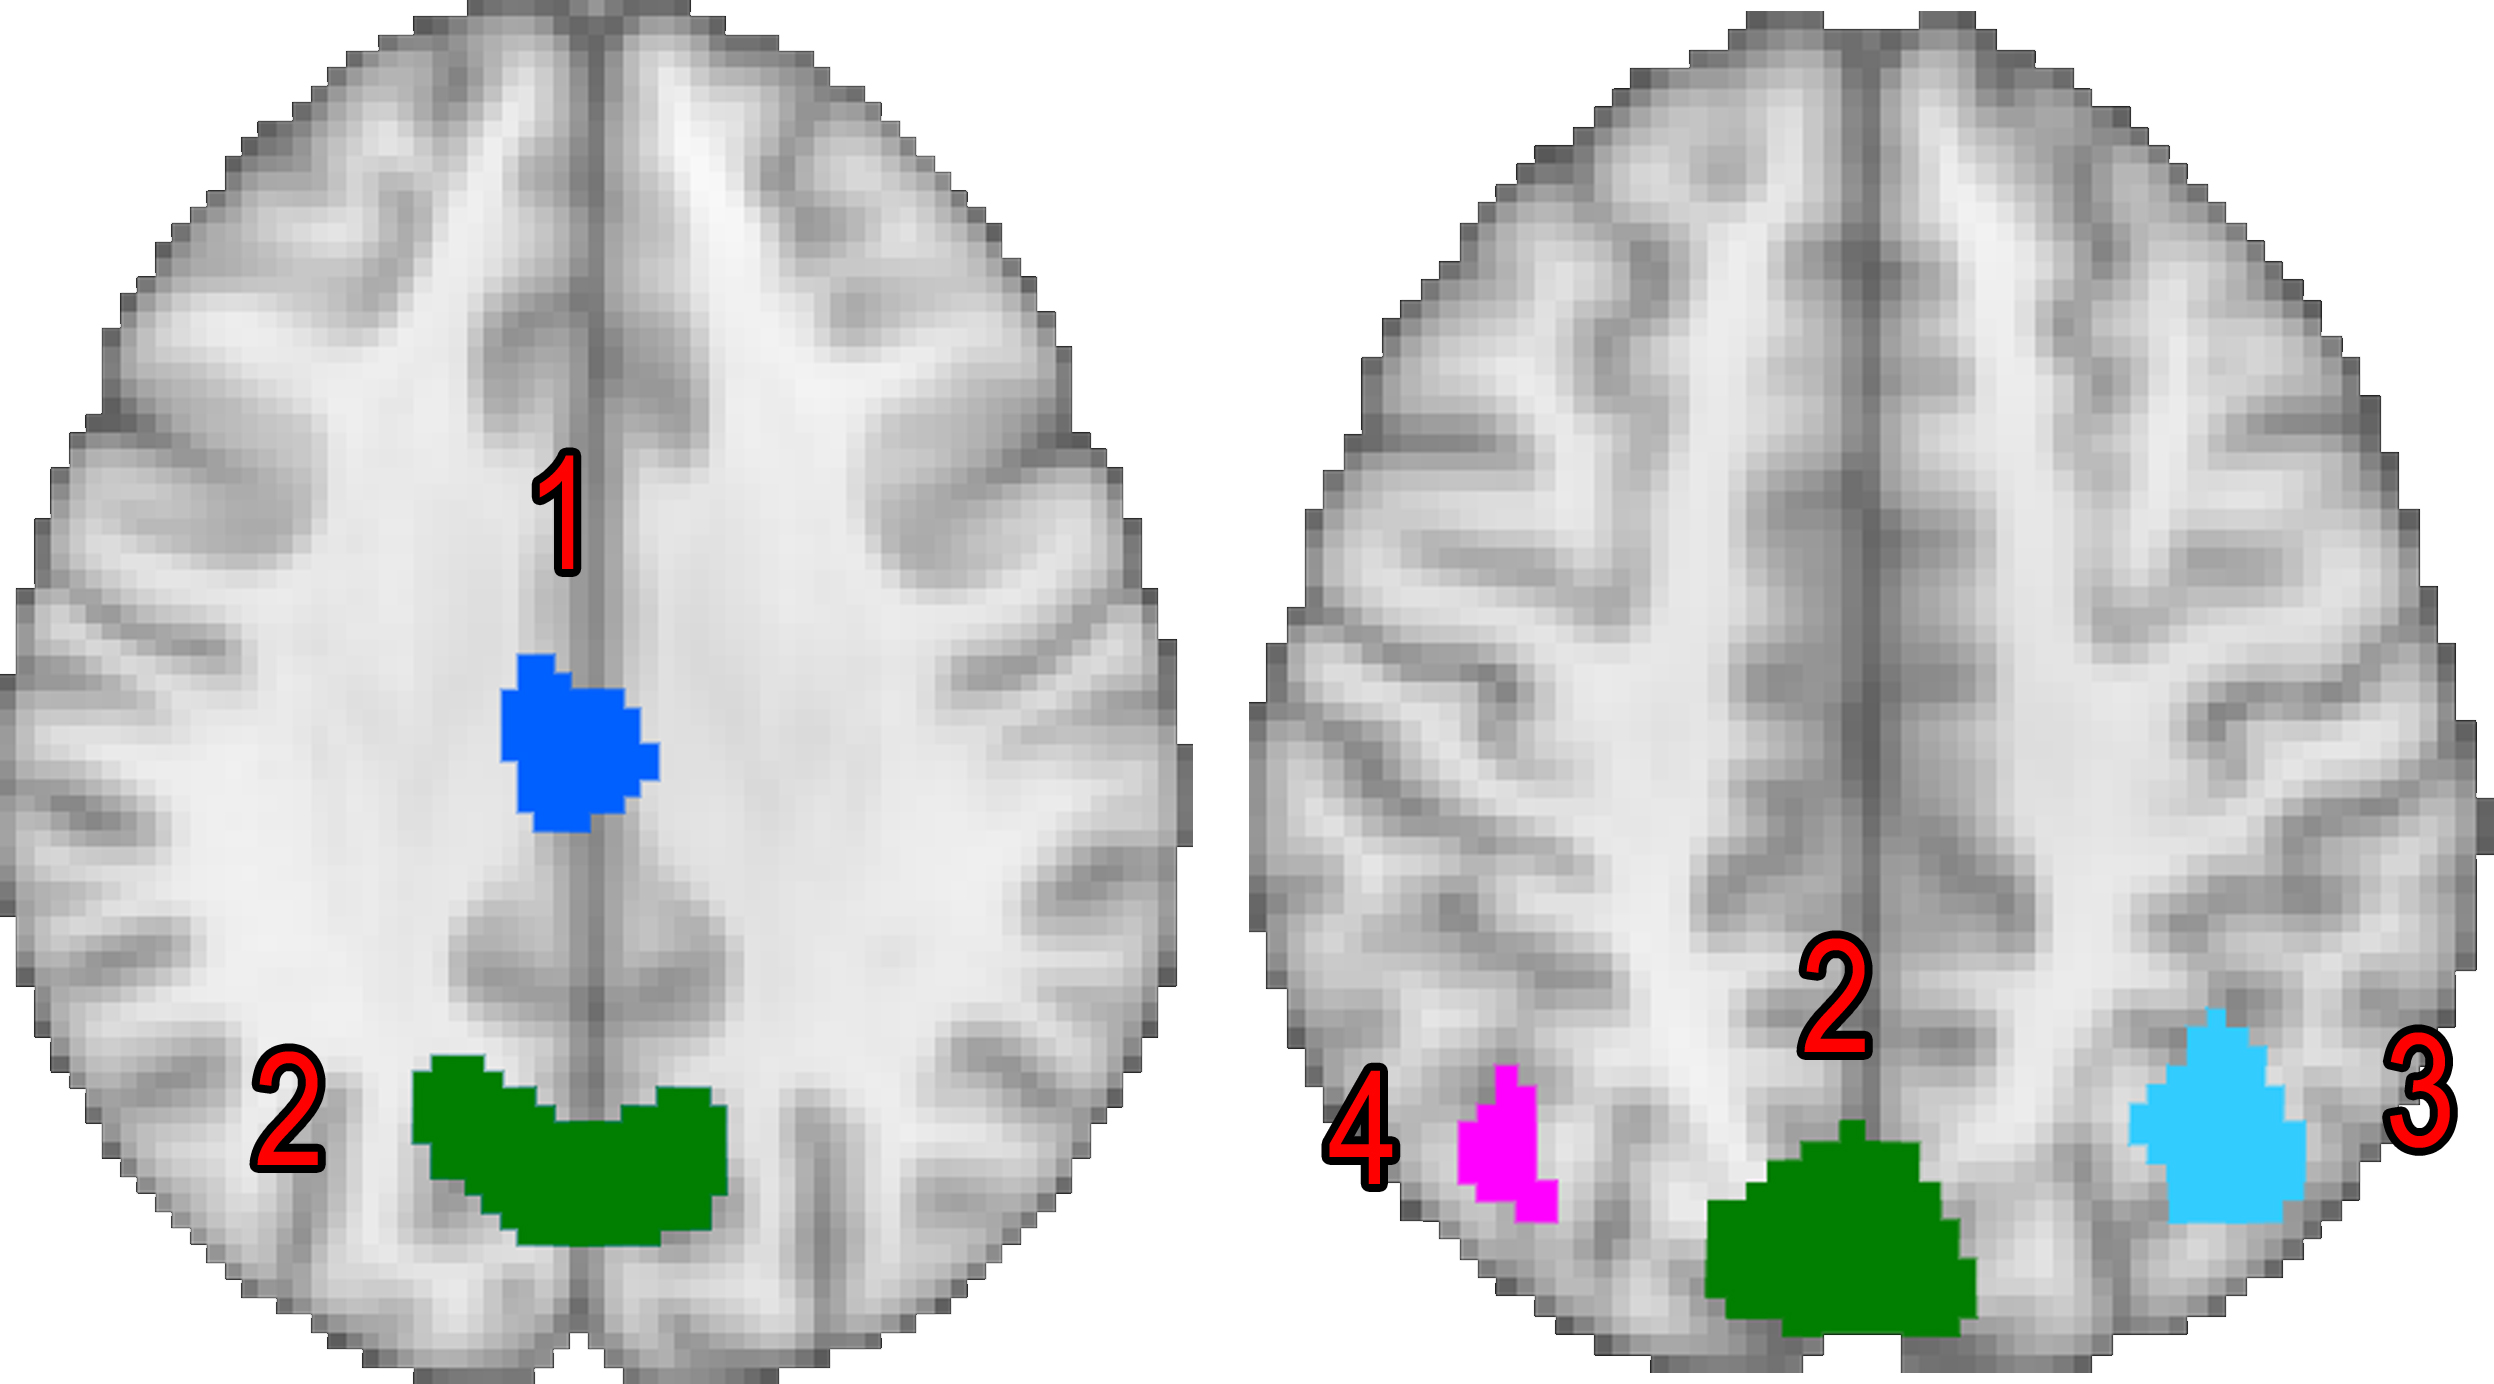
Correlation analysis shows that there is a statistically significant difference in connectivity within the precuneus network (Figure 2) before and after CEA. The individual correlations within the precuneus network showed that these changes were driven by changes in connectivity between the left angular gyrus and both the precuneus and posterior cingulate cortex(Table 1).
MOCA scores showed a significant increase (p-value=0.01) post-operatively (26.43±2.4) compared to pre-operatively (24.93±2.2) . MOCA test score changes and functional connectivity changes showed a positive correlation with a rho=0.609 and p=0.021.
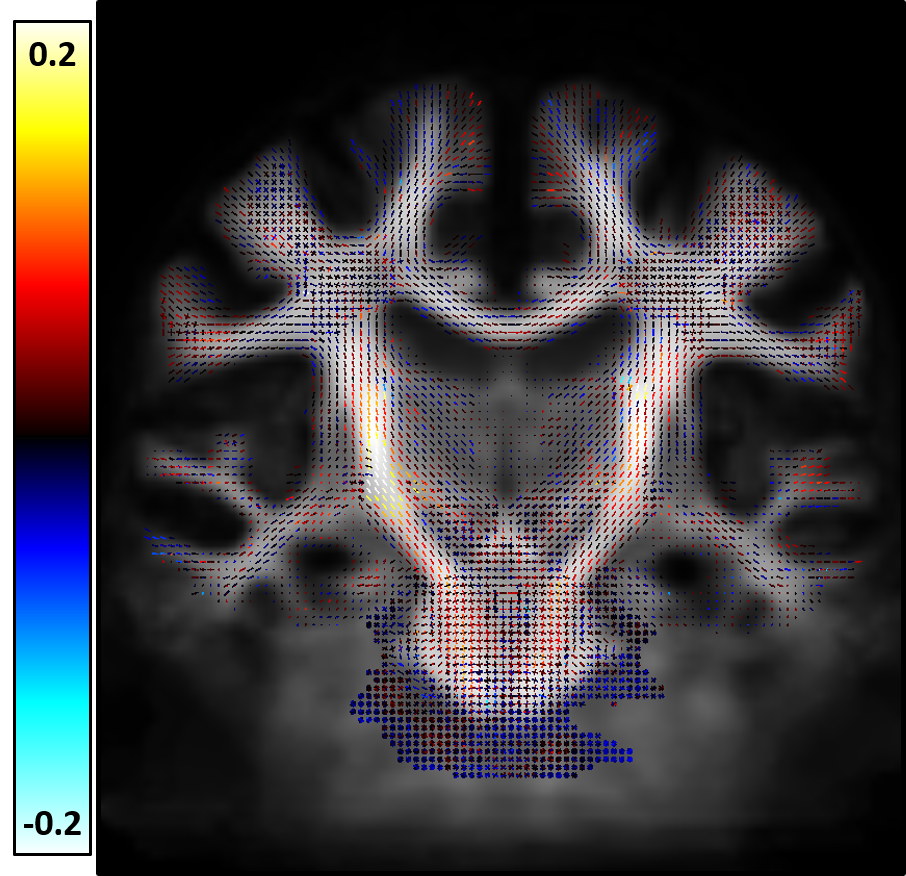
AFD analysis indicates that there are consistent increases in AFD within the corticospinal tracts (CST) (Figure 3) following CEA. The increases are larger on the right side compared to the left. Despite consistent differences, there were no statistically significant changes in AFD following family-wise error correction.
Discussion
Significant changes in functional connectivity were observed in patients who underwent CEA. The precuneus network is a sub-network of the default mode network, with the precuneus and posterior cingulate cortex being major components. The precuneus has also been linked to broader cognition functions through its connectivity to task positive networks9. These observed changes from rs-fMRI are associated with an overall improved performance on a neurocognitive assessment (MoCA).
AFD analysis suggests that there is a trend towards increasing AFD following the restoration of normal blood flow with CEA, particularly in the CST, and more so on the right than the left. Interestingly, while there were more subjects that had the procedure done on the left than the right (9 vs 5), the effect of increased AFD is more prominent on the right CST. While the number of subjects is still too small to draw definite conclusions, the pattern of increased AFD is notable.
Acknowledgements
This work was supported by the Arizona Health Sciences Center Translational Imaging Program Project Stimulus (TIPPS) FundReferences
1. Inzitari D, Eliasziw M, Gates P, Sharpe BL, Chan RKT, Meldrum HE, Barnett HJM. The Causes and Risk of Stroke in Patients with Asymptomatic Internal-Carotid-Artery Stenosis. N. Engl. J. Med. [Internet] 2000;342:1693–1701. doi: 10.1056/NEJM200006083422302.
2. Flaherty ML, Kissela B, Khoury JC, et al. Carotid artery stenosis as a cause of stroke. Neuroepidemiology [Internet] 2013;40:36–41. doi: 10.1159/000341410.
3. Andersson, J. L. R., Skare, S., Ashburner, J., 2003. How to correct susceptibility distortions in spin-echoecho-planar images: Application to diffusion tensor imaging. NeuroImage 20 (2), 870–888.
4. Jesper L. R. Andersson and Stamatios N. Sotiropoulos. An integrated approach to correction for off-resonance effects and subject movement in diffusion MR imaging. NeuroImage, 125:1063-1078, 2016.
5. Manj ́on, J. V., Coup ́e, P., Concha, L., Buades, A., Collins, D. L., Robles, M., 2013. Diffusion Weighted Image Denoising Using Overcomplete Local PCA. PLoS ONE 8 (9)
6. Tustison, N. J., Avants, B. B., Cook, P. A., Zheng, Y., Egan, A., Yushkevich, P. A., Gee, J. C., 2010.N4ITK: Improved N3 bias correction. IEEE Transactions on Medical Imaging 29 (6), 1310–1320.
7. Shirer WR, Ryali S, Rykhlevskaia E, Menon V, Greicius MD. Decoding Subject-Driven Cognitive States with Whole-Brain Connectivity Patterns. Cereb. Cortex [Internet] 2012;22:158–165. doi: 10.1093/cercor/bhr099.
8. Raffelt D, Tournier J-D, Rose S, Ridgway G, Henderson R, Crozier S, Salvado O, Connelly A. Apparent Fibre Density: A novel measure for the analysis of diffusion-weighted magnetic resonance images. NeuroImage 2012 vol: 59 (4) pp: 3976-3994.
9. Utevsky A V, Smith D V, Huettel SA. Precuneus is a functional core of the default-mode network. J. Neurosci. [Internet] 2014;34:932–40. doi: 10.1523/JNEUROSCI.4227-13.2014.
Figures