2648
High resolution diffusion magnetic resonance imaging based atlas of the C57BL/6J adult mouse brain: a tool for examining mouse brain structures1Department of Radiology, New York University School of Medicine, New York, NY, United States, 2Skirball Institute of Biomolecular Medicine, New York, NY, United States, 3Bernard & Irene Schwartz Center for Biomedical Imaging, New York, NY, United States, 4Preclinical Imaging Center, New york, NY, United States
Synopsis
Mouse models have been widely used in the neuroscience research to evaluate brain development, micro-structural and functional phenotypes in response to gene mutations and neurological diseases which require a baseline for comparison, such as an atlas. Where existing atlases vary in contrast mechanisms, number of structures and resolution, very few reports detailed neuroanatomical parcellations based on diffusion magnetic resonance imaging. This study was therefore aimed to develop high resolution diffusion MR-based mouse brain atlas database with thorough labels for cortical and subcortical structures compatible with the Allen Mouse Brain Atlas (AMBA) which will be freely available to the research community.
Introduction
As MRI has been increasingly used to study the structures and functions of the mouse brain, MRI-based mouse brain atlases have been developed to meet the need to analyze a large amount of mouse brain MRI data efficiently for characterizing the phenotypes and pathology (1-7). Ideally, the MRI-based atlases can serve as a common frame of reference to analyze data from multiple strains/models at different developmental stages to better understand the brain (8-10). Previous atlases were mostly based on conventional T1/T2-weighted MRI and often lack detailed anatomical parcellation as in histology-based atlases, e.g., the Allen mouse brain atlas (AMBA).
In this study, we constructed a group average mouse brain atlas based on post-mortem high-resolution diffusion tensor images of the adult C57BL/6 mouse brain (n=10). Diffusion tensor imaging provides rich tissue contrasts related to tissue microstructural organization. We constructed one-to-one mapping between our MRI-based atlas and the AMBA reference atlas and used the mapping to import the detailed AMBA structural labels. The rich tissue contrasts in diffusion tensor images allow accurate mapping of mouse brain images to the atlas, and the detailed structural labels permit multi-level analysis of structural volumes as well as studies of structural connectivity based on diffusion MRI data.
Methods
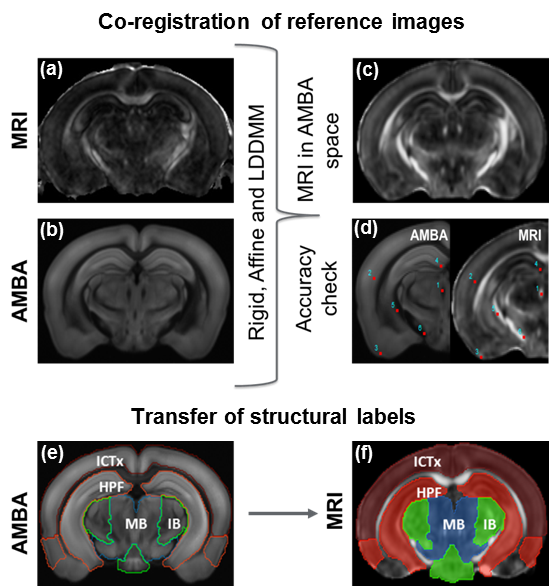
MRI data: Diffusion tensor images of ex-vivo adult mouse brains (60 days after birth, P60, n=10) were acquired using an 11.7T MRI system, and a group averaged mouse brain template was generated as in Fig. 1. The spatial resolution of the MRI data was 0.125 mm isotropic and interpolated to 0.0625 mm isotropic by zero-padding in the k-space. This nominal resolution is slightly higher than the 0.07 mm isotropic resolution of the AMBA reference atlas. High-resolution diffusion tensor images of another group of mouse brain (C57BL/6, P21, n=7) were collected using a 7T MRI system to evaluate the performance of atlas-based analysis.
Transfer of structural labels: Co-registration of diffusion tensor images to the AMBA reference atlas was initially performed using landmark-based rigid transformation followed by intensity-based affine transformation (Fig. 1). Segmentation of major brain structures (e.g., cortex, hippocampus, and cerebellum) were first imported from AMBA and manually corrected. We then used the binary maps of major brain structures to derive the final mapping between the AMBA reference atlas and MRI data using LDDMM. The level of registration accuracy was measured using manually placed landmarks in the AMBA and MR image. Detailed AMBA structural labels were then transferred to the MRI-based atlas (Fig. 2).
Atlas based analysis: Images from the P21 mouse brains were mapped to the atlas using LDDMM. The structural labels embedded in the atlas were transferred to individual subject data to measure structural volumes.
Results and Discussion
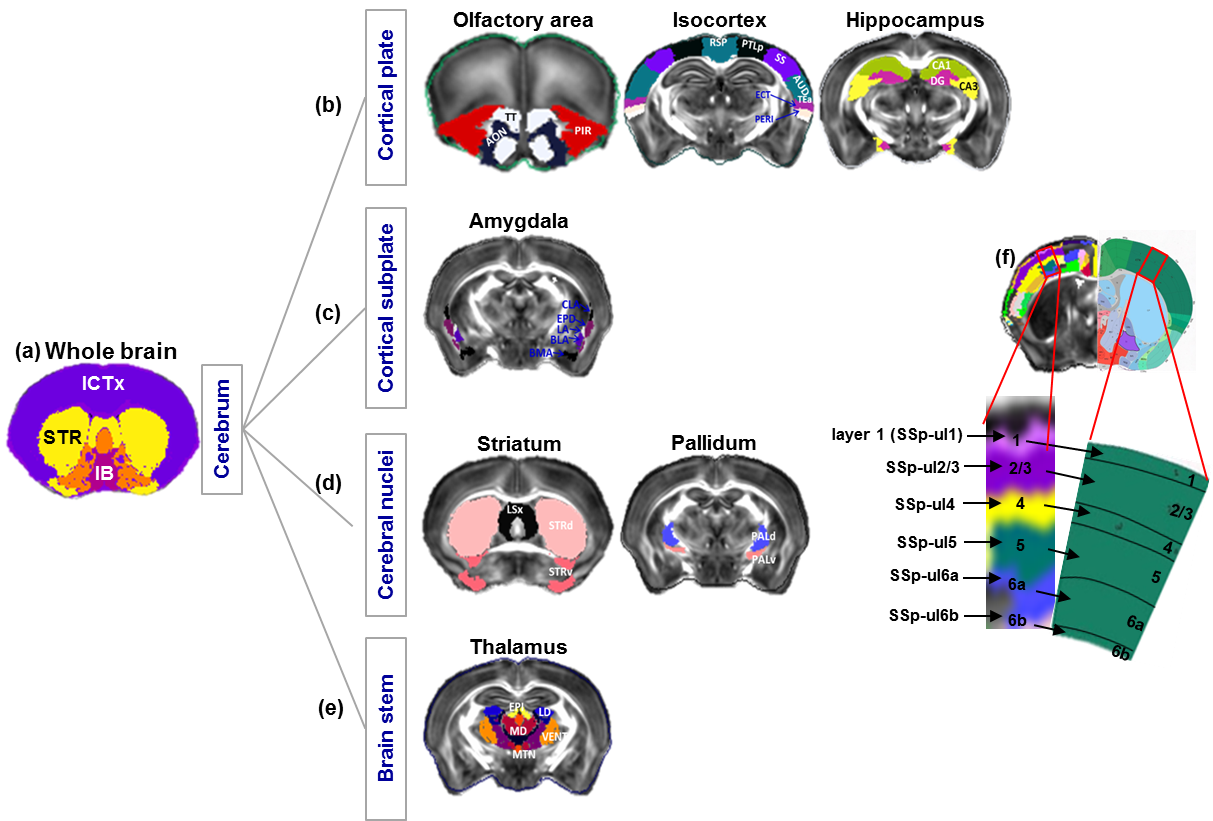
Following the structural hierarchy defined in the AMBA, our MRI-based atlas includes the following structural labels at several levels. At the whole brain level, there are 14 major gray matter (GM) structures (Fig. 2a). At the intermediate level, the structural labels include individual cortical regions and hippocampal subfields (Fig. 2b), amygdala and thalamic nuclei (Fig. 2c & 2e), and so on. Most of these structures can be readily delineated at the spatial resolution of MRI. We further imported 239 cortical layer labels into our MRI-based atlas (Fig. 2f).
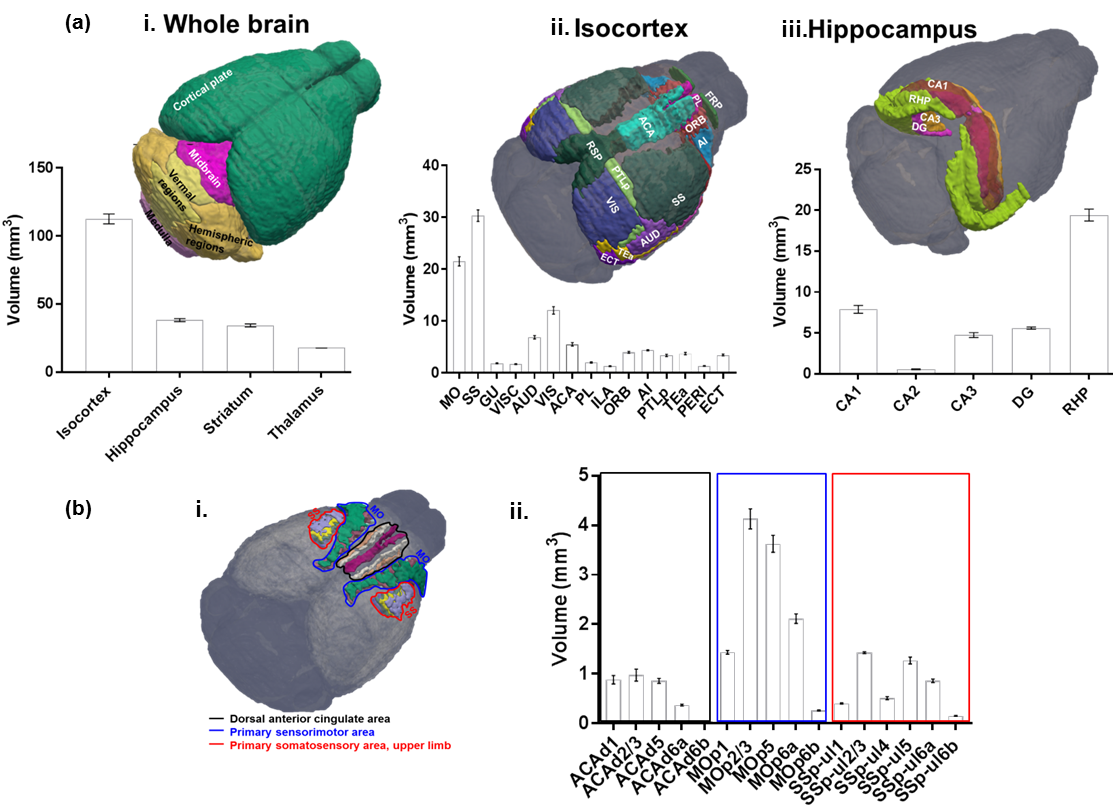
Using the atlas, semi-automated segmentation of a separate group of ex-vivo mouse brain images was performed. Based on the results, we calculated the average volumes of major brain structures, cortical regions, hippocampal subfields, down to cortical layers. This mandates efficacious application of this atlas for volumetric analyses to examine phenotypes underlying cellular changes such as atrophy, hyperplasia, and developmental defects. Furthermore, our atlas will not only be instrumental in detecting structural amendments in major brain regions, but also assist future studies that seek a detailed molecular and functional taxonomy of cortical layers and neuronal cell types.
Conclusion
Our proposed atlas and database can be used to locate anatomical structures and investigate macroscopic structural connectivity in the mouse brain with high throughput. This atlas will further serve as a requisite template for cross-examination of potential disrupted connections/volumetric changes in genetically modified mouse strains.Acknowledgements
NIH R01 NS 102904References
1. Chuang N, Mori S, Yamamoto A, Jiang H, Ye X, Xu X, Richards LJ, Nathans J, Miller MI, Toga AW, Sidman RL, Zhang J. An MRI-based atlas and database of the developing mouse brain. Neuroimage. 2011;54(1):80-9. doi: 10.1016/j.neuroimage.2010.07.043. PubMed PMID: 20656042; PMCID: 2962762.
2. Dorr AE, Lerch JP, Spring S, Kabani N, Henkelman RM. High resolution three-dimensional brain atlas using an average magnetic resonance image of 40 adult C57Bl/6J mice. Neuroimage. 2008;42(1):60-9. doi: 10.1016/j.neuroimage.2008.03.037. PubMed PMID: 18502665.
3. Ma Y, Hof PR, Grant SC, Blackband SJ, Bennett R, Slatest L, McGuigan MD, Benveniste H. A three-dimensional digital atlas database of the adult C57BL/6J mouse brain by magnetic resonance microscopy. Neuroscience. 2005;135(4):1203-15. doi: 10.1016/j.neuroscience.2005.07.014. PubMed PMID: 16165303.
4. MacKenzie-Graham A, Jones ES, Shattuck DW, Dinov ID, Bota M, Toga AW. The informatics of a C57BL/6J mouse brain atlas. Neuroinformatics. 2003;1(4):397-410. Epub 2004/03/27. doi: NI:1:4:397 [pii] 10.1385/NI:1:4:397. PubMed PMID: 15043223.
5. MacKenzie-Graham A, Lee EF, Dinov ID, Bota M, Shattuck DW, Ruffins S, Yuan H, Konstantinidis F, Pitiot A, Ding Y, Hu G, Jacobs RE, Toga AW. A multimodal, multidimensional atlas of the C57BL/6J mouse brain. J Anat. 2004;204(2):93-102. Epub 2004/03/23. doi: 10.1111/j.1469-7580.2004.00264.x. PubMed PMID: 15032916; PMCID: PMC1571243.
6. Badea A, Gewalt S, Avants BB, Cook JJ, Johnson GA. Quantitative mouse brain phenotyping based on single and multispectral MR protocols. Neuroimage. 2012;63(3):1633-45. doi: 10.1016/j.neuroimage.2012.07.021. PubMed PMID: 22836174; PMCID: PMC3604698.
7. Sharief AA, Badea A, Dale AM, Johnson GA. Automated segmentation of the actively stained mouse brain using multi-spectral MR microscopy. Neuroimage. 2008;39(1):136-45. doi: 10.1016/j.neuroimage.2007.08.028. PubMed PMID: 17933556; PMCID: PMC2139901.
8. Hawrylycz M, Baldock RA, Burger A, Hashikawa T, Johnson GA, Martone M, Ng L, Lau C, Larson SD, Nissanov J, Puelles L, Ruffins S, Verbeek F, Zaslavsky I, Boline J. Digital atlasing and standardization in the mouse brain. PLoS Comput Biol. 2011;7(2):e1001065. doi: 10.1371/journal.pcbi.1001065. PubMed PMID: 21304938; PMCID: PMC3033370.
9. Ma Y, Smith D, Hof PR, Foerster B, Hamilton S, Blackband SJ, Yu M, Benveniste H. In Vivo 3D Digital Atlas Database of the Adult C57BL/6J Mouse Brain by Magnetic Resonance Microscopy. Front Neuroanat. 2008;2:1. doi: 10.3389/neuro.05.001.2008. PubMed PMID: 18958199; PMCID: PMC2525925.
10. Mackenzie-Graham AJ, Lee EF, Dinov ID, Yuan H, Jacobs RE, Toga AW. Multimodal, multidimensional models of mouse brain. Epilepsia. 2007;48 Suppl 4:75-81. doi: 10.1111/j.1528-1167.2007.01244.x. PubMed PMID: 17767578; PMCID: PMC3192853.
Figures