2647
An MRI-Derived Neuroanatomical Atlas of the Fischer 344 Rat Brain1Dept. of Neuroscience, McGill, Montreal, QC, Canada, 2Dept. of Biomedical Engineering, McGill, Montreal, QC, Canada, 3Centre d'Imagerie Cérébrale, McGill, Montreal, QC, Canada, 4Dept. of Psychiatry, McGill, Montreal, QC, Canada, 5Center for Translational NeuroImaging, Northeastern University, Boston, MA, United States
Synopsis
Neuroscientific research involving preclinical rodent models often requires the ability to precisely identify anatomical brain regions. This project reports the development of a high-resolution MRI atlas of the Fischer 344 adult rat. The atlas is composed of 98 manually delineated structures through 256 coronal slices. The atlas was developed using 41 adult Fischer 344 rats to generate a co-registered average brain. The template was segmented by intensity contrast in conjunction with the Paxinos and Watson paper atlas. This atlas is intended to be a resource for researchers working with Fischer 344 rats and is provided open-access in MINC2.0 and NIfTI.
Introduction
Effective neuroscientific research involving preclinical rodent models often requires the ability to precisely and accurately identify anatomical brain regions.1 Previously, this identification was done using paper atlases such as the Paxinos and Watson (P&W) Rat Brain in Stereotaxic Coordinates.2 However, with the increased prevalence of preclinical high-resolution MR imaging in the past decade, digital neuroanatomical atlases have emerged in neuroinformatic research as a tool for quick and accurate identification of anatomical regions in laboratory animals.3 Digital atlases provide flexibility over paper atlases by easily allowing interactive viewing of anatomical regions from arbitrary planes without distortion. Several digital rat brain atlases for different rat strains have been published and disseminated previously.4-6 However, since different rat strains may have subtle neuroanatomic differences, using a single rat brain atlas across multiple rat strains is likely to induce systematic errors.7 Given that the Fischer 344 rat strain is commonly used in preclinical neuroscientific research8,9,10, and given the emergence of a novel transgenic rat model of Alzheimer’s disease generated on a Fischer 344 background (TgF344-AD)11, a digital anatomical atlas of the Fischer 344 rat brain would likely be of great value to the scientific community. To the best of our knowledge this work represents the first published atlas of the Fischer 344 rat brain.Methods
Subjects and MRI acquisition: High-resolution MRI images of 41 four-month old wildtype (WT) Fischer 344 rats (24M/17F) weighing 282 ± 60g were acquired using 7-Tesla Bruker Biospec 70/30 scanner using the RARE method (TR/TE=325/10.8). Image Processing: Raw 114 µm isotropic images were intensity normalized using ANTS software algorithm N4BiasFieldCorrection.13 Next, all 41 WT images were co-registered by using Pydpiper’s co-registration algorithms to generate a non-linear average template image.14 The template was up-sampled to 60 µm due to increased fidelity of the post-processed image. Segmentation: The 60 µm isotropic co-registered average image was digitally delineated on the basis of image intensity contrast in conjunction with P&W’s stereotaxic atlas of the rat brain. Segmentation of 98 neuroanatomical regions was performed primarily coronally, but subsequent refinement of boundaries in 3 dimensions was performed in the coronal, sagittal and axial planes (Figure 5). Following segmentation, the atlas was then used to estimate the volume of all 98 atlas structures for all 41 subjects.Results
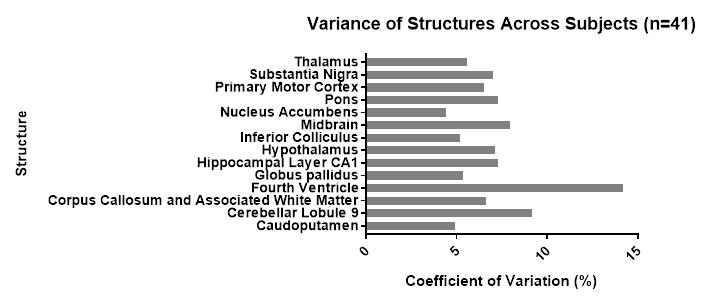
Table 1 shows the mean and standard deviation of the volumes of selected brain structures across the entire sample, across male rats only, and across female rats only. Volumetric variance of brain regions across 41 adult Fischer rats was measured to be around 5% on average, and male rats generally had larger brain volumes than female rats for most structures. Figure 2 graphically shows the coefficient of variation of anatomical volumes for selected brain structures across the whole sample—the fourth ventricle stands out has having greater variance than other brain structures. Three raw images, as well as the final template created from the co-registration of 41 adult wildtype Fischer 344 rats are shown in Figure 3. Figures 4 and 5 show the labelled atlas with each brain region shown in a different colour.
Discussion
Ever increasing amounts of data are being generated in preclinical studies of rodent models, not least being through the development of better techniques to generate MR images.15 The vast amounts of data generated in such studies substantiates the need for digital processing of neuroanatomical data. In this project, we report the development of a high-resolution Fischer 344 brain atlas which can be used in preclinical trials to quickly and precisely identify anatomical regions and their volumes. The advantages of this tool are three-fold. First, this digital atlas allows researchers to expediently process large datasets by semi-automating the process of anatomical analysis and eliminating manual paper-based anatomical analysis. Second, this atlas reduces subject-wise bias in segmentation as all experimental subjects are mapped to the same set of labels. Third, this digital atlas can be used in combination with statistical software such as RMINC in the R environment to perform group-wise regions-of-interest comparisons. Our aim was to provide a novel tool for researchers working with Fischer 344 rats and thus we will provide all files on our repository for download.
Conclusion
This project provides a novel way for researchers working with Fischer 344 rats to quantify and statistically analyse changes of structural features between genetic models, experimental treatments, age and other factors. This tool can be utilized as input to Pydpiper anatomical co-registration algorithms to quickly and precisely quantify structural volumes of Fischer 344 rat brains. On our local repository https://www.nearlab.xyz/resources/, we host these resources open source for Fischer 344 research use.Acknowledgements
This project was supported by the Canadian Institutes of Health Research and Fonds de la recherche en santé du QuébecReferences
1. Nowinski, W. L. (2016). Usefulness of brain atlases in neuroradiology: Current status and future potential. The Neuroradiology Journal, 29(4), 260–268. https://doi.org/10.1177/1971400916648338
2. Paxinos, George; Watson, Charles. (2007). The Rat Brain in Stereotaxic Coordinates. London: Academic Press.
3. Lancelot S, Roche R, Slimen A, Bouillot C, Levigoureux E, et al. (2014) A Multi-Atlas Based Method for Automated Anatomical Rat Brain MRI Segmentation and Extraction of PET Activity. PLOS ONE 9(10): e109113. https://doi.org/10.1371/journal.pone.0109113
4. Papp EA, Leergaard TB, Calabrese E, Johnson GA, & Bjaalie JG (2014) "Waxholm Space atlas of the Sprague Dawley rat brain" NeuroImage 97:374-386. [doi 10.1016/j.neuroimage.2014.04.001]
5. Calabrese E., Badea A., Watson C., & Johnson GA (2013) "A quantitative magnetic resonance histology atlas of postnatal rat brain development with regional estimates of growth and variability.", Neuroimage 71:196-206. 10.1016/j.neuroimage.2013.01.017.
6. Valdés-Hernández PA, Sumiyoshi A, Nonaka H, Haga R, Aubert-Vásquez E, Ogawa T, Iturria-Medina Y, Riera JJ, Kawashima R (2011) "An in vivo MRI template set for morphometry, tissue segmentation, and fMRI localization in rats" Front Neuroinform 5(26). [doi 10.3389/fninf.2011.00026]
7. Chen, X. J., Kovacevic, N., Lobaugh, N. J., Sled, J. G., Henkelman, R. M., & Henderson, J. T. (2006). Neuroanatomical differences between mouse strains as shown by high-resolution 3D MRI. NeuroImage, 29(1), 99-105. doi:10.1016/j.neuroimage.2005.07.008
8. Rose GS, Tocco LM, Granger GA, DiSaia PJ, Hamilton TC, Santin AD, & Hiserodt JC, (1996). Development and characterization of a clinically useful animal model of epithelial ovarian cancer in the Fischer 344 rat. American Journal of Obstetrics and Gynecology, 175(3), 593-599. doi:10.1053/ob.1996.v175.a73595
9. Burke, S. N., & Barnes, C. A. (2006). Neural plasticity in the ageing brain. Nature Reviews Neuroscience, 7(1), 30-40. doi:10.1038/nrn1809
10. Perkins, A. E., Piazza, M. K., & Deak, T. (2018). Stereological Analysis of Microglia in Aged Male and Female Fischer 344 Rats in Socially Relevant Brain Regions. Neuroscience, 377, 40-52. doi:10.1016/j.neuroscience.2018.02.028
11. Cohen, R. M., Rezai-Zadeh, K., Weitz, T. M., Rentsendorj, A., Gate, D., Spivak, I., et al. (2013). A Transgenic Alzheimer Rat with Plaques, Tau Pathology, Behavioral Impairment, Oligomeric Abeta, and Frank Neuronal Loss. J. Neurosci. 33, 6245–6256. doi: 10.1523/JNEUROSCI.3672-12.2013
12. Hennig, J. , Nauerth, A. and Friedburg, H. (1986), RARE imaging: A fast imaging method for clinical MR. Magn Reson Med, 3: 823-833. doi:10.1002/mrm.1910030602
13. Tustison, N. J., Avants, B. B., Cook, P. A., & Gee, J. C. (2010). N4ITK: Improved N3 bias correction with robust B-spline approximation. 2010 IEEE International Symposium on Biomedical Imaging: From Nano to Macro. doi:10.1109/isbi.2010.5490078
14. Friedel, M., van Eede, M. C., Pipitone, J., Chakravarty, M. M., & Lerch, J. P. (2014). Pydpiper: a flexible toolkit for constructing novel registration pipelines. Frontiers in Neuroinformatics, 8, 67. http://doi.org/10.3389/fninf.2014.00067
15. Barkhof F. (2012). Making better use of our brain MRI research data. European radiology, 22(7), 1395-6.
Figures