2643
A Time-Averaged MRI Brain Template for the Infant Rhesus Macaque1Department of Medical Physics, University of Wisconsin Madison, Madison, WI, United States, 2Waisman Center, University of Wisconsin Madison, Madison, WI, United States, 3Department of Psychiatry, University of Wisconsin Madison, Madison, WI, United States, 4Department of Medical Physics, Department of Psychiatry, Waisman Center, University of Wisconsin Madison, Madison, WI, United States
Synopsis
Anatomical templates are extremely prevalent in human brain imaging research, but comparatively rare in non-human primate MRI studies, particularly for the early-developing brain. Utilizing a custom T1-weighted imaging sequence (MPnRAGE), we have constructed a finely-sampled (0.469 mm isotropic), T1-weighted, time-averaged, population template of the infant rhesus macaque brain, generated from 35 rhesus monkeys, scanned at five different time points throughout their first year of life (including 4 scans within the first 6 months). This time-averaged template of the early-developing rhesus macaque brain provides an invaluable anatomical framework for characterizing and assessing early brain development in non-human primates.
Purpose
The construction and implementation of anatomical templates is common in human brain imaging applications as it provides researchers with the necessary tools to compare data across distinct time points and between different subjects. However, in non-human primate MRI investigations, such templates are not nearly as readily available, primarily due to studies having a relatively small number of animals. Therefore, multi-subject analysis tends to be challenging.1
Few templates exist that exclusively characterize the structural anatomy and development of the rhesus macaque brain during the first year of life. Moreover, of the structural MRI templates currently available, many are either based on a single subject (representing the particular features of an individual animal instead of a population), or lack sufficient resolution to reliably characterize known anatomical locations.1,2 Generally, the rhesus macaque brain serves as a robust model for understanding the structure and function of the human brain, due largely to its conserved evolutionary development and, as in humans, its diversification among individual subjects.3
Here, we present a finely-sampled (0.469 mm isotropic), T1-weighted, time-averaged population template of the developing macaque brain, derived from 35 infant monkeys, scanned at five time points throughout their first year of life (including 4 time points that span the first six months). The early and frequent imaging upon which this template is based, offers a unique opportunity to characterize and assess early brain development in non-human primates.
Methods
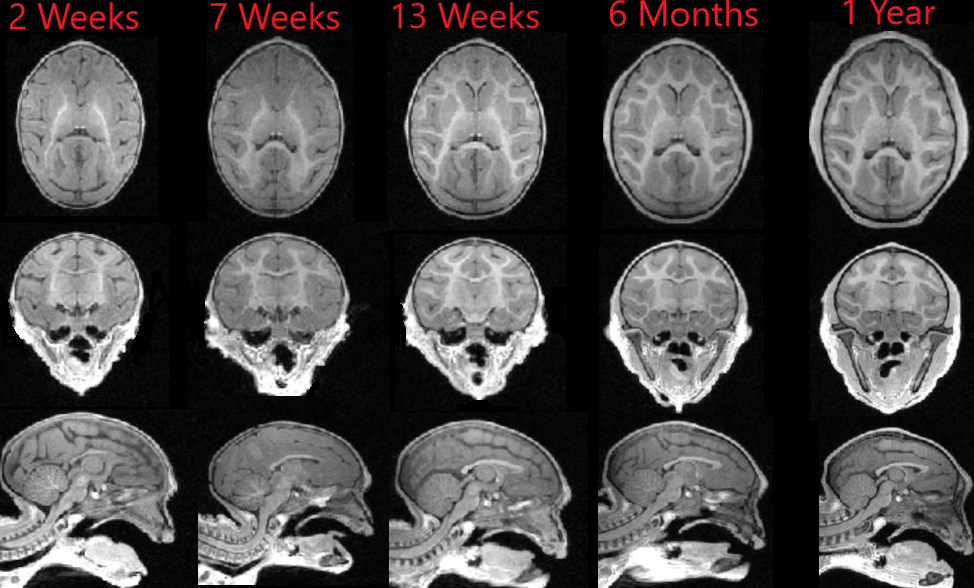
35 rhesus monkeys (Macaca mulatta) were repeatedly scanned using the T1-weighted MPnRAGE imaging sequence,4 at five ages - 2 weeks, 7 weeks, 13 weeks, 6 months, and 1 year (one monkey was only scanned at four time points, resulting in a total of 174 scans across all subjects). This sequence consists of an interleaved three‐dimensional radial k‐space trajectory, equipped with a sliding window reconstruction, in combination with magnetization preparation pulses.4
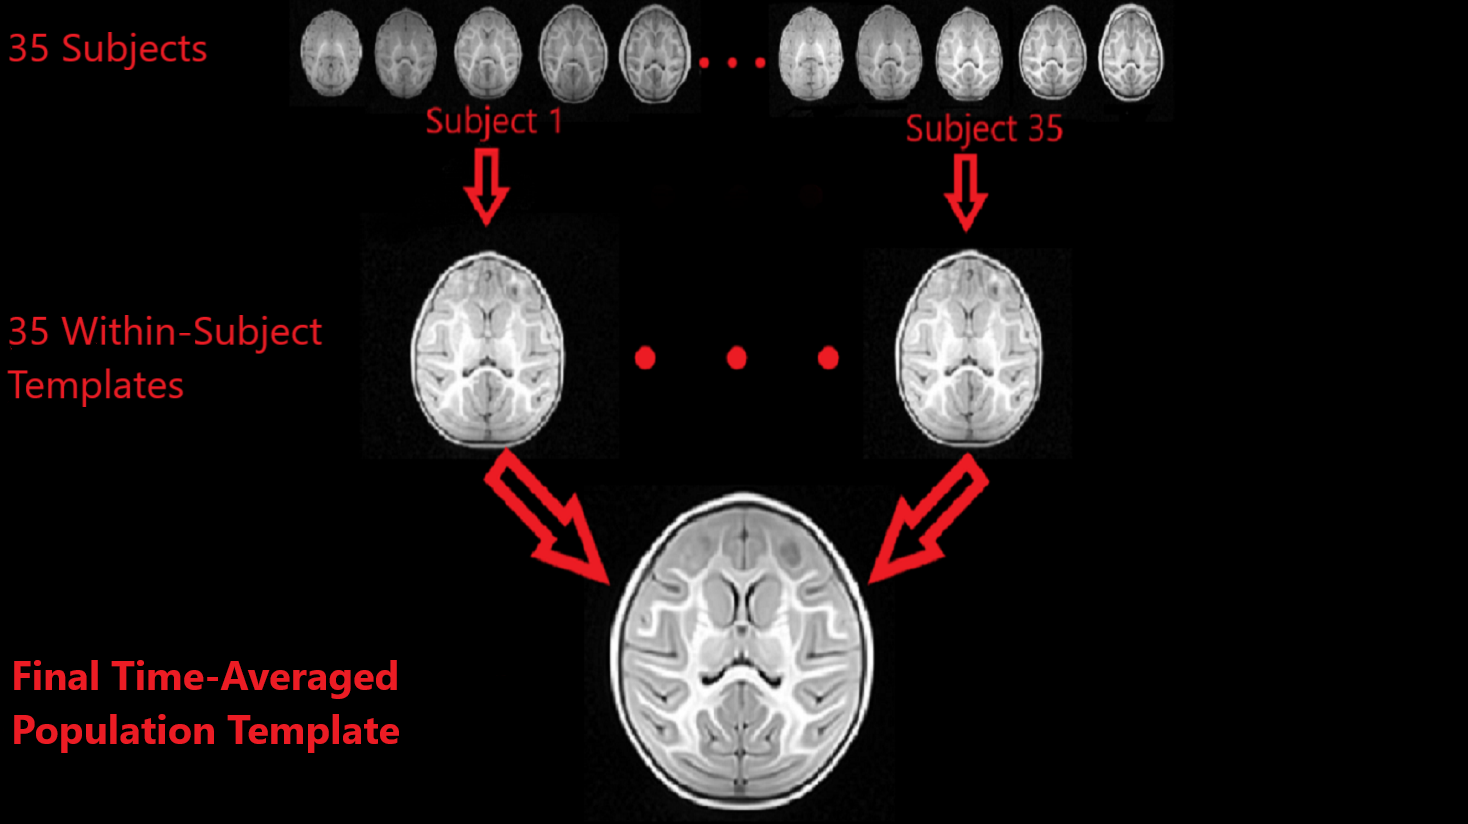
The creation of the population template utilized an Advanced Normalization Tools (ANTS) registration algorithm in two discrete steps. The first step co-registered the 5 MPnRAGE scans from each subject, for all 35 subjects, to produce 35 within-subject (across-time) templates. The second step necessitated co-registering all 35 within-subject templates to generate a final, temporally-averaged, population template. Non-linear registration was chosen, since nonlinear warping techniques have been shown to result in superior contrast and anatomical detail, when compared to simpler linear methods.5 A schematic of this approach is depicted in Figure 1.
The ANTS methodology that was implemented to calculate the within-subject templates as well as the final population template, was to first compute an average image from the given set of images and then to co-register each individual image in that set to the average image. The normalized cross-correlation between images was utilized as the registration metric of choice for optimizing image similarity between the average image and each individual image. Ultimately, this algorithm was employed for a total of 10 iterations, which is significantly more than the default (4).
With each iteration, image registration was dictated by a
measure of normalized cross-correlation.
Cross-correlation has consistently been shown to serve as an ideal method of alignment between images
acquired with the same modality at different times, because it is highly
sensitive to minute changes in intensity and the shapes of pertinent
structures.6
Results
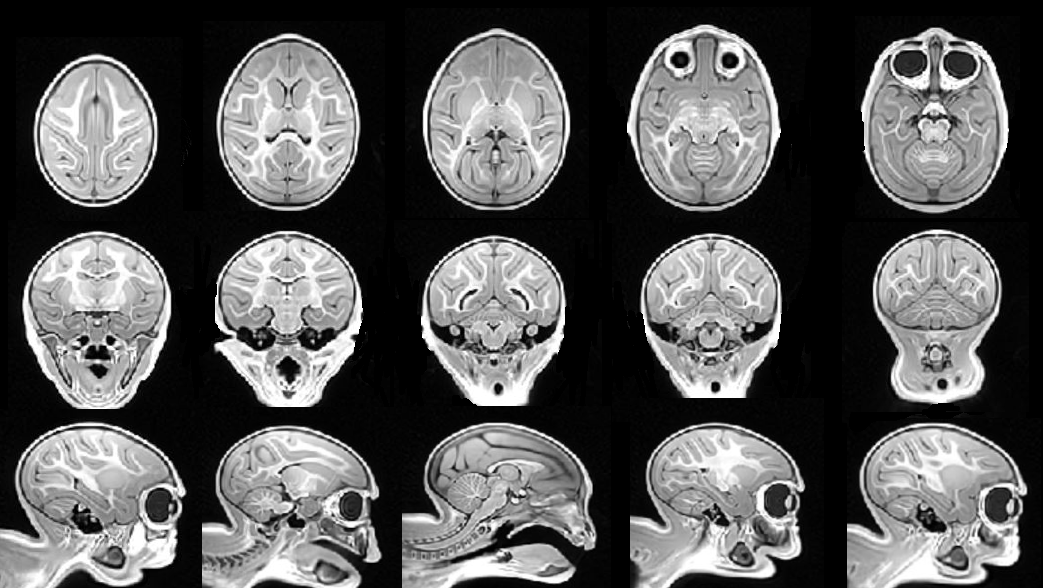
The MPnRAGE scans across the five timepoints for a single representative subject are shown in Figure 2. As expected, the contrast between gray and white matter changes over time. Orthogonal slices from the final, temporally-averaged, population template are illustrated in Figure 3. Gray and white matter features are clearly delineated.Discussion
The final population template depicted in Figure 3, derived from 10 iterations of the ANTS registration process, is endowed with superior spatial sampling and anatomical clarity. While only 4-6 iterations are typically recommended by ANTS in the template creation process, we found that using additional iterations improved the anatomical precision in peripheral areas of the brain, particularly in the rapidly developing prefrontal cortex.
The MPnRAGE imaging sequence has provided a unique combination of high contrast between gray and white matter, superb spatial resolution, and relatively high SNR. We expect this template to serve as a reliable foundation for delineating relevant cortical and subcortical structures in the developing brain as well as a valuable reference for validating cross-subject analysis of the infant rhesus macaque brain. Future work will focus on using this template to assess longitudinal developmental trajectories in brain structure and to aid in the co-registration of longitudinal functional brain imaging data (i.e. FDG-PET and fMRI) as it relates to the development of anxiety in the young non-human primate.
Acknowledgements
No acknowledgement found.References
1. Seidlitz, Jakob, et al. (2018). A population MRI brain template and analysis tools for the macaque. NeuroImage, 170, 121-131.
2. Van Essen, D.C., Lewis, J.W., Drury, H.A., Hadjikhani, N., Tootell, R.B., Bakircioglu, M., Miller. (2001). Mapping visual cortex in monkeys and humans using surface-based atlases. Vision. Res. 41 (10). 1359-1378.
3. Zhang, Y.P., Shi, L.M., (1993). Phylogeny of rhesus monkeys (Macaca mulatta) as revealed by mitochondrial DNA restriction enzyme analysis. Int. J. Primatol, 14 (4), 587–605.
4. Kecskemeti, S., Samsonov, A., Hurley, S. A., Dean, D. C., Field, A., & Alexander, A. L. (2015). MPnRAGE: A technique to simultaneously acquire hundreds of differently contrasted MPRAGE images with applications to quantitative T1 mapping. Magnetic resonance in medicine, 75(3), 1040-53.
5. Klein, A., Andersson, J., Ardekani, B. A., Ashburner, J., Avants, B., Chiang, M. C., Christensen, G. E., Collins, D. L., Gee, J., Hellier, P., Song, J. H., Jenkinson, M., Lepage, C., Rueckert, D., Thompson, P., Vercauteren, T., Woods, R. P., Mann, J. J., Parsey, R. V. (2009). Evaluation of 14 nonlinear deformation algorithms applied to human brain MRI registration. NeuroImage, 46(3), 786-802.
6. Avants, B. B., Epstein, C. L., Grossman, M., & Gee, J. C. (2007). Symmetric diffeomorphic image registration with cross-correlation: evaluating automated labeling of elderly and neurodegenerative brain. Medical image analysis, 12(1), 26-41.
Figures