2642
Volumetric analysis of selected brain regions for multi-parametric diagnostic investigation of atrophic brain diseases - Comparison of different volumetric analysis methodsSvea Seehafer1, Olav Jansen1, and Thomas Lindner1
1Department of Radiology and Neuroradiology, University Hospital Schleswig-Holstein Campus Kiel, Kiel, Germany
Synopsis
In this study three freeware tools for volumetric image post-processing were compared. The study population was subdivided by age decades. Our results show no major deviations between the selected analytical methods.
Introduction
The human brain is subject to numerous changes during its life. Physiological ageing with its attended brain involution can be distinguished from pathological brain atrophy. Neurodegenerative diseases such as M. Alzheimer, dementia or multiple sclerosis frequently go along with a reduction of brain matter. The dimension of atrophy may correlate with the severity of the disease1. Different disease patterns are associated with particular areas. Therefore, the exact differentiation of these regions is indispensable. However an appraisal and assessment based on exclusive morphometric data is only subjective and the results are dependent on the evaluator. By using Magnet Resonance Imaging (MRI) methods, it is possible to visualise brain changes in submillimetre resolution and to make quantitative statements about the atrophy extent. This is enabled by modern methods of image data post-processing that include the segmentation and semi-automatic detection of particular brain regions and thus facilitates the calculation of the brain volume and the standardisation of diagnostic findings. To avoid the interpretation of false-positive results due to physiologically reduced volume, it is necessary to develop age-related standard values to compare these with neurodegenerative processes. The goal of this study is to create a data base of healthy volunteers of different age groups and to subsequently apply it in order to compare with diseased persons. This additional information about the brain volume of particular areas should relieve the generation of differential diagnosis and the description of effects on surrounding, not directly affected, areas.Material and Methods
68 healthy volunteers were subdivided into different age groups per decade by their year of birth from 1930 to 1999. The collected data must not be falsified by other diseases such as tumours, malformations or ischemic processes. All MRI experiments were performed using a Philips 3T Achieva (Philips Healthcare, Best, the Netherlands) MRI scanner equipped with a 32-channel receiver head coil. Sequence parameters: sagittal 3D T1-TFE scan with 1mm³ isotropic voxel size, matrix size: 256x256, covering the whole brain using a flip angle of 7°. To obtain quantitative analysis in terms of brain volume values, the acquired MR images were post-processed by three different analytical programs: Brainsuite (http://brainsuite.org/ , v18a), FreeSurfer (http://surfer.nmr.mgh.harvard.edu/, v6.0.0) and SPM (https://www.fil.ion.ucl.ac.uk/spm/, SPM 12). These employed software tools for a combined volume- and region-based characterisation technique have in common the automatic labelling of inner and outer surfaces in the grey matter and subcortical structures. The results of the different methods were then compared in order to develop age-related standard values for the brain volume of particular areas, in this case using the right hippocampus (Figure 1). The resulting data was statistically analysed using the two-factor analysis of variance (ANOVA) for what the key assumptions are fulfilled.Results and Discussion
In all scans, the images could be successfully obtained and post-processed. The results after applying the ANOVA are visualized in Figure 2. As the calculated F-value of the results comparing the three different analytical programs is less than the critical F-value (also p>0.05), one can assume that there is no significant difference between the outputs of brain volume whereas significant differences between the age-related groups are obtained (p<0.05). Sources of uncertainty in this approach might be the small sample size of only five to ten volunteers per age decade and the selection of physiological images for standard values depending on the subjective evaluation of the viewing radiologist. However, the semi-automatic region based volumetric evaluation of MRI images additional to the clinical evaluation leads to supplementary reliability in the multi-parametric diagnostic investigation of atrophic brain diseases2.Conclusion
It appears that different methods of volumetric image post-processing yield comparable results for defined brain regions at people of the same age group. To measure the impact of atrophic brain diseases, this study should be repeated in cohorts of patients concerned by diseases with an influence on brain matter.Acknowledgements
We thank Florian Becker from our department for helping us with setting up the processing pipelines as well as for configuring the software tools used in this study.References
[1] Raji et al. Front Neurol. 2018 Jul 25;9:545
[2] Abrigo, et al. Acta Radiol. 2018, doi: 10.1177/0284185118795327
Figures
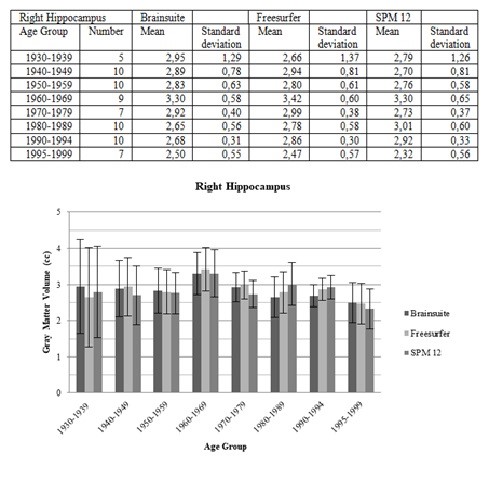
Figure 1: Post-processing results of the acquired MRI
images, exemplarily shown for the right hippocampus. For each age group (rows),
the mean and the standard deviation are calculated for the used analytical
programs (columns) and subsequently diagrammed.
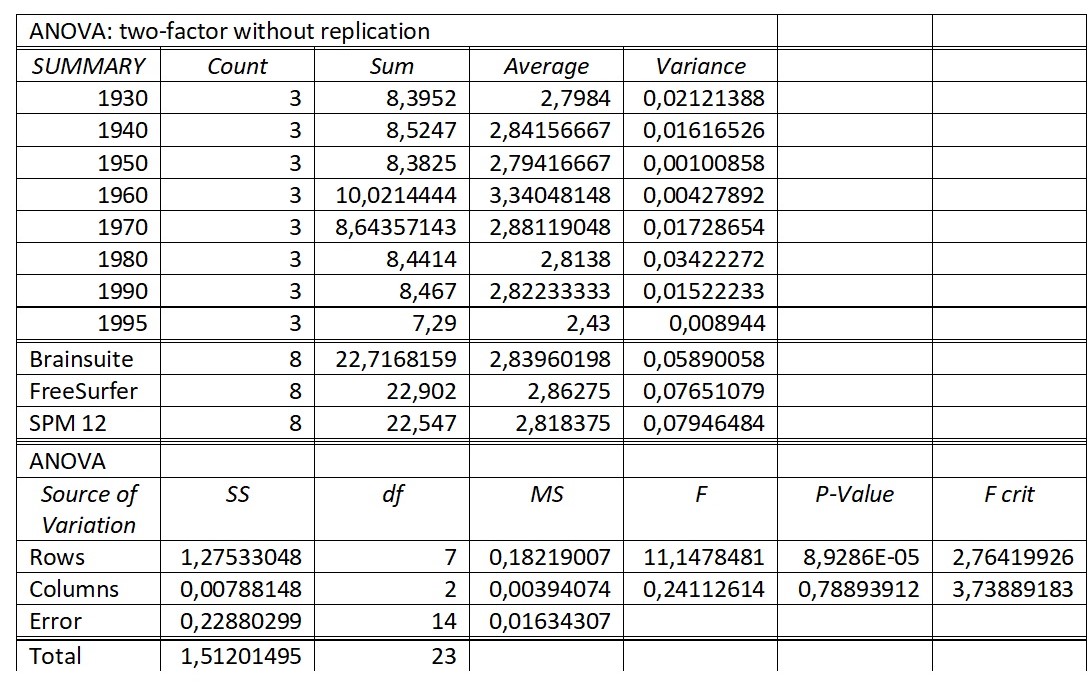
Figure 2: Total results
of two-factor ANOVA without replication for all groups.