2641
Biological brain age prediction using structural MRI: Insights from dimensionality reduction techniques1Integrated Program in Neuroscience, McGill University, Montréal, QC, Canada, 2Montréal Center for Interdisciplinary Research in Rehabilitation (CRIR), Montréal, QC, Canada, 3Graduate Program in Biological and Biomedical Engineering, McGill University, Montréal, QC, Canada, 4Department of Bioengineering, McGill University, Montréal, QC, Canada, 5School of Physical and Occupational Therapy, McGill University, Montréal, QC, Canada
Synopsis
The human brain changes with age and these age-related changes have been used as biomarkers for several brain-related disorders. Therefore, being able to accurately predict the biological age of the brain from T1-weighted MR images yields significant potential for clinical applications. The present study evaluates regression models coupled with dimensionality reduction techniques for biological brain age prediction and concludes that Canonical Correlation Analysis (CCA) enhances prediction performance of Gaussian Process Regression (GPR) models. The proposed analysis also reveals brain areas that are strongly anti-correlated with age, in agreement with previous aging studies.
Introduction
The human brain changes with age, resulting in cognitive performance decline and increasing its susceptibility to neurological disorders1–3. Changes in brain structure4,5 and function6,7 have been described in previous studies. Chronological age prediction based on brain scans generates the biological brain age, and its difference from the subject’s chronological age has proven to be a useful biomarker for characterizing neurological diseases such as Alzheimer’s disease, traumatic brain injury and schizophrenia8–17. In the present work, our main aim was to increase the reliability of existing brain age prediction models. To this end, we used dimensionality reduction techniques to improve brain age estimation performance as well as identify the brain regions that are utilized by the model for prediction.Methods
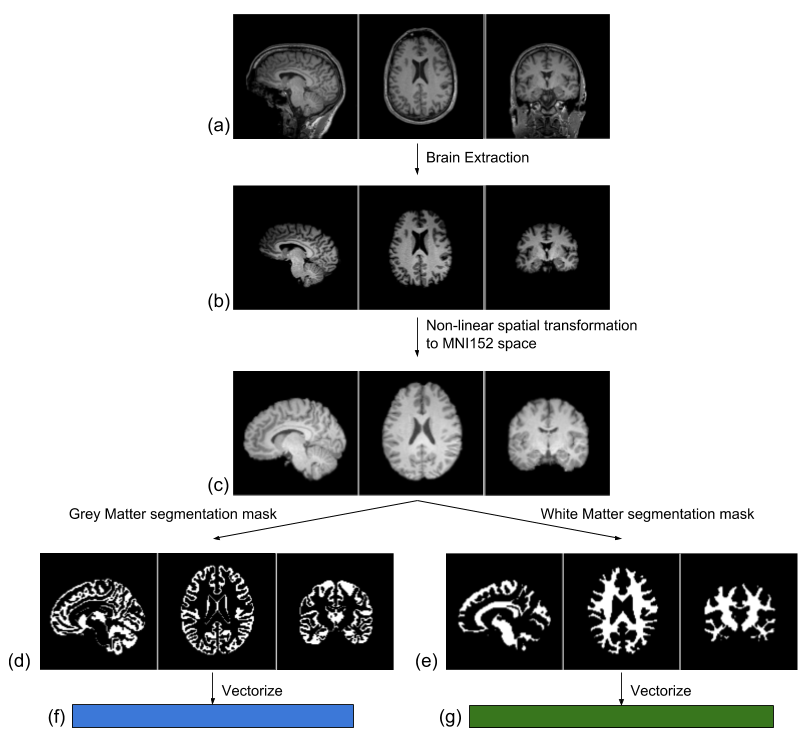
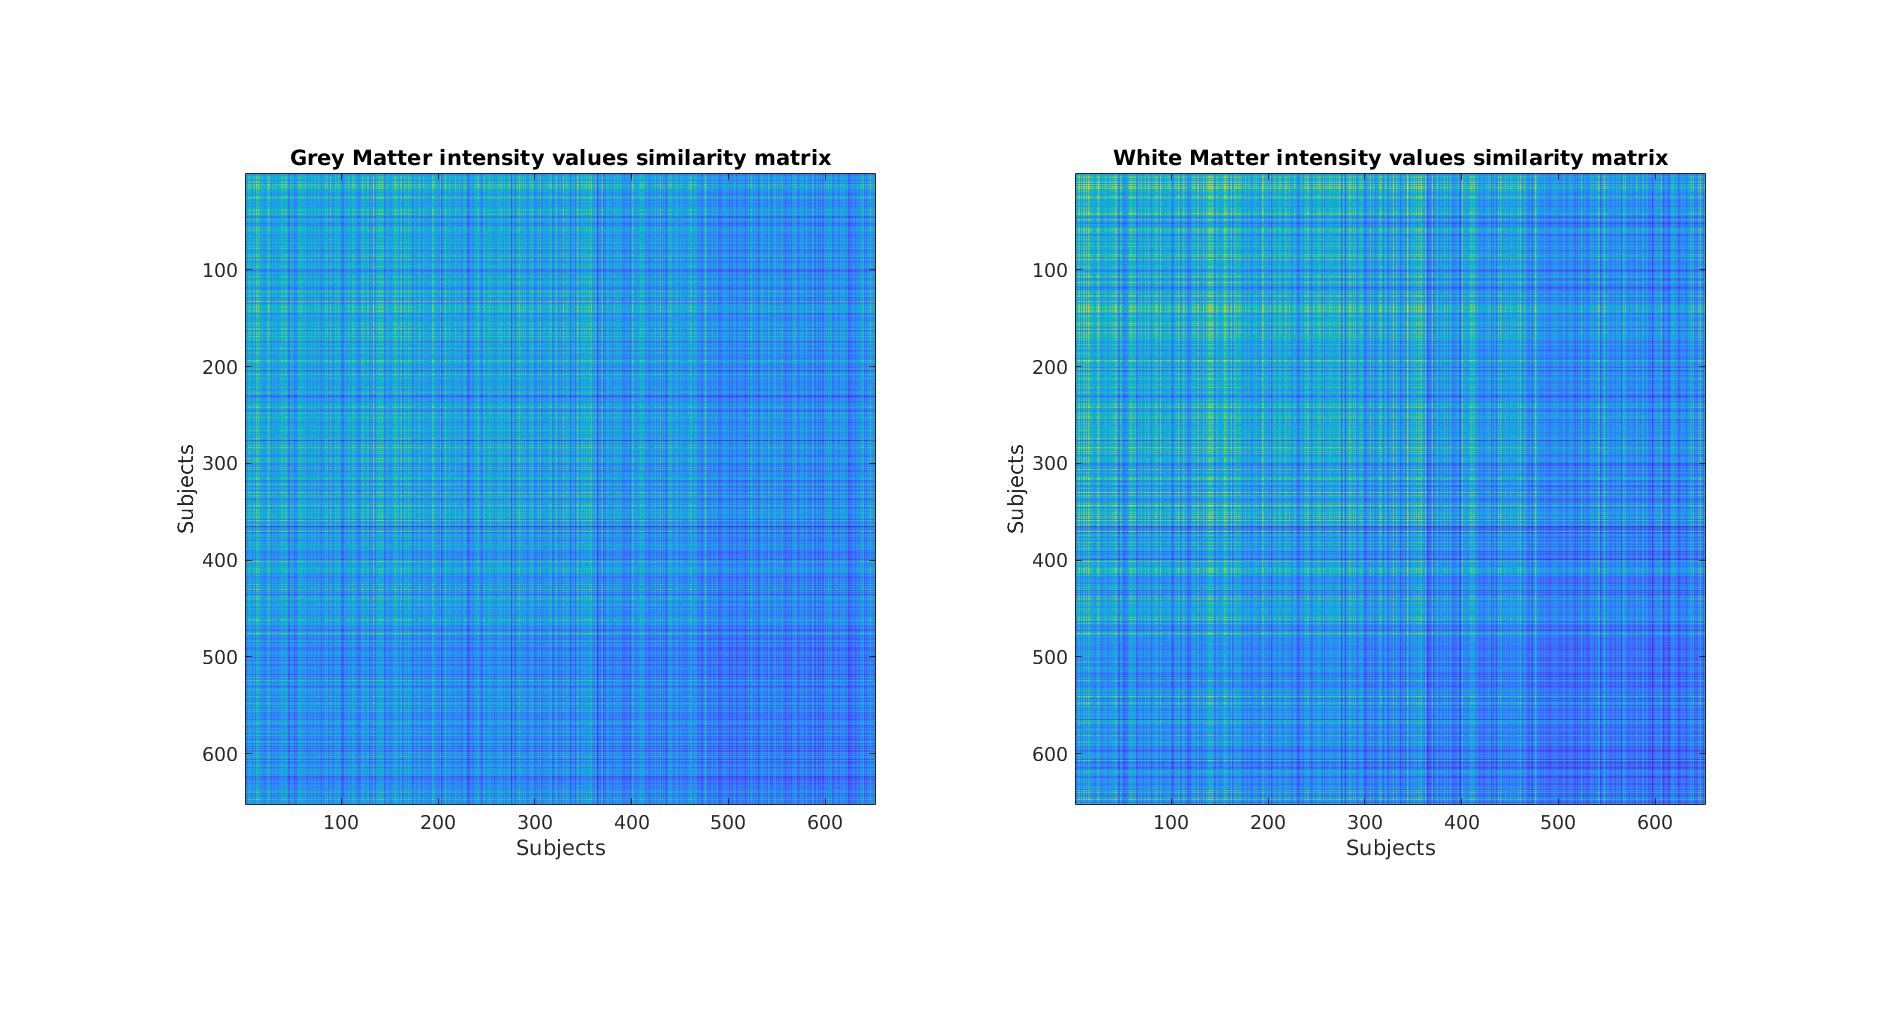
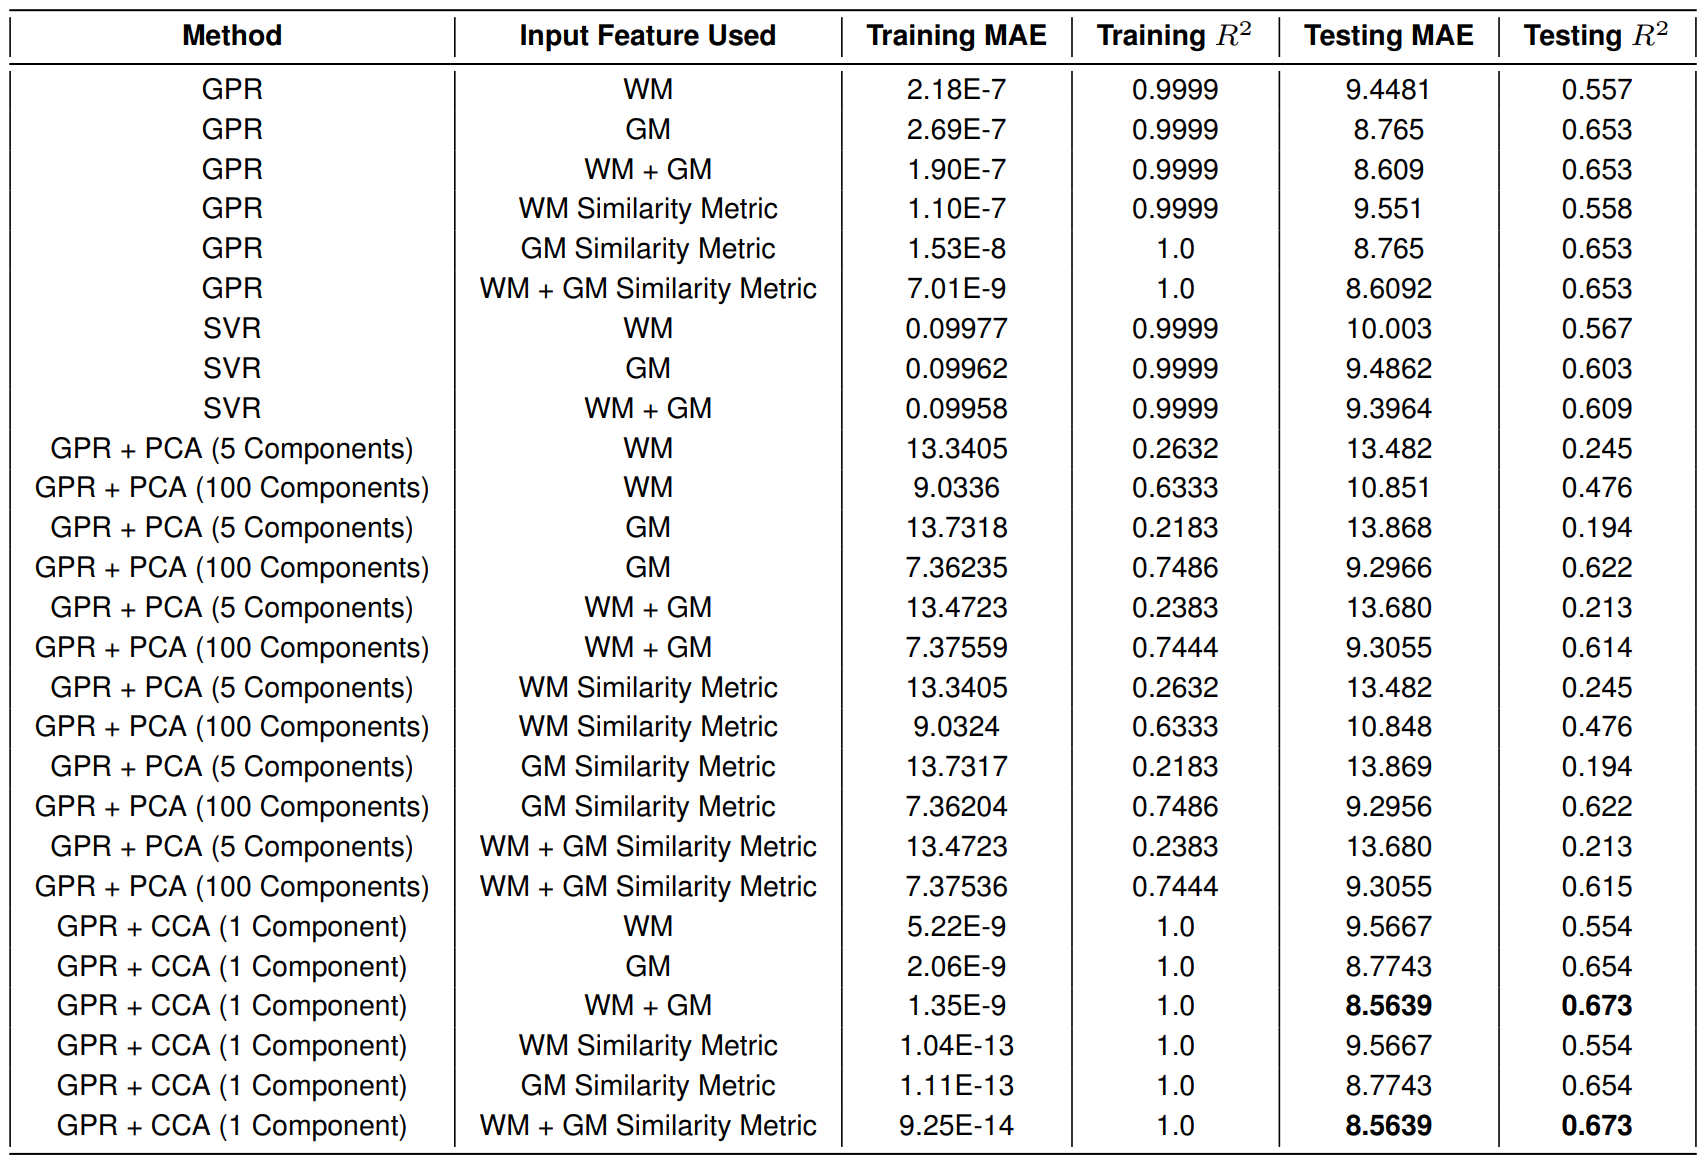
We used structural T1-weighted images from the Cam-CAN dataset18,19 consisting of 652 healthy subjects (male/female = 322/330, mean age = 54.29 ± 18.59, age range 18-88 years). For each subject, brain extraction and registration to the MNI152 space was performed using FSL20. The grey (GM) and white matter (WM) voxels were segmented and vectorized to obtain a subject-specific feature vector (see Fig. 1). Further, using a methodology described previously21, a similarity matrix approach was also investigated. Fig. 2 depicts the similarity matrix for the entire dataset which was used as input to the prediction model instead of the GM and WM feature vectors. Brain age prediction performance using Gaussian Processes Regression (GPR) models22 was compared to more commonly used Support Vector Regression (SVR)23 models in order to select the regression model for further analysis. Finally, Principal Component Analysis (PCA)24 or Canonical Correlation Analysis (CCA)25 were coupled as dimensionality reduction techniques along with the prediction model to boost performance and increase interpretability by highlighting brain regions that were more significantly affected by age. CCA yielded one canonical component and its loading values corresponding to each voxel were converted to bootstrap ratios to ascertain their reliability over the dataset26–28.Results
GPR outperformed SVR in all cases (using only WM features, only GM features, or both). Following this, GPR was chosen as the prediction model for further analysis. The use of a similarity-based metric failed to significantly boost performance. The use of PCA significantly degraded prediction performance, thus indicating that the maximally varying features in the dataset were not dependent on brain age. CCA resulted in mild improvements of prediction performance, with combined WM and GM features yielding the best performance. Detailed results are presented in Fig. 3.
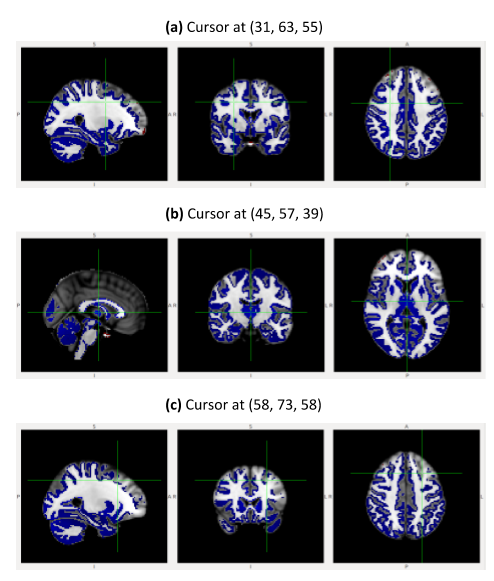
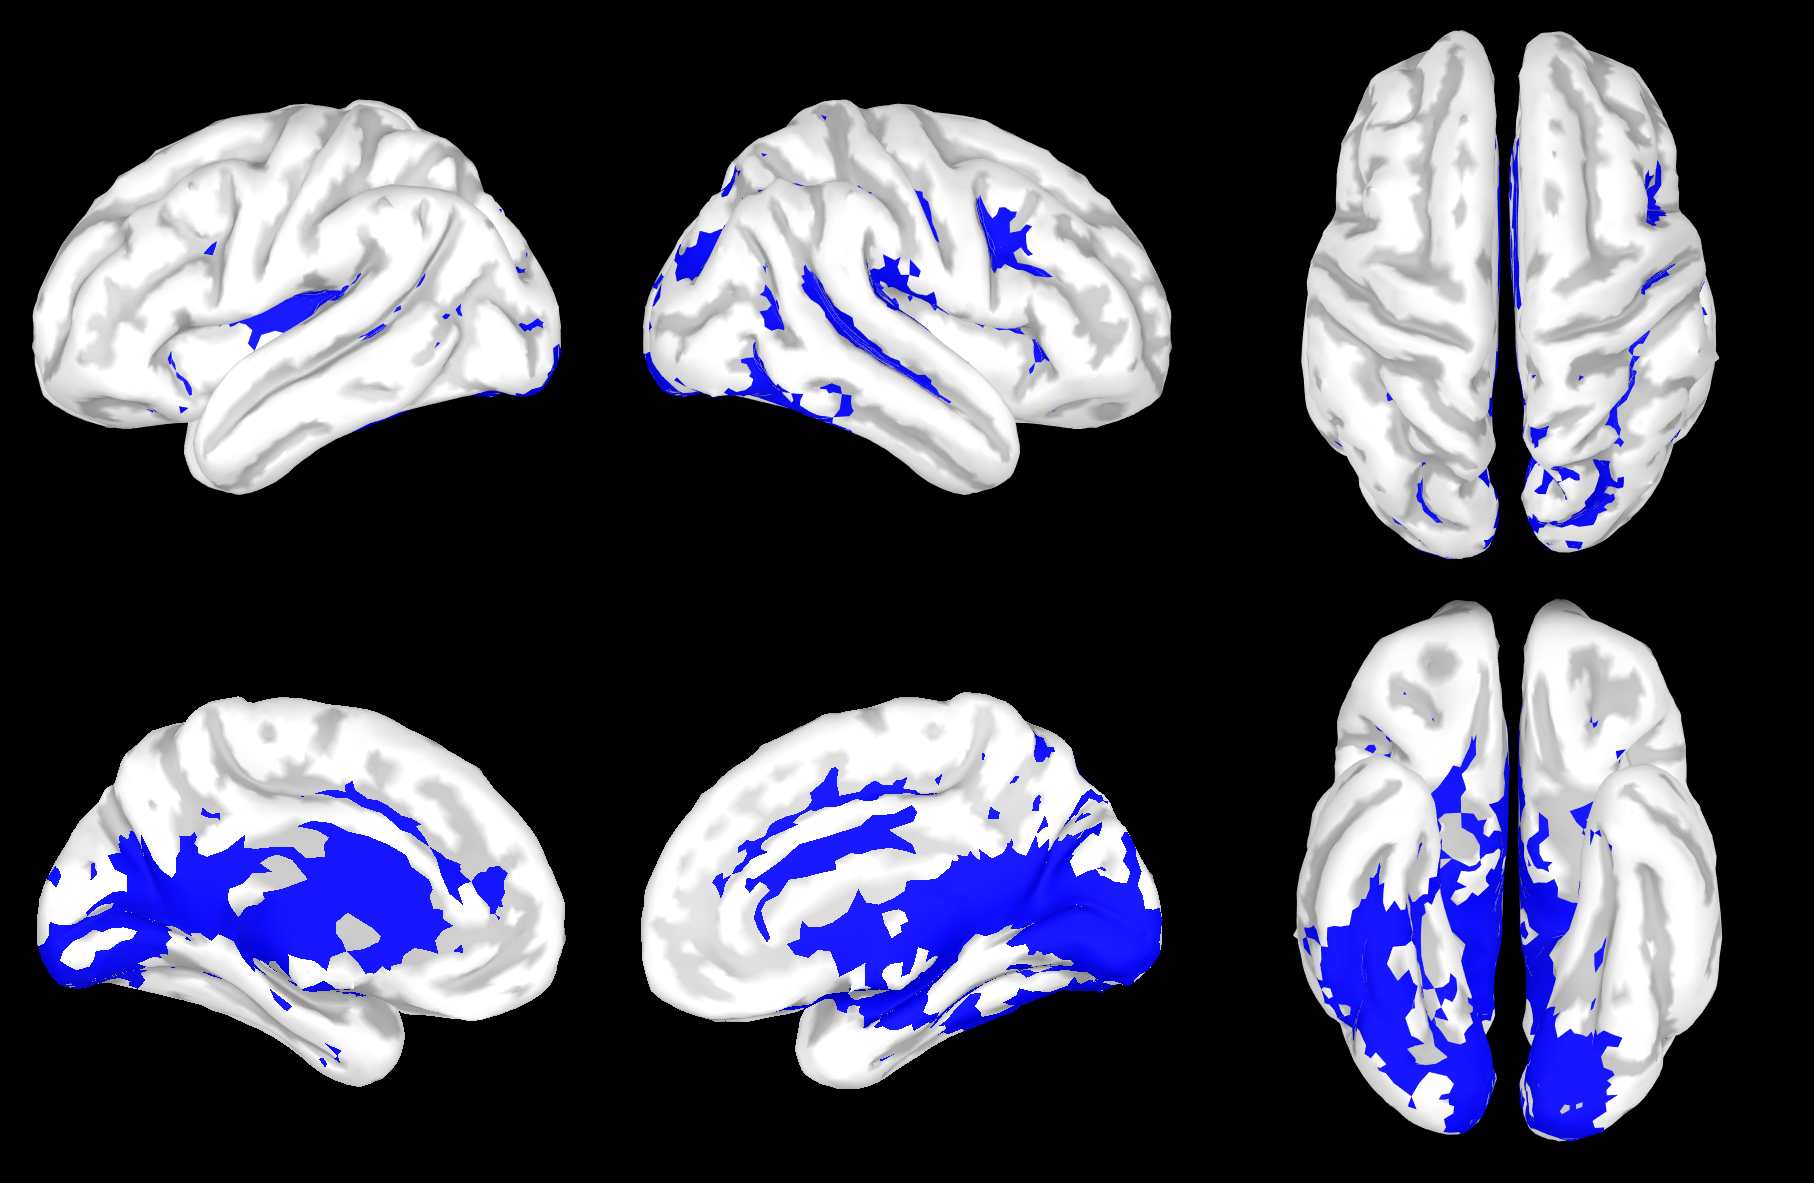
The bootstrap ratios of the loading values obtained from CCA indicated which voxels correlated strongly with the subjects’ chronological age, and therefore contributed to prediction performance. This uncovered the effect of aging on sub-cortical structures such as the cerebellum and hippocampus, along with certain cortical regions in the occipital and the right frontal lobe. Volumetric results are presented in Fig. 4 and cortical surface in Fig. 5.
Discussion
The similarity-based metric used in previous studies14,16,21 failed to significantly boost prediction performance. We posit that the lack of a clear correlation structure in the similarity matrices is the primary reason for this observation (see Fig. 2). In turn, this implies that a large variability exists in the structural features among subjects within the same age group. PCA was used to extract the major components of variability, but the results showed that it degraded the prediction performance. The failure of PCA indicated that the maximally varying WM and/or GM intensity features did not encompass age-related changes. CCA was used to detect age-related changes in the T1-weighted MRI images, and slightly boosted prediction performance. The bootstrapped ratio of the resulting CCA loading values indicated voxels that were maximally correlated to brain age. Almost all areas showed a negative correlation to age and thus confirmed the presence of atrophy throughout the brain. Specifically, this analysis revealed sub-cortical regions that are known to undergo atrophy with age29–31. It also identified significant portions of the occipital lobe and regions in the right frontal lobe and temporal lobe that were in agreement with previous results4,5,32,33.Conclusions
Dimensionality reduction techniques coupled with GPR models improved brain-age prediction using T1-weighted MR images collected in healthy individuals. Our results suggest that age-related brain changes are not necessarily the maximally varying changes in the available dataset, as suggested by results obtained using PCA. This highlights the importance of using dimensionality reduction techniques such as PCA with caution. CCA was found to improve the predictor performance and revealed brain areas whose T1-weighted image intensities were negatively correlated to brain age.Acknowledgements
Data collection and sharing for this project was provided by the Cambridge Centre for Ageing and Neuroscience (CamCAN). CamCAN funding was provided by the UK Biotechnology and Biological Sciences Research Council (grant number BB/H008217/1), together with support from the UK Medical Research Council and University of Cambridge, UK. The presented research was undertaken thanks in part to funding from the Canada First Research Excellence Fund, awarded to McGill University for the Healthy Brains for Healthy Lives initiative. AG is supported by a McGill Faculty of Medicine Scholarship. AXP received financial support from the Québec Bio-imaging Network (QBIN). MHB and GDM are supported by Fonds de la Recherche du Québec – Nature et Techonologies, the Canadian Foundation for Innovation, and the Natural Sciences and Engineering Research Council of Canada.
References
- Abbott, A. Dementia: A problem for our age. Nature 475, S2–S4 (2011).
- Raz, N. & Rodrigue, K. M. Differential aging of the brain: Patterns, cognitive correlates and modifiers. Neurosci. Biobehav. Rev. 30, 730–748 (2006).
- Ziegler, G. et al. Brain structural trajectories over the adult lifespan. Hum. Brain Mapp. 33, 2377–2389 (2012).
- Hogstrom, L. J., Westlye, L. T., Walhovd, K. B. & Fjell, A. M. The structure of the cerebral cortex across adult life: Age-related patterns of surface area, thickness, and gyrification. Cereb. Cortex 23, 2521–2530 (2013).
- Storsve, A. B. et al. Differential Longitudinal Changes in Cortical Thickness, Surface Area and Volume across the Adult Life Span: Regions of Accelerating and Decelerating Change. J. Neurosci. 34, 8488–8498 (2014).
- Damoiseaux, J. S. et al. Reduced resting-state brain activity in the ‘default network’ in normal aging. Cereb. Cortex 18, 1856–1864 (2008).
- Dennis, E. L. & Thompson, P. M. Functional Brain Connectivity Using fMRI in Aging and Alzheimer ’ s Disease. Neuropsychol Rev 49–62 (2014). doi:10.1007/s11065-014-9249-6
- Cole, J. H., Marioni, R. E., Harris, S. E. & Deary, I. J. Brain age and other bodily ‘ages’: implications for neuropsychiatry. Mol. Psychiatry 1–16 (2018). doi:10.1038/s41380-018-0098-1
- Franke, K. & Gaser, C. Longitudinal Changes in Individual BrainAGE in Healthy Aging, Mild Cognitive Impairment, and Alzheimer’s Disease. GeroPsych (Bern). 25, 235–245 (2012).
- Gaser, C., Franke, K., Klöppel, S., Koutsouleris, N. & Sauer, H. BrainAGE in Mild Cognitive Impaired Patients: Predicting the Conversion to Alzheimer’s Disease. PLoS One 8, (2013).
- Cole, J. H., Leech, R. & Sharp, D. J. Prediction of brain age suggests accelerated atrophy after traumatic brain injury. Ann. Neurol. 77, 571–581 (2015).
- Koutsouleris, N. et al. Accelerated brain aging in schizophrenia and beyond: A neuroanatomical marker of psychiatric disorders. Schizophr. Bull. 40, 1140–1153 (2014).
- Schnack, H. G. et al. Accelerated brain aging in schizophrenia: A longitudinal pattern recognition study. Am. J. Psychiatry 173, 607–616 (2016).
- Cole, J. H. et al. Increased brain-predicted aging in treated HIV disease. Neurology 88, 1349–1357 (2017).
- Pardoe, H. R., Cole, J. H., Blackmon, K., Thesen, T. & Kuzniecky, R. Structural brain changes in medically refractory focal epilepsy resemble premature brain aging. Epilepsy Res. 133, 28–32 (2017).
- Cole, J. H. et al. Brain-predicted age in Down syndrome is associated with beta amyloid deposition and cognitive decline. Neurobiol. Aging 56, 41–49 (2017).
- Franke, K., Gaser, C., Manor, B. & Novak, V. Advanced BrainAGE in older adults with type 2 diabetes mellitus. Front. Aging Neurosci. 5, 1–9 (2013).
- Shafto, M. A. et al. The Cambridge Centre for Ageing and Neuroscience (Cam-CAN) study protocol: A cross-sectional, lifespan, multidisciplinary examination of healthy cognitive ageing. BMC Neurol. 14, 1–25 (2014).
- Taylor, J. R. et al. The Cambridge Centre for Ageing and Neuroscience (Cam-CAN) data repository: Structural and functional MRI, MEG, and cognitive data from a cross-sectional adult lifespan sample. Neuroimage 144, 262–269 (2017).
- Jenkinson, M., Beckmann, C. F., Behrens, T. E. J., Woolrich, M. W. & Smith, S. M. Fsl. Neuroimage 62, 782–790 (2012).
- Cole, J. H. et al. Predicting brain age with deep learning from raw imaging data results in a reliable and heritable biomarker. Neuroimage 163, 115–124 (2017).
- Rasmussen, C. E. in Advanced lectures on machine learning 63–71 (Springer, 2004).
- Basak, D., Pal, S. & Patranabis, D. C. Support vector ordinal regression. Neural Comput. 11, 203–224 (2007).
- Jolliffe, I. in International encyclopedia of statistical science 1094–1096 (Springer Berlin Heidelberg, 2011).
- Thompson, B. in Encyclopedia of statistics in behavioral science 192–196 (Wiley, 2005).
- Efron, B. & Tibshirani, R. Bootstrap methods for standard errors, confidence intervals, and other measures of statistical accuracy. Stat. Sci. 1, 54–77 (1986).
- McIntosh, A. R., Bookstein, F. L., Haxby, J. V & Grady, C. L. Spatial pattern analysis of functional brain images using partial least squares. Neuroimage 3, 143–157 (1996).
- McIntosh, A. R. & Lobaugh, N. J. Partial least squares analysis of neuroimaging data: Applications and advances. Neuroimage 23, 250–263 (2004).
- Andersen, B. B., Gundersen, H. J. G. & Pakkenberg, B. Aging of the Human Cerebellum: A Stereological Study. J. Comp. Neurol. 466, 356–365 (2003).
- Torvik, A., Torp, S. & Lindboe, C. F. Atrophy of the cerebellar vermis in ageing. A morphometric and histologic study. J. Neurol. Sci. 76, 283–294 (1986).
- Good, C. D. et al. A Voxel-Based Morphometric Study of Ageing in 465 Normal Adult Human Brains. Neuroimage 14, 21–36 (2001).
- Fjell, A. M. et al. High consistency of regional cortical thinning in aging across multiple samples. Cereb. Cortex 19, 2001–2012 (2009).
- Salat, D. H. et al. Thinning of the cerebral cortex in aging. Cereb. Cortex 14, 721–730 (2004).
Figures