2636
Visualization of the Substantia Nigra Pars Compacta: comparison between DANTE T1-SPACE and T1-SPACE1Department of Diagnostic Radiology and Nuclear Medicine, Graduate School of Medicine, Kyoto University, Kyoto, Japan, 2Human Brain Research Center, Graduate School of Medicine, Kyoto University, Kyoto, Japan, 3Integrated Clinical Education Center, Kyoto University Hospital, Kyoto, Japan, Kyoto, Japan, 4Siemens Healthineers, Portland, OR, United States, 5Siemens Healthineers, San Francisco, CA, United States
Synopsis
Neuromelanin-sensitive magnetic resonance techniques have been used for depicting neuromelanin-rich structures such as the substantia nigra pars compacta (SNpc). We compared visualization of the SNpc between delay alternating with nutation for tailored excitation-prepared T1-weighted variable flip angle turbo spin echo (DANTE T1-SPACE) and T1-SPACE without DANTE pulse (T1-SPACE) in 8 healthy volunteers. DANTE T1-SPACE provided better delineation of the SNpc and showed higher contrast than T1-SPACE. DANTE T1-SPACE may be a viable tool for evaluating the SNpc.
Introduction
The visualization of neuromelanin in the substantia nigra pars compacta (SNpc) is important for evaluating patients with Parkinson’s disease.1-3 Neuromelanin in the SNpc has paramagnetic properties resulting in signal increase on specific T1-weighted MR images.1-7 Delay alternating with nutation for tailored excitation (DANTE) pulse has been used for high resolution NMR spectroscopy and cardiac tagging. DANTE prepared T1-weighted variable flip angle turbo spin echo (DANTE-T1-SPACE) has been recently used for black-blood imaging. We found the SNpc was visualized well on high resolution DANTE-T1-SPACE, but, the effect of DANTE pulse on visualization of neuromelanin was unknown. The purpose of this study was to compare the visualization of the SNpc between DANTE T1-SPACE and T1-SPACE without DANTE pulse (T1-SPACE).Methods
Subjects
This study was approved by the institutional review board, and written informed consent was obtained prior to the scan. We enrolled 8 healthy elderly volunteers (3 males and 5 females; mean age 60.5, range 24-78 years) who had MRI scans including DANTE T1-SPACE and T1-SPACE.
Image Acquisition
MR imaging was performed at a 3T MR scanner (MAGNETOM Skyra, Siemens Healthineer AG, Erlangen, Germany) with a 32-channel head coil.
Parameters for T1-SPACE were as follows: sagittal acquisition; TR/TE, 1000 ms/11 ms; variable flip angle; echo train length, 60; FOV, 180×180 mm; resolution, 0.56×0.56×0.56 mm; Controlled Aliasing In Parallel Imaging Results IN Higher Acceleration (CAIPIRINHA), acceleration factor, 2×2; fat suppression; and acquisition time, 5 min 44 sec.
Parameters of the DANTE preparation module were as follows: flip angle, 10°; RF duration, 0.08 ms; number of pulses, 148; total pulse duration, 167.24 ms; and spoiler gradient area, 18 mT/m×ms.
DANTE pulse was applied for DANTE T1-SPACE, and no additional pulse was applied for T1-SPACE.
Post-imaging Procedure
T1-SPACE images were co-registered to DANTE-T1-SPACE images by using SPM12 software (Wellcome Department of Imaging Neuroscience, University College London, United Kingdom) implemented in MATLAB 2014b (Mathworks, Natick, MA). Both images were resliced to the axial orientation with isotropic 0.56 mm resolution by using ImageJ software (National Institutes of Health, Bethesda, MD).
Data Analysis
Regions of interest (ROIs) were manually placed using ImageJ software (National Institutes of Health, Bethesda, MD) (Figure 1). ROIs of 3 parts (medial, central and lateral) of the bilateral SNpc were placed on T1-SPACE images and applied to DANTE T1-SPACE images of the same subject. The slice on which the SNpc was the most clearly visible was selected. We also put oval ROIs of the decussation of the superior cerebellar peduncles (SCP) on the same slice. The shape and size of ROIs were the same for the SNpc and SCP, respectively.
We calculated the contrast ratio as follows: the mean signal intensity of the SCP was subtracted from the averaged signal intensity of the 6 SNpc ROIs, and then divided by the mean signal of the SCP.
Statistical analysis was performed to determine the difference in the contrast ratios of DANTE T1-SPACE and T1-SPACE using paired t-test. A P value less than 0.05 was considered to be statistically significant.
Results
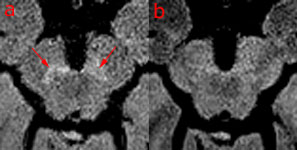
An example of DANTE T1-SPACE and T1-SPACE images is shown in Figure 2. DANTE T1-SPACE was able to delineate the SNpc much better than T1-SPACE without DANTE. The average of contrast ratios was significantly higher in DANTE T1-SPACE than T1-SPACE (P=0.010), suggesting better visualization of the SNpc on DANTE T1-SPACE (Figure 3).Discussion
Several neuromelanin-sensitive MRI sequences have been used to identify neuromelanin in the SNpc.1-5 Loss of neuromelanin in the SNpc is observed in Parkinson’s disease and is correlated with disease severity.1-3 Therefore, neuromelanin imaging is thought to be a potential diagnostic and progression marker. Neuromelanin in the SNpc is known to form a complex with iron and have paramagnetic properties, resulting in T1 shortening.1-7 Magnetization transfer effects (MT effects) also contribute to the contrast of the neuromelanin imaging.1,2,7 In our study, DANTE T1-SPACE showed much better visualization of the SNpc than T1-SPACE without DANTE pulse, which is probably due to the MT effect of DANTE pulse.8 Besides, thanks to CAIPIRINHA with an acceleration factor of 4, acquisition time of DANTE T1-SPACE in this study (5 min 44 sec) is much shorter than that of conventional neuromelanin imaging (approximately 12 min).1 It is possible that DANTE T1-SPACE can be a viable imaging tool for neuromelanin-rich structures as well as black-blood imaging, and may provide a potential tool for diagnosis and a progression marker of Parkinson’s disease.Conclusion
DANTE T1-SPACE can be a better neuromelanin imaging tool to delineate the SNpc than T1-SPACE without DANTE.Acknowledgements
We are grateful to Mr. Katsutoshi Murata, Mr. Yuta Urushibata, and Mr. Hirokazu Kawaguchi, Siemens Healthcare K. K., for their kind help.References
1. Sasaki M, Shibata E, Tohyama K, et al. Neuromelanin magnetic resonance imaging of locus ceruleus and substantia nigra in Parkinson's disease. Neuroreport, 2006. 17(11): p. 1215-8.
2. Schwarz ST, Xing Y, Tomar P, et al. In Vivo Assessment of Brainstem Depigmentation in Parkinson Disease: Potential as a Severity Marker for Multicenter Studies. Radiology, 2017. 283(3): p. 789-798.
3. Nakamura K, Sugaya K. Neuromelanin-sensitive magnetic resonance imaging: a promising technique for depicting tissue characteristics containing neuromelanin. Neural Regen Res, 2014. 9(7): p. 759-60.
4. Sasaki M, Shibata E, Ohtsuka K, et al. Visual discrimination among patients with depression and schizophrenia and healthy individuals using semiquantitative color-coded fast spin-echo T1-weighted magnetic resonance imaging. Neuroradiology, 2010. 52(2): p. 83-9.
5. Enochs WS, Petherick P, Bogdanova A, et al. Paramagnetic metal scavenging by melanin: MR imaging. Radiology, 1997. 204(2): p. 417-23.
6. Zecca L, Shima T, Stroppolo A, Goj C, et al. Interaction of neuromelanin and iron in substantia nigra and other areas of human brain. Neuroscience. 1996 Jul;73(2):407-15.
7. Sulzer D, Cassidy C, Horga G, et al. Neuromelanin detection by magnetic resonance imaging (MRI) and its promise as a biomarker for Parkinson’s disease. NPJ Parkinsons Dis. 2018; 4: 11.
8. Jones RA, Haraldseth O, Schjøtt J, et al. Effect of Gd-DTPA-BMA on magnetization transfer: application to rapid imaging of cardiac ischemia. J Magn Reson Imaging, 1993. 3(1): p. 31-9.
Figures