2635
Simultaneous imaging of neuromelanin and nigrosome 1 in substantia nigra using 3D multi-echo gradient echo acquisition with magnetization transfer preparation1Department of Radiology, Seoul St. Mary's Hospital, The Catholic University of Korea., Seoul, Korea, Republic of, 2Department of Radiology, Gachon University Gil Medical Center, Incheon, Korea, Republic of
Synopsis
Recently, neuromelanin and
Introduction
Recently, neuromelanin (NM) and nigrosome 1 (N1) imaging techniques1-5 have been developed to evaluate the substantia nigra in Parkinsons’s disease (PD). Typically, NM contrast is maximized by magnetization transfer (MT) pulses and N1 contrast is maximized by susceptibility weighting for the surrounding iron-rich regions, respectively. Since the contrast mechanisms of the two images are different, the separated scans are required to obtain the two contrasts. Although a duel-echo gradient echo sequence with MT pulses for simultaneous acquisition of NM and susceptibility weighted images was introduced6, an only 2D acquisition was investigated and N1 evaluation was not performed. In this study, we investigate the potential utility of a 3D multi-echo gradient echo acquisition for simultaneous imaging of NM and N1 in the substantia nigra.Methods
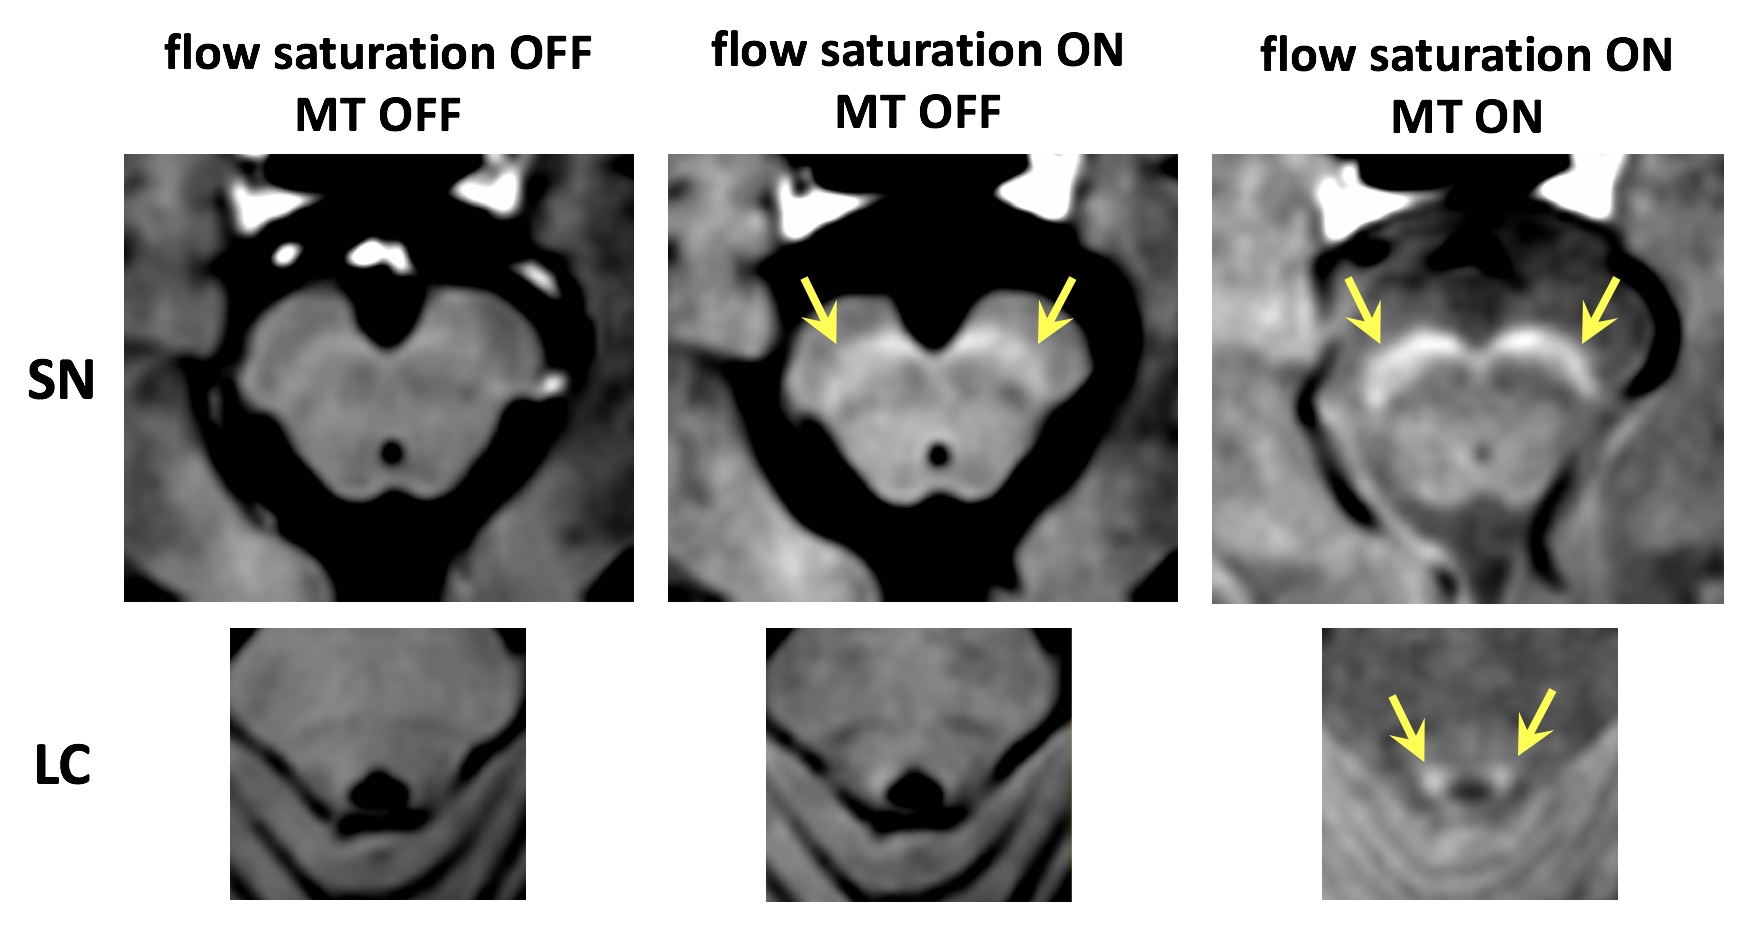
Data acquisition: We modified the previously proposed N1 imaging protocol7 to obtain NM contrast simultaneously. MT and flow saturation pulses were added and 5 echoes were obtained. MT pulses were for the NM contrast and flow saturation pulses for inflow artifact reduction. By using inflow saturation pulses, flow compensations were excluded to minimize first echo time for the NM contrast. IRB-approved seven subjects including one PD patient were scanned on a clinical 3T MRI with following multi-echo 3D gradient echo protocol: MT pulse (off-resonance = 860 Hz), regional saturation pulse (inferior to the imaging slab), TR = 80 ms, number of echoes = 5, TE = 4.9, 13.5, 22.2, 30.9, 39.6 ms, flip angle = 20°, voxel size = 0.75x0.75x1.5mm3, bandwidth = 144 Hz/px, number of slices = 32, acceleration factor = 2, total scan time = 5 min. To evaluate the reproducibility of the proposed method, the same scan was repeated after repositioning with an interval of 30 minutes for each subject. For one additional subject, three scans with different combinations of preparation pulses (1: without preparation pulses, 2: with only flow saturation, 3: with both MT and flow saturation) were performed to observe the effects of individual preparation pulses on the NM contrast.
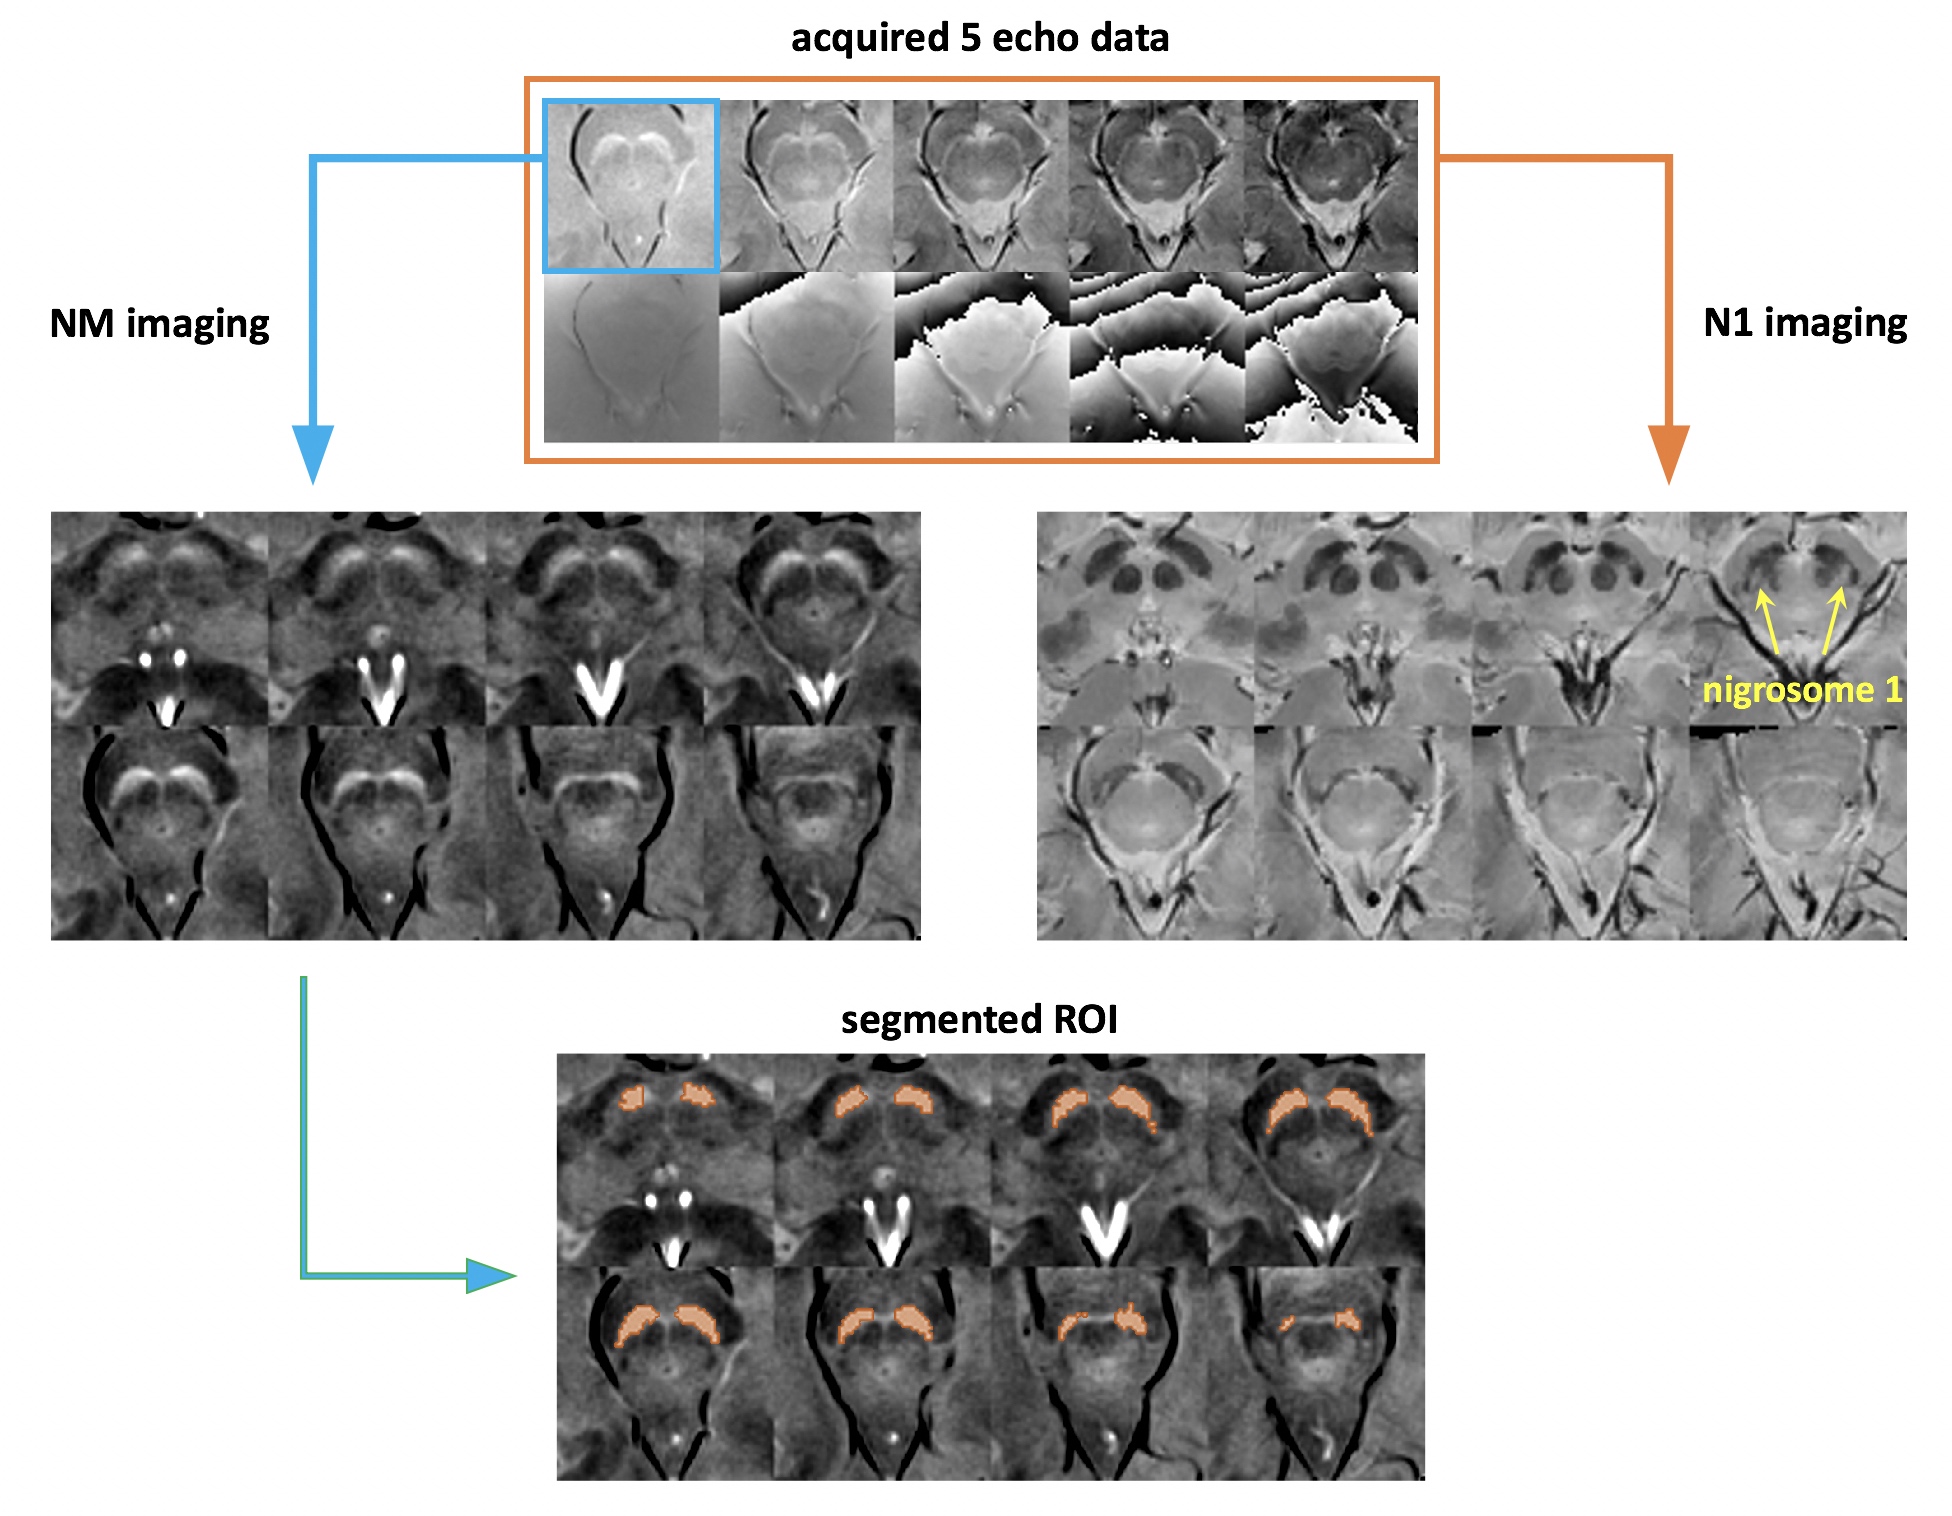
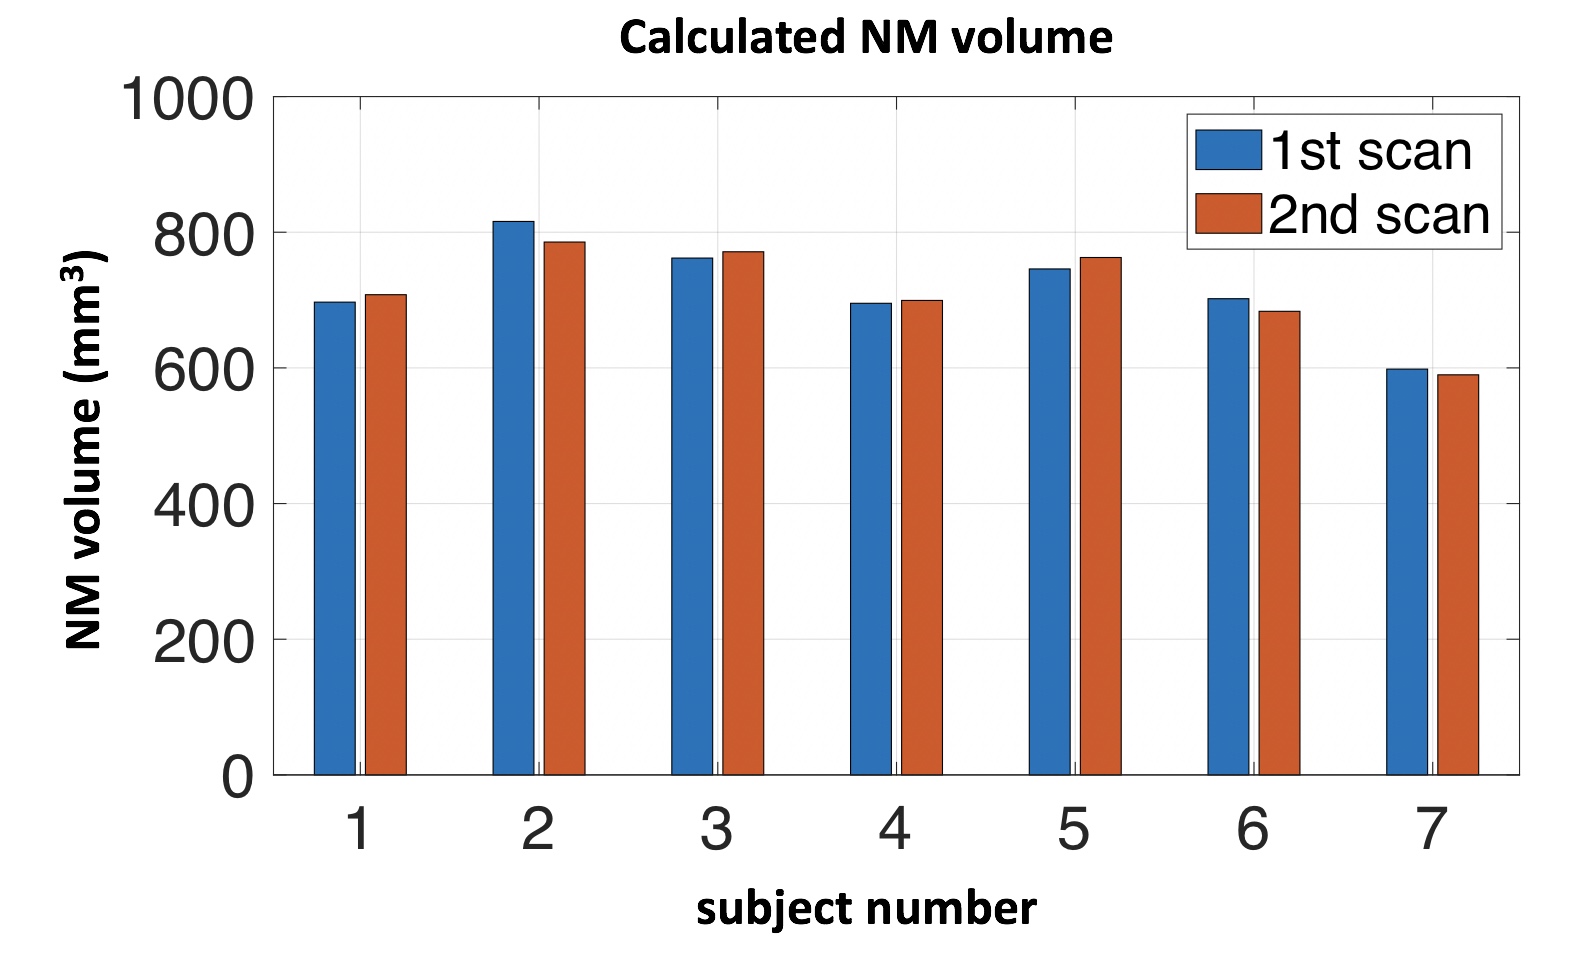
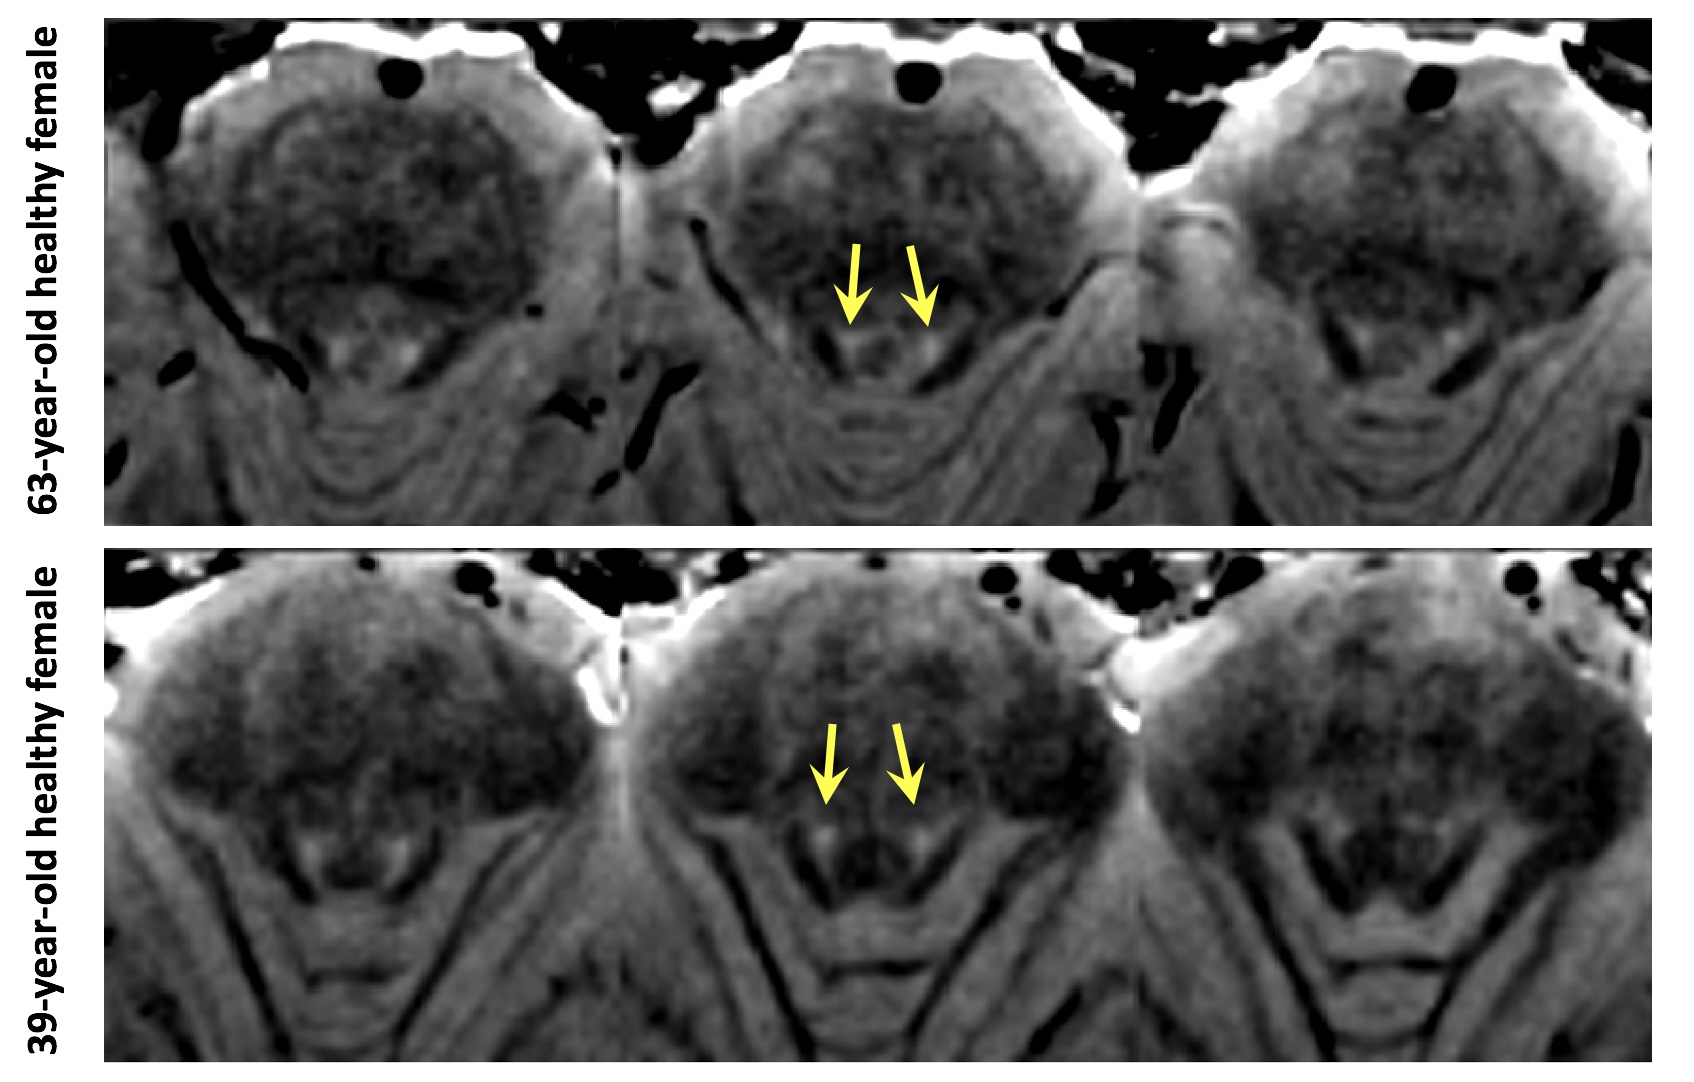
Image processing and analysis: For the N1 contrast, the susceptibility map weighted images were reconstructed from the complex 5-echo data using the method described in the previous study7. The presence of N1 (arrows in Fig. 1) was visually evaluated for each subject from the N1 images. For the NM contrast, the first echo magnitude images were utilized. For calculation of the NM-weighted region volume, low-frequency variations were reduced by dividing Gaussian filtering with large sigma value (sigma = 12 mm) and the thresholding was performed. After thresholding, the connected components were labeled using a 26-connected neighborhood and the components corresponding to the substantia nigra were selected (red regions in Fig. 1). The overall process is summarized in Figure 1. A pairwise t-test was performed to determine the statistical significance of the calculated NM volumes between the repeated scans. A p-value of 0.05 or smaller was considered statistically significant. Additionally, the NM contrast in the locus coeruleus, which is known to be an NM-rich region1,8, was visually evaluated.
Results
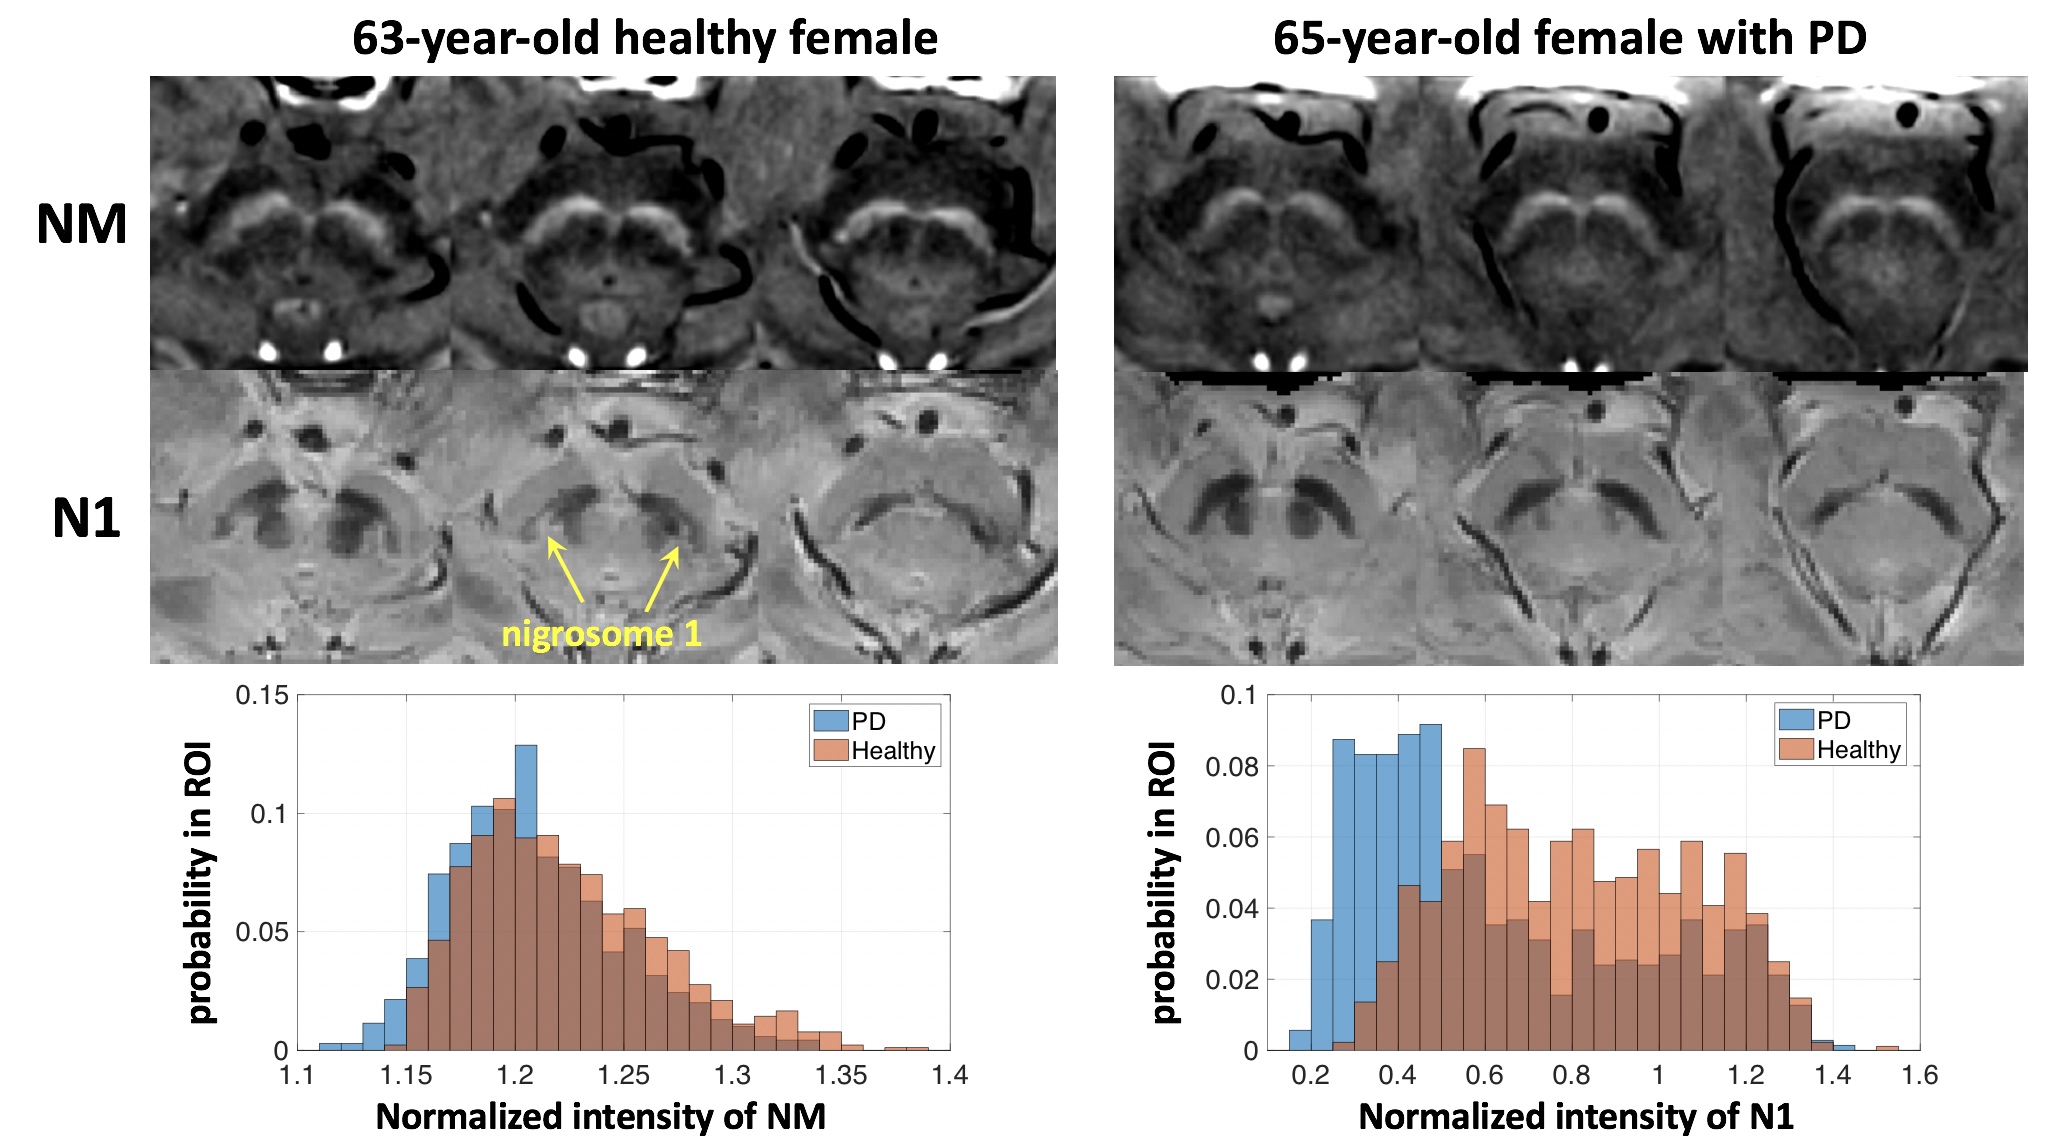
Figure 2 shows that the MT pulses mainly increases NM contrast for the substantia nigra and locus coeruleus regions, but the flow saturation pulses also contribute to the NM contrast. The results of the age-matched subjects show relatively low signal intensities on the NM images and the unclear N1 regions on the N1 images for the PD compared to the healthy subject (Figure 3). We observed the N1 regions on the N1 images for all healthy subjects. These are consistent with the results of previous studies performed independently for the two contrasts. The reproducibility results demonstrate that the differences of the calculated NM volumes between the two scans are not statistically significant. Figure 4 shows the calculated NM volumes for the repeated scans. For all healthy subjects, the visible NM contrasts were observed for both the substantia nigra and locus coeruleus regions. Although relatively large voxelsize (0.75x0.75x1.5 mm3) was used compared to previous studies, the NM contrasts of the locus coeruleus could be observed on the images as shown in Figure 5.Discussion and Conclusion
We demonstrated that the proposed simultaneous NM and N1 imaging method could provide reliable estimates of whole NM-rich region volumes of the substantia nigra and detect the N1 regions in the healthy substantia nigra in practically acceptable scan time (5 minutes). This multi-contrast approach also could provide R2* and quantitative susceptibility maps as well as the NM and N1 images, allowing multi-parametric analysis without registration process. The proposed method may help to assess the abnormalities of the substantia nigra structures.Acknowledgements
This research was supported by Basic Science Research Program through the National Research Foundation of Korea (NRF) funded by the Ministry of Education (NRF-2017R1D1A1B03030772).References
1. Sasaki, M., Shibata, E., Tohyama, K., Takahashi, J., Otsuka, K., Tsuchiya, K., ... & Sakai, A. (2006). Neuromelanin magnetic resonance imaging of locus ceruleus and substantia nigra in Parkinson's disease. Neuroreport, 17(11), 1215-1218.
2. Trujillo, P., Summers, P. E., Ferrari, E., Zucca, F. A., Sturini, M., Mainardi, L. T., … Costa, A. (2017). Contrast mechanisms associated with neuromelanin-MRI. Magnetic Resonance in Medicine, 78(5), 1790–1800.
3. Kwon, D. H., Kim, J. M., Oh, S. H., Jeong, H. J., Park, S. Y., Oh, E. S., ... & Cho, Z. H. (2012). Seven‐Tesla magnetic resonance images of the substantia nigra in Parkinson disease. Annals of neurology, 71(2), 267-277.
4. Schwarz, S. T., Afzal, M., Morgan, P. S., Bajaj, N., Gowland, P. A., & Auer, D. P. (2014). The ‘Swallow Tail’Appearance of the Healthy Nigrosome–A New Accurate Test of Parkinson's Disease: A Case-Control and Retrospective Cross-Sectional MRI Study at 3T. PloS one, 9(4), e93814.
5. Noh, Y., Sung, Y. H., Lee, J., & Kim, E. Y. (2015). Nigrosome 1 detection at 3T MRI for the diagnosis of early-stage idiopathic Parkinson disease: assessment of diagnostic accuracy and agreement on imaging asymmetry and clinical laterality. American Journal of Neuroradiology.
6. Langley, J., Huddleston, D. E., Chen, X., Sedlacik, J., Zachariah, N., & Hu, X. (2015). A multicontrast approach for comprehensive imaging of substantia nigra. NeuroImage, 112, 7–13.
7. Nam, Y., Gho, S. M., Kim, D. H., Kim, E. Y., & Lee, J. (2017). Imaging of nigrosome 1 in substantia nigra at 3T using multiecho susceptibility map‐weighted imaging (SMWI). Journal of Magnetic Resonance Imaging, 46(2), 528-536.
8. Keren, N. I., Taheri, S., Vazey, E. M., Morgan, P. S., Granholm, A. C. E., Aston-Jones, G. S., & Eckert, M. A. (2015). Histologic validation of locus coeruleus MRI contrast in post-mortem tissue. NeuroImage, 113, 235–245.
Figures