2634
The visualization of the morphology change within depigmented substantia nigra using high field postmortem MRI1Department of Biomedical Engineering, Ulsan National Institute of Science and Technology, Ulsan, Korea, Republic of, 2Department of Anatomy, Pusan National University School of Medicine, Yangsan, Korea, Republic of, 3Department of Neurology, Pusan National University Hospital, Busan, Korea, Republic of, 4Department of Forensic Medicine, Pusan National University School of Medicine, Yangsan, Korea, Republic of, 5Department of Neurology, Pusan National University Yangsan Hospital, Yangsan, Korea, Republic of
Synopsis
The purpose of this study was to determine the alteration of the morphology in the substantia nigra using MRI with histopathological validation for the patients of atypical Parkinsonism. MR experiments for formalin fixed autopsied brains were operated using a 7T imaging system. Specific visualization of ferric iron and neuromelanin from MR relaxometry was used to identify the neuromelanin distribution within the normal brain and the brain of Perry syndrome. The loss of neuromelanin pigment within the substantia nigra of Perry syndrome was consistently confirmed both from MR relaxometry and from the directly captured picture during the cryo-section.
Purpose
Neuromelanin is a dark-brown pigmented granule which stores iron molecules in dopaminergic neurons of substantia nigra (SN).1 The significant loss of neuromelanin pigment was identified in the SN of Parkinsonism.1 Perry syndrome (PS) is a kind of rarely hereditary neurodegenerative disease.2 It is characterized by the neuronal destruction with distinct TDP-43 pathology.2 Noninvasively distinguishing the distribution and the density of neuromelanin pigment of normal brain and the brain of Parkinsonism is meaningful to investigate the progression of PS. The T1 weighted image with magnetization transfer (MT) effects has been reported to suggest the distribution of neuromelanin by neuromelanin specific hyperintense contrast.3 In addition, the effective size difference between iron molecules and neuromelanin-iron complex influences differently to T2 and T2* values.4 The aim of this study was to determine the change of iron deposits and iron-chelated neuromelanin within postmortem SN of PS patients by combining quantitative MR relaxometries on verifiable postmortem normal and PS brain.Method
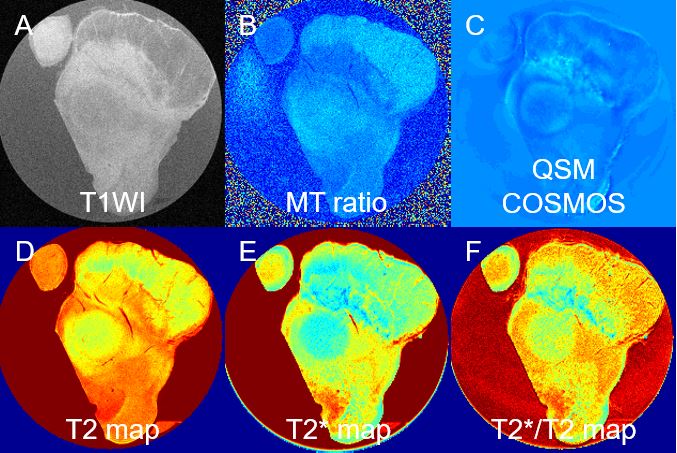
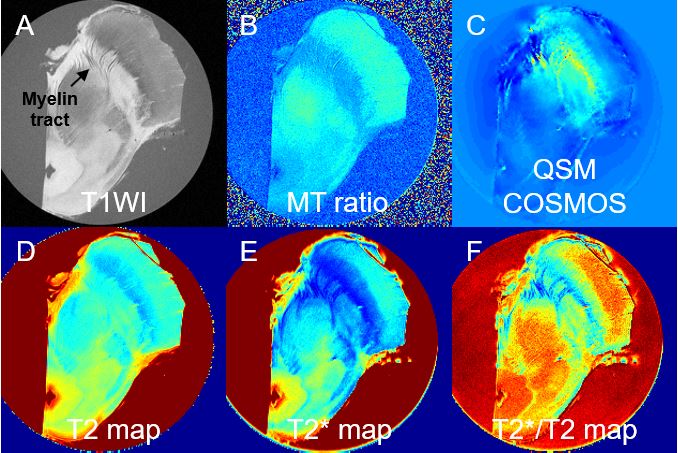
The midbrain samples were obtained during the autopsies of the normal brain without any evidence of neurodegenerative disorders and the brain of PS from Pusan National University Brain Bank and Pusan National University Anatomical Donation Program. Experiments of this postmortem study were conducted under the approval of institutional review board of Pusan National University Yangsan Hospital and Ulsan National Institute of Science and Technology. The tissues were fixed in 10% formalin and processed accordingly. Postmortem MR experiments at 7T preclinical scanner (Bruker, Germany) were performed for neuromelanin-sensitive T1 weighted image with MT effects, Quantitative susceptibility mapping (QSM) from calculation of susceptibility through multiple orientation sampling (COSMOS), T2 map, T2* map, and T2*/T2 map. For the direct pathological validation, histochemical examinations were implemented for both cases. The cryoprotected tissues by sucrose solution were sectioned to the slice of 50 μm thickness.Result
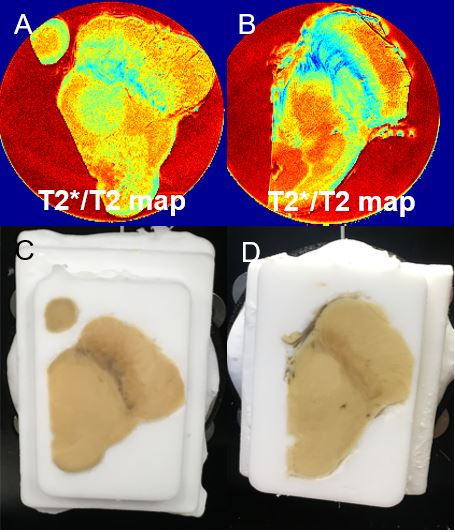
The MR images were shown for the brain of healthy control and PS in Figure 1 and Figure 2 including T1 weighted image with MT effects (A), MT ratio (B), QSM from COSMOS (C), T2 map (D), T2* map (E), T2*/T2 map (F). For the healthy control, T1 weighted image with MT effects (Figure 1A) showed hyperintense area on the whole SN. The MT ratio (Figure 1B) processed from the T1 weighted image without MT effect and with MT effect presented the high values on the myelin fiber of white matter. The QSM from COSMOS (Figure 1C) showed paramagnetic lines within the SN which suggest the distribution of paramagnetic neuromelanin-iron complex in SN detected from sectioned slide (Figure 3C). Both neuromelanin-iron complex and iron deposition contributed to shortening T2* (Figure 1E). T2 map (Figure 1D) presented the distribution of ferric iron near the boundary between SN and cerebral peduncle (CP). The effect of iron deposition on shortened T2* map was accordingly reduced in T2*/T2 map (Figure 1F) only producing the contrast for the distribution of iron-chelated neuromelanin. For the case of PS, the projected myelin tracts to the SN were shown as hypointense line (black arrow) in T1 weighted image with MT effects (Figure 2A) and high values in MT ratio (Figure 2B). QSM (Figure 2C) showed paramagnetic regions for the myelin tract and along the boundary between SN and CP. The paramagnetic myelin tract appears in the T2* map (Figure 2E) with broad iron deposition with shortened values. The shortened regions of T2 map (Figure 2D) were only correlated to the iron deposition. T2*/T2 map showed significantly developed contrast for projected myelin fiber with reduced effect of iron deposition. No significant neuromelanin distribution was observed in T2*/T2 map (Figure 3B) and cryo-sections (Figure 3D).Discussion
In our study, the evidence of neuromelanin pigment was shown in T2*/T2 map of normal brain. However, it cannot be found in the brain of PS which was validated from the cryo-sectioned slide. The myelin tracts projected to SN were only shown as the noticeable contrast in T2*/T2 map from their paramagnetic characteristics with shortened T2*. The myelin fibers of PS were predicted to transport iron molecules between two compartments of the brain tissues as the pallidal-nigral pathways, fascicula nigrale.5 Due to the destruction of the iron transport mechanism, the high concentration of iron molecules were suggested to be deposited in the myelin tract.
Commonly, shortened T2 values were highly connected to the deposited iron molecules regardless of the concentration of iron molecules. The T2* values were associated with the size of the architecture such as the radius of the cylinder and the sphere. Therefore, the neuromlenanin-iron complex from normal brain and myelin tract of PS which contains high concentration of iron molecules can be separated in the SN by T2*/T2 technique.
Acknowledgements
This work was supported by the Korea Health Industry Development Institute by the 2018 Research Fund (HI18C0713).References
1. Gerlach, M., Double, K. L., Ben-Shachar, D., Zecca, L., Youdim, M. B., & Riederer, P. (2003). Neuromelanin and its interaction with iron as a potential risk factor for dopaminergic neurodegeneration underlying Parkinson's disease. Neurotoxicity Research, 5(1-2), 35-43.
2. Konno, T., Ross, O. A., Teive, H. A., Sławek, J., Dickson, D. W., & Wszolek, Z. K. (2017). DCTN1-related neurodegeneration: Perry syndrome and beyond. Parkinsonism & related disorders, 41, 14-24.
3. Sasaki, M., Shibata, E., Kudo, K., & Tohyama, K. (2008). Neuromelanin-sensitive MRI. Clinical Neuroradiology, 18(3), 147-153.
4. Lee, H., Baek, S. Y., Chun, S. Y., Lee, J. H., & Cho, H. (2018). Specific visualization of neuromelanin-iron complex and ferric iron in the human post-mortem substantia nigra using MR relaxometry at 7T. Neuroimage, 172, 874-885.
5. Peckham, M. E., Dashtipour, K., Holshouser, B. A., Kani, C., Boscanin, A., Kani, K., & Harder, S. L. (2016). Novel pattern of iron deposition in the fascicula nigrale in patients with Parkinson’s disease: a pilot study. Radiology research and practice, 2016.
Figures