2633
Microstructural Changes in Human Substantia Nigra with Aging as Revealed by Non-Gaussian Diffusion MRI1Center for MR Research, University of Illinois at Chicago, Chicago, IL, United States, 2Department of Bioengineering, University of Illinois at Chicago, Chicago, IL, United States, 3Department of Radiology and Neurology, University of Illinois at Chicago, Chicago, IL, United States
Synopsis
Aging is considered a major factor in the development of neurodegenerative disease. The aging process can result in brain tissue microstructural alterations, particularly in regions relevant to neurodegeneration, such as the substantia nigra (SN). In this study, we employed a non-Gaussian diffusion model – the continuous-time random-walk (CTRW) model – together with a high-resolution diffusion acquisition technique to investigate the possible microstructural changes in the SN in normal aging. Two CTRW model parameters have exhibited significant differences in the SN between young and elderly healthy human subjects.
Introduction
Aging is considered a major factor in the development of neurodegenerative diseases such as Parkinson’s Disease, which is characterized by the progressive degeneration of dopaminergic neurons in the substantia nigra (SN). Studies on adult mice as well as on human have suggested structural changes in the SN with aging1,2. The structural changes can be potentially detected using diffusion-weighted imaging (DWI), which has emerged as an important tool to study tissue microstructures with both Gaussian and non-Gaussian models. Although the Gaussian model is widely used, its assumption of Gaussian distribution of diffusion displacement breaks down when b-values become higher (e.g. >1500 s/mm2 in human brain tissues). As a result, a number of non-Gaussian diffusion models have been proposed, each with its own potential in revealing different aspects of tissue microstructure and microenvironment3–5. In this study, we employ a non-Gaussian diffusion model – the continuous-time random-walk (CTRW) model – together with a high-resolution diffusion acquisition technique to investigate the possible microstructural changes in the SN in normal aging.Materials and Methods
Subjects:
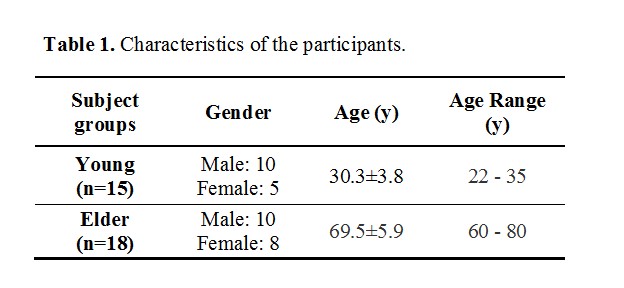
With IRB approval, 18 elderly and 15 young healthy subjects were recruited in the study. The characteristics of all subjects are summarized in Table 1.
Image Acquisition:
All subjects underwent diffusion MRI on a 3T GE MR750 scanner. Diffusion images were acquired from the brainstem using a customized reduced field-of-view sequence6 with seven b-values: 04, 502, 2002, 5004, 10004, 20004, and 30004 s/mm2 (the subscript denotes NEXs). The other parameters were: TR/TE=3080/86ms, slice thickness=3mm, FOV=10cm×6cm, and matrix size=160×96, producing a voxel size of 0.6×0.6×3mm3. At each non-zero b-value, trace-weighted images were obtained to minimize the effect of diffusion anisotropy.
Image and Statistical Analysis:
The CTRW model describes the diffusion-weighted (DW) signal using a Mittag-Leffler function Eα: $$M(b)=M_{0}E_{\alpha}(-(bD_{m})^{\beta}), [1] $$ where Dm is an anomalous diffusion coefficient, and α and β are the temporal and spatial diffusion heterogeneity parameters, respectively7. Eq. [1] was used to fit the multi-b-value diffusion images voxel-by-voxel, producing maps of Dm, α and β. For comparison, apparent diffusion coefficient (ADC) was also computed using b-values of 50 and 1000 s/mm2.
For each subject, regions-of-interest (ROIs) were drawn on each side of the SN as well as in the tegmentum which served as an internal reference to exclude other confound factors8. The mean value of each diffusion parameter within the ROIs was calculated and compared between the young and the elderly groups using a 2-tailed Student’s t-test.
Results
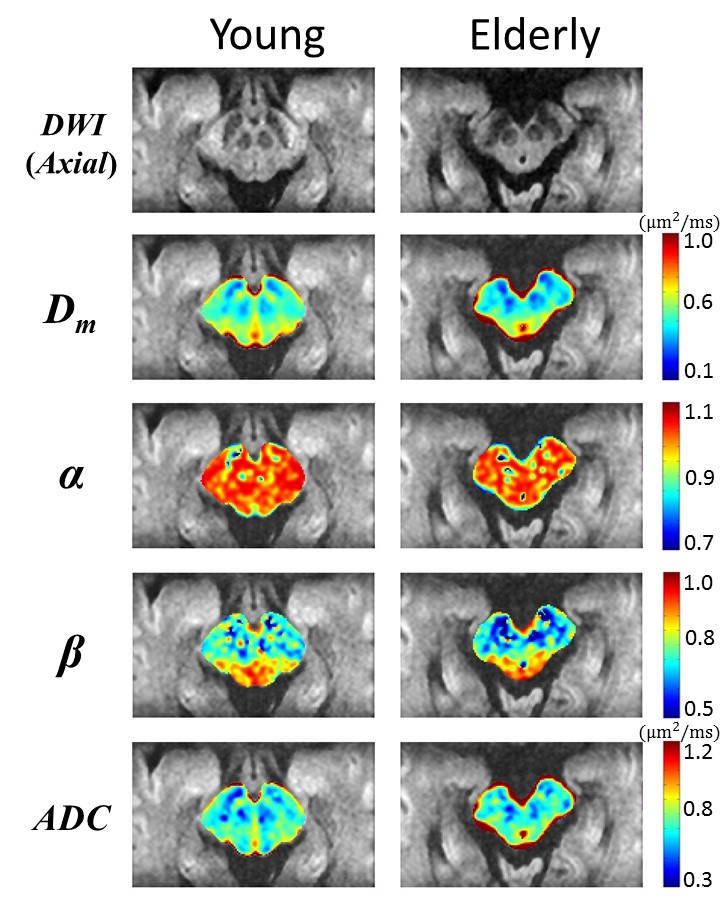
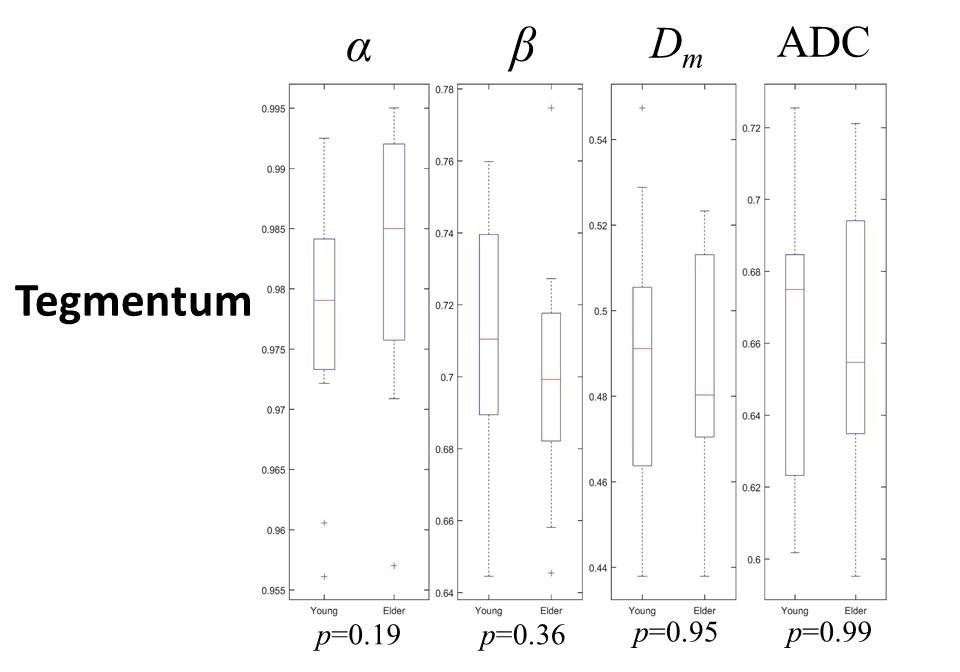
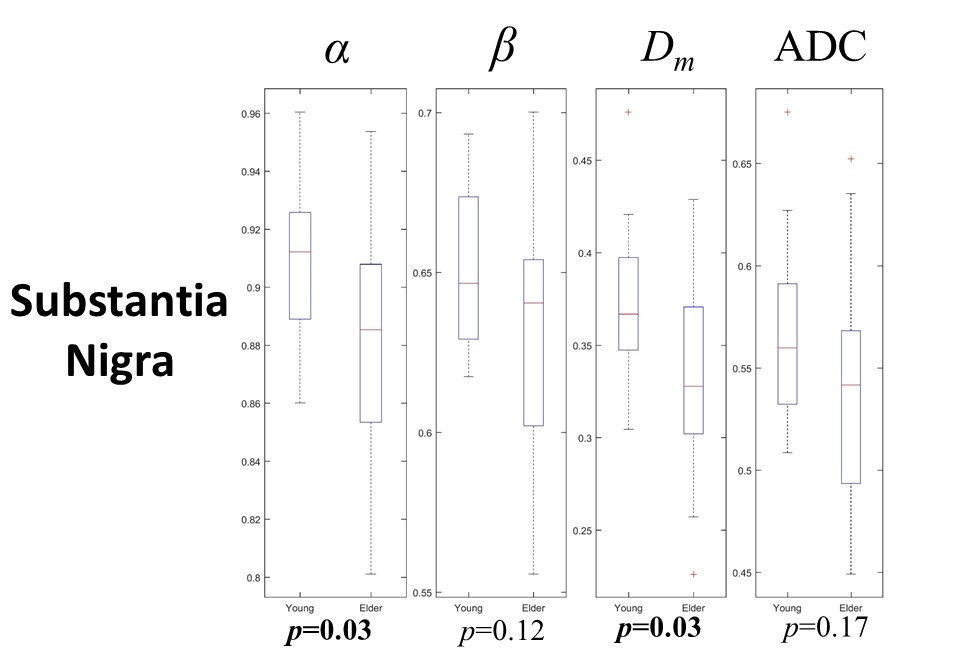
The first row of Figure 2 shows representative diffusion-weighted images at b=1000 s/mm2 from a young (left) and an elderly subject (right), where structures in the brainstem were resolved with high spatial resolution (voxel size=0.6×0.6×3 mm3). The remaining rows in Figure 2 illustrate a set of maps of Dm, α, β, and ADC obtained from the same subjects. In group analysis, the tegmentum (i.e, the reference) did not exhibit significant difference between the young and elderly groups in any of the four diffusion parameters (Figure 3, p>0.1). In contrast, in the SN significant differences were observed in α and Dm (p=0.03) between the two groups, as shown in Figure 4.Discussion and Conclusion
With the use of a non-Gaussian diffusion model together with a high-resolution DWI acquisition technique, we have found significant differences in the SN between the young and elderly healthy subjects. The difference was observed in Dm, but not in ADC, possibly due to the increased sensitivity when non-Gaussian diffusion behaviors of water molecules accounted for. The decreased Dm can be explained by hypertrophy of the neurons in the SN with aging2 as well as the presence of age-related gliosis and microglia9. α and β have been associated with the temporal and spatial diffusion heterogeneity, respectively7,8. The decreased α in the SN observed in the elderly group suggests that water molecules are diffusing through an increasingly more heterogeneous environment. Both decreased Dm and α likely reflect specific aspects of tissue microstructural changes associated with aging. With histology correlation in future studies, the exact microstructural change may be identified. In conclusion, high b-value DWI with the CTRW model has provided evidence of age-related alterations in the SN of healthy human subjects.Acknowledgements
This work was supported in part by NIH 1S10RR028898 and R01EB026716. We thank Michael Flannery and Hagai Ganin for technical assistance.References
- Gao, L., Hidalgo-Figueroa, M., Escudero, L. M., et al. Age-mediated transcriptomic changes in adult mouse substantia nigra. PloS One 8, e62456 (2013).
- Nakane, M., Tamura, A., Miyasaka, N., et al. Astrocytic swelling in the ipsilateral substantia nigra after occlusion of the middle cerebral artery in rats. AJNR Am. J. Neuroradiol. 22, 660–663 (2001).
- Niendorf, T., Dijkhuizen, R. M., Norris, D. G., et al. Biexponential diffusion attenuation in various states of brain tissue: Implications for diffusion-weighted imaging. Magn. Reson. Med. 36, 847–857 (1996).
- Zhou, X. J., Gao, Q., Abdullah, O. and Magin, R. L. Studies of anomalous diffusion in the human brain using fractional order calculus. Magn. Reson. Med. 63, 562–569 (2010).
- Karaman, M. M., Sui, Y., Wang, H., et al. Differentiating low- and high-grade pediatric brain tumors using a continuous-time random-walk diffusion model at high b-values. Magn. Reson. Med. 76, 1149–1157 (2016).
- Zhou, X. J., Sui, Y. Image Domain Segmented Echo Planar Magnetic Resonance Imaging Using a 2D Excitation Radiofrequency Pulse. U.S. Patent No 9797970 B2. 2017.
- Karaman, M. M., Sui, Y., Wang, H., et al. Differentiating low- and high-grade pediatric brain tumors using a continuous-time random-walk diffusion model at high b-values. Magn. Reson. Med. (2015).
- Zhong, Z., Merkitch, D., Karaman, M. M., et al. Lateral Dependence of Brainstem Structural Abnormalities in Parkinson’s Disease as Revealed by High-Resolution Non-Gaussian Diffusion MR Imaging. in 25th ISMRM 2017 P0611,
- Jyothi, H. J., Vidyadhara, D. J., Mahadevan, A., et al. Aging causes morphological alterations in astrocytes and microglia in human substantia nigra pars compacta. Neurobiol. Aging 36, 3321–3333 (2015).
Figures