2632
Characterizing age-related microstructural changes in locus coeruleus and substantia nigra1Center for Advanced Neuroimaging, University of California Riverside, Riverside, CA, United States, 2Department of Psychology, University of California Riverside, Riverside, CA, United States, 3Department of Bioengineering, University of California Riverside, Riverside, CA, United States
Synopsis
Characterization of age-related alterations in composition and morphology of locus coeruleus and substantia nigra pars compacta will aid in the development of new biomarkers and may provide insight in the development of novel interventions to arrest progression of Alzheimer's disease or Parkinson's disease. Imaging these structures with diffusion-weighted images is difficult due to their small stature (locus coeruleus is 1.5 mm in diameter and 15 mm long) and location in the brain stem. In this abstract, we utilize a high resolution diffusion-weighted protocol to examine age-related microstructural changes in locus coeruleus and substantia nigra pars compacta.
Introduction
Locus coeruleus (LC) and substantia nigra pars compacta (SNc) are neuromelanin containing structures in the brainstem and play key roles in normal cognitive function1,2. Neuronal loss in one or both of these structures occur in age-related diseases such as Alzheimer’s disease (AD)3 or Parkinson’s disease (PD)4. Characterization of age-related alterations in composition and morphology of these structures will aid in the development of new biomarkers and may provide insight in the development of novel interventions to arrest progression of AD or PD.
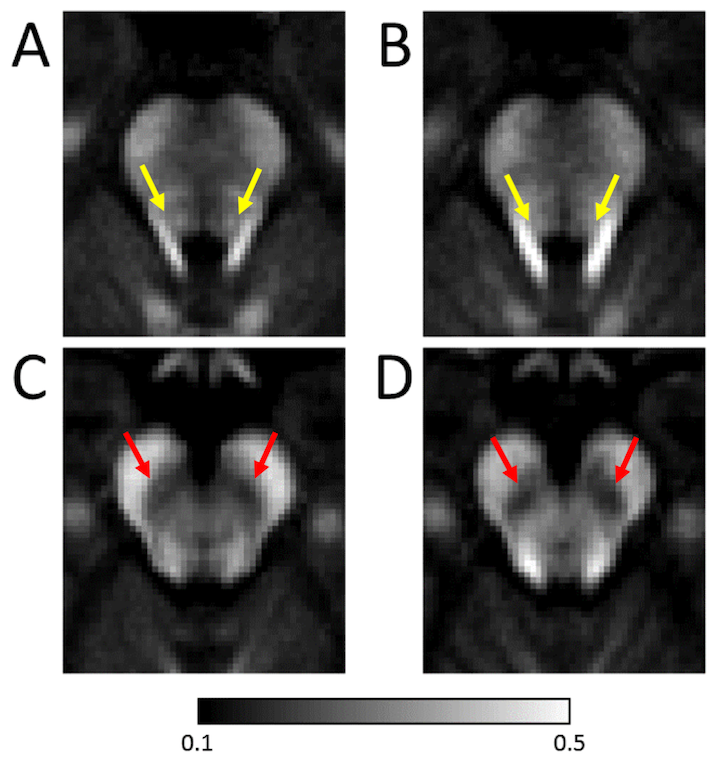
LC and SNc can be imaged using neuromelanin-sensitive MRI5,6, which has been used to define SNc regions of interest (ROIs) for characterization of microstructural changes due to pathology7,8. Diffusion properties can reveal age-related structural and morphological alterations, which may be related to age-related increases in neuromelanin. However, localization of LC ROIs in diffusion-weighted images is difficult due to its location on the dorsal edge of the brainstem and its small dimensions (1.5 mm in diameter and 15 mm long). Typical voxels used in diffusion weighted imaging are too large and are subject to partial volume effects when examining LC. Here, we examine age-related microstructural alterations in LC and SNc using a high resolution DTI protocol (voxel size = 0.95 x 0.95 x 1 mm3) as well as LC and SNc compositional changes.
Methods
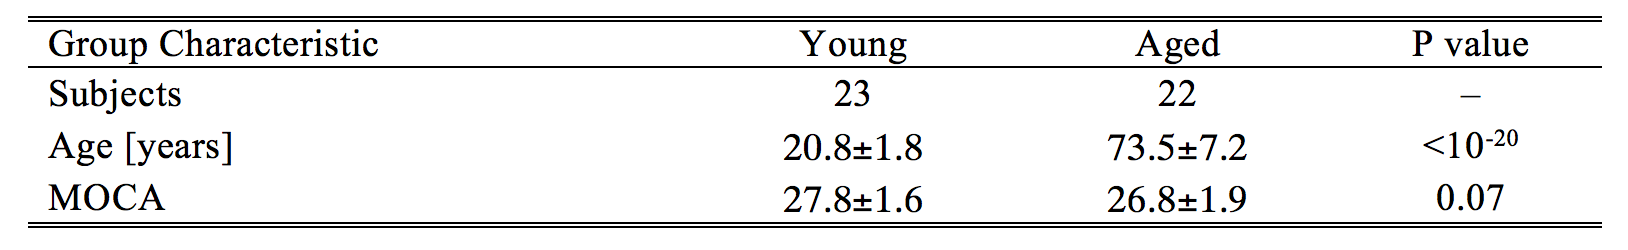
A cohort consisting of 45 subjects (22 aged and 23 young subjects) were scanned in this study. All subjects gave written, informed consent and demographic data is summarized in Table 1.
Imaging data were acquired on a 3 T MRI scanner (Prisma, Siemens Healthineers, Malvern, PA) using a 32-channel receive only coil. Images from a MP-RAGE sequence (echo time (TE)/repetition time (TR)/inversion time=3.02/2600/800 ms, flip angle=8°, voxel size=0.8×0.8×0.8 mm3) were used for registration from subject space to common space.
Multiecho data were collected with a 12 echo 3D gradient recalled echo (GRE) sequence: TE1/∆TE/TR = 4/3/40 ms, FOV = 192 × 224 mm2, matrix size of 192×224×96, slice thickness=1.7 mm, GRAPPA acceleration factor=2. R2* was calculated from the magnitude data assuming a mono-exponential decay and QSM was calculated from the phase data using custom MATLAB scripts.
High-resolution diffusion MRI data were collected with a single-shot spin-echo, echo planar imaging sequence. A dual spin-echo technique combined with monopolar gradients was used with the following parameters: TE / TR = 97 / 3292 ms, voxel size = 0.95 × 0.95 × 1 mm3, 64 slices with no gap, multiband factor = 2. Diffusion-weighting gradients were applied in 30 directions with two b values of 500 s/mm2 and 2000 s/mm2. A set of 32 b=0 images with phase-encoding directions of opposite polarity were acquired to correct for susceptibility distortion. Data were corrected for eddy current and susceptibility distortions using eddy in FSL.
Standard space LC and SNc atlases were used to localize LC and SNc and mean R2*, fractional anisotropy (FA), radial diffusivity (RD) and mean diffusivity (MD) were measured in both LC and SNc.Results and Discussion
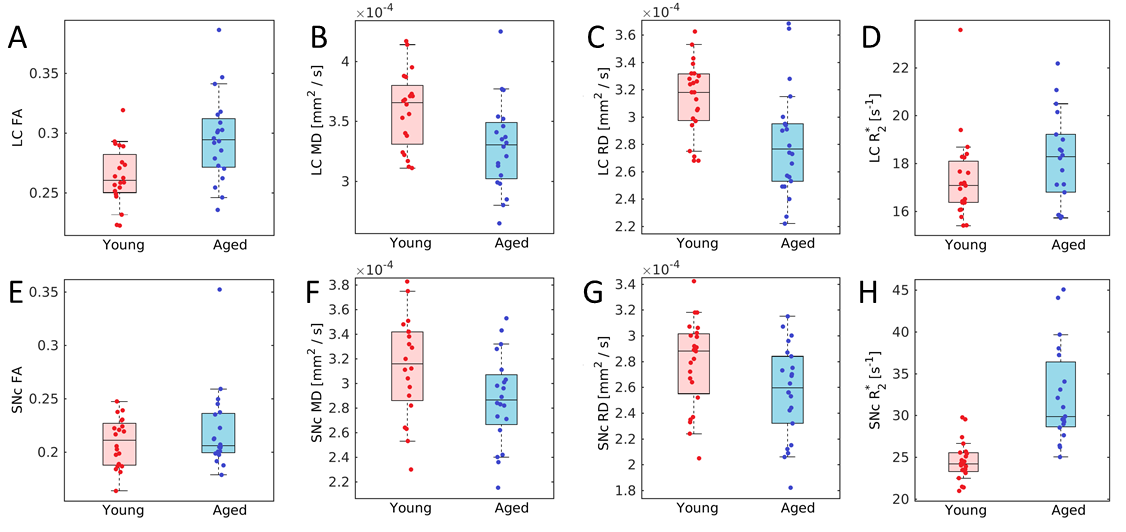
Mean FA in SNc and LC for aged and young groups are shown in Figure 1. A reduction in mean LC MD (aged: 3.31x10⁻⁴±4.2x10⁻⁵; young: 3.61x10⁻⁴±3.2x10⁻⁵; p=0.005) and LC RD (aged: 2.81x10⁻⁴±3.9x10⁻⁵; young: 3.14x10⁻⁴±2.7x10⁻⁵; p=0.002). An increase in mean LC FA (aged: 0.29±0.04; young: 0.26±0.02; p=0.003) was observed in the aged cohort as compared to young.
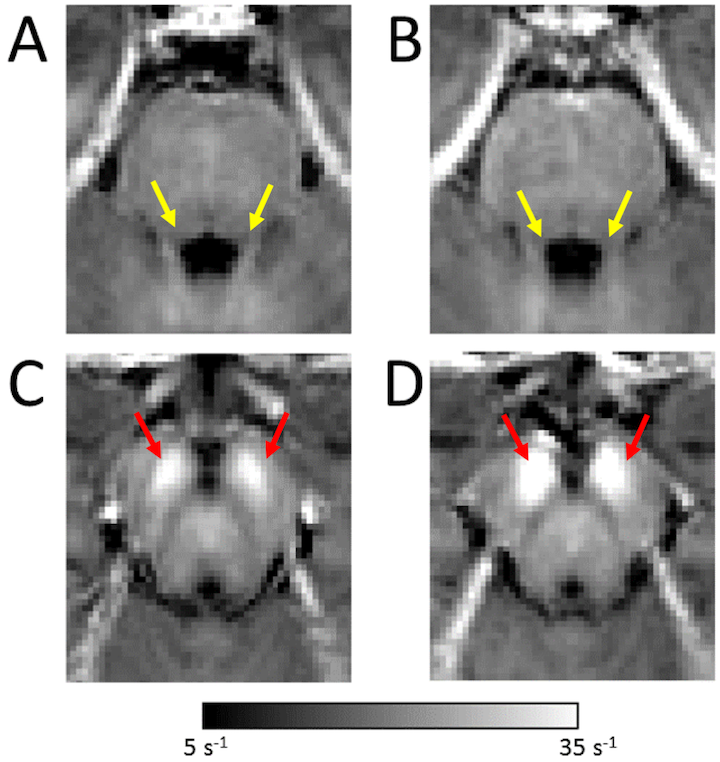
Figure 2 shows mean R2* maps in aged and young groups. LC in the aging cohort exhibited a non-statistically significant increase in R2* (aged: 18.2s-1±1.9s-1; young: 17.3s-1±1.7s-1; p= 0.06) and an increase in R2* (aged: 32.4s-1±5.9s-1; young: 24.5s-1±2.3s-1; p<10-5) was observed in SNc of the aged cohort. No difference was observed in the group comparisons for LC and SNc as shown in Figure 3.
In this abstract, we found increased FA, decreased MD, and decreased RD in LC of the aged cohort. These markers may reflect restricted diffusion from a decrease in LC axon diameter9. In SNc, neuromelanin chelates iron and increased iron deposition was observed in SNc of the aged cohort and increased iron concentration is linked to decreased FA10. Interestingly, a reduction in FA was not observed in SNc of the aging cohort but a statistically significant decrease in MD was observed, which may be related to increased iron content.
Acknowledgements
No acknowledgement found.References
[1] Aston-Jones and Cohen. Adaptive gain and the role of the locus coeruleus norepinephrine system in optimal performance. J Comp Neurol 493:99-110.
[2] Jahanshahi, et al. The substantia nigra pars compacta and temporal processing. J Neurosci 26:12266-73.
[3]. Braak, et al. Stages of the pathologic process in Alzheimer disease: age categories from 1 to 100 years. J Neuropathol Exp Neurol 70:960-9.
[4] Braak, et al. Staging of brain pathology related to sporadic Parkinson’s disease. Neurobiol Aging 24:197-211.
[5] Schwarz, et al. T1-weighted MRI shows stage-dependent substantia nigra signal loss in Parkinson’s disease. Mov Disord 26:1688-8.
[6] Chen, et al. Simultaneous imaging of locus coeruleus and
substantia nigra with a quantitative neuromelanin MRI approach. Magn Reson
Imaging. 32:1301-6.
[7] Langley, et al. Diffusion Tensor Imaging of the Substantia Nigra in Parkinson’s Disease Revisited. Hum Brain Map 37:2547-56.
[8] Langley, et al. Parkinson’s Disease–Related Increase of T2-Weighted Hypointensity in Substantia Nigra Pars Compacta. Mov Disord 32:441-9.
[9] Barazany, et al. In vivo measurement of axon diameter distribution in the corpus callosum of rat brain. Brain 132:1210–1220.
[10] Fujiwara, et al. Quantification of iron in the non-human primate brain with diffusion-weighted magnetic resonance imaging. Neuroimage 102:789–797.
Figures