2629
Longitudinal tensor-based morphometry in healthy aging1Henry M. Jackson Foundation, Bethesda, MD, United States, 2NIBIB, National Institutes of Health, Bethesda, MD, United States, 3NIMH, National Institutes of Health, Bethesda, MD, United States
Synopsis
Previous studies of healthy elderly populations combined a longitudinal design with tensor-based morphometry (TBM) and found significant gray matter (GM) atrophy over short time periods. We examined a separate healthy elderly population using a different method to determine if previous results are biologically driven, and investigated the relationship between GM and cognition. We also detected significant GM atrophy, but did not find a link between GM, age, and cognition. Our longitudinal TBM approach is sensitive to subtle, short-term GM changes, but further investigation is necessary to examine the effect of different methodological approaches on the relationship between GM and cognition.
Introduction
A longitudinal study design can reduce between-subject variance and sample heterogeneity, allowing for brain structure changes to be assessed at the individual level.1,2 A longitudinal design used with tensor-based morphometry (TBM)3 can identify subtle volume changes over time. A few studies of healthy elderly populations combined these methods to examine brain volume changes over short time periods, and detected global, frontal, and temporal gray matter (GM) atrophy.4-11 One objective of the current study is to examine a separate healthy elderly population using different methods for acquisition, processing, and analysis to replicate these previous findings and determine if they are biologically rather than methodologically driven. Another objective is to investigate the relationship between brain volume changes and cognition.Methods
T1-weighted MPRAGE images from 72 healthy elderly adults aged 66-95 from Rush Alzheimer's Disease Memory and Aging Project were acquired on a 3T Siemens Magnetom TrioTim MRI scanner at a two-year interval.12 For each individual, we performed TBM by registering the second collected T1-weighted image to the first using ANTs SyN registration.13 We computed the natural log of the Jacobian (lnJ) of the deformation field (combined affine and highly deformable) between the two time points to obtain the volume change (lnJTime). Desikan atlas and global GM ROIs were generated for each individual in native space using Freesurfer.14-25 Median lnJTime values were calculated for global GM and each ROI. Left and right ROIs were combined since their median lnJTime values were not significantly different.
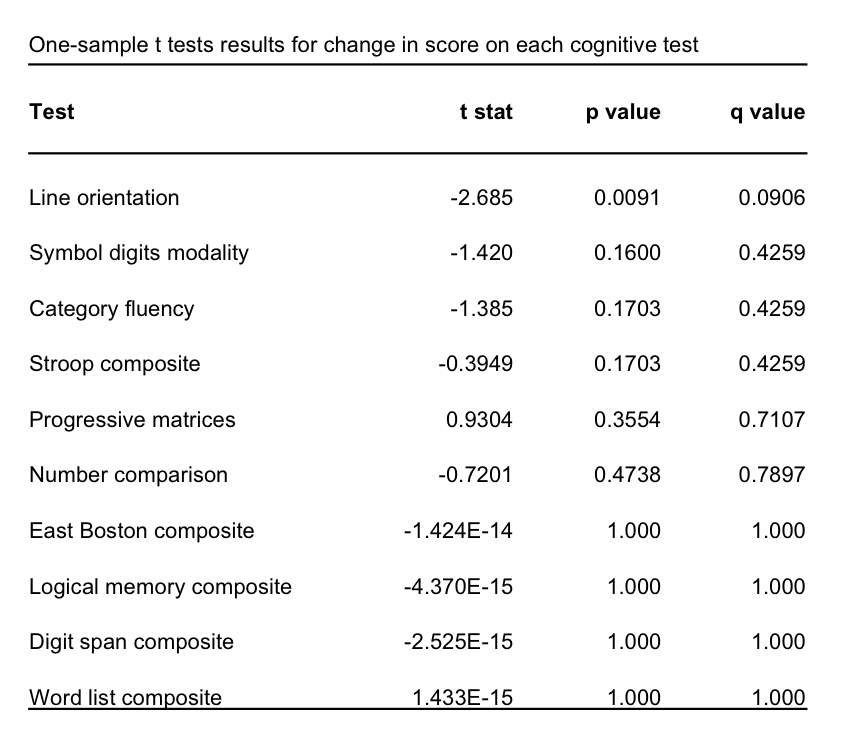
Cognitive change was assessed using scores from 16 tests administered at both time-points and was calculated as the difference between the two scores. Raw scores were used from five tests: category fluency, line orientation, number comparison, progressive matrices, symbol digits modalities. The remaining tests consisted of different versions (immediate and delayed word list, East Boston, and logical memory; Stroop word-reading and color-naming; digit span forward, backward, and ordering) that were each highly correlated (r>0.7). Composite scores were computed by calculating the z-score for each test and taking the mean.
One-sample t-tests were performed to test if lnJTime was significantly different than zero. If lnJTime was significantly different than zero, we performed a linear model between lnJTime and age. For cognitive tests, we performed one-sample t-tests to assess if the score changes were significantly different than zero. For tests showing a significant change, we performed linear models to test for a relationship between score change and lnJTime. Statistical tests performed on the cognitive tests and ROI comparisons were corrected for multiple comparisons using false discovery rate (FDR) to obtain the q-value. Analyses were performed using ANTsR and R.26-27
Results
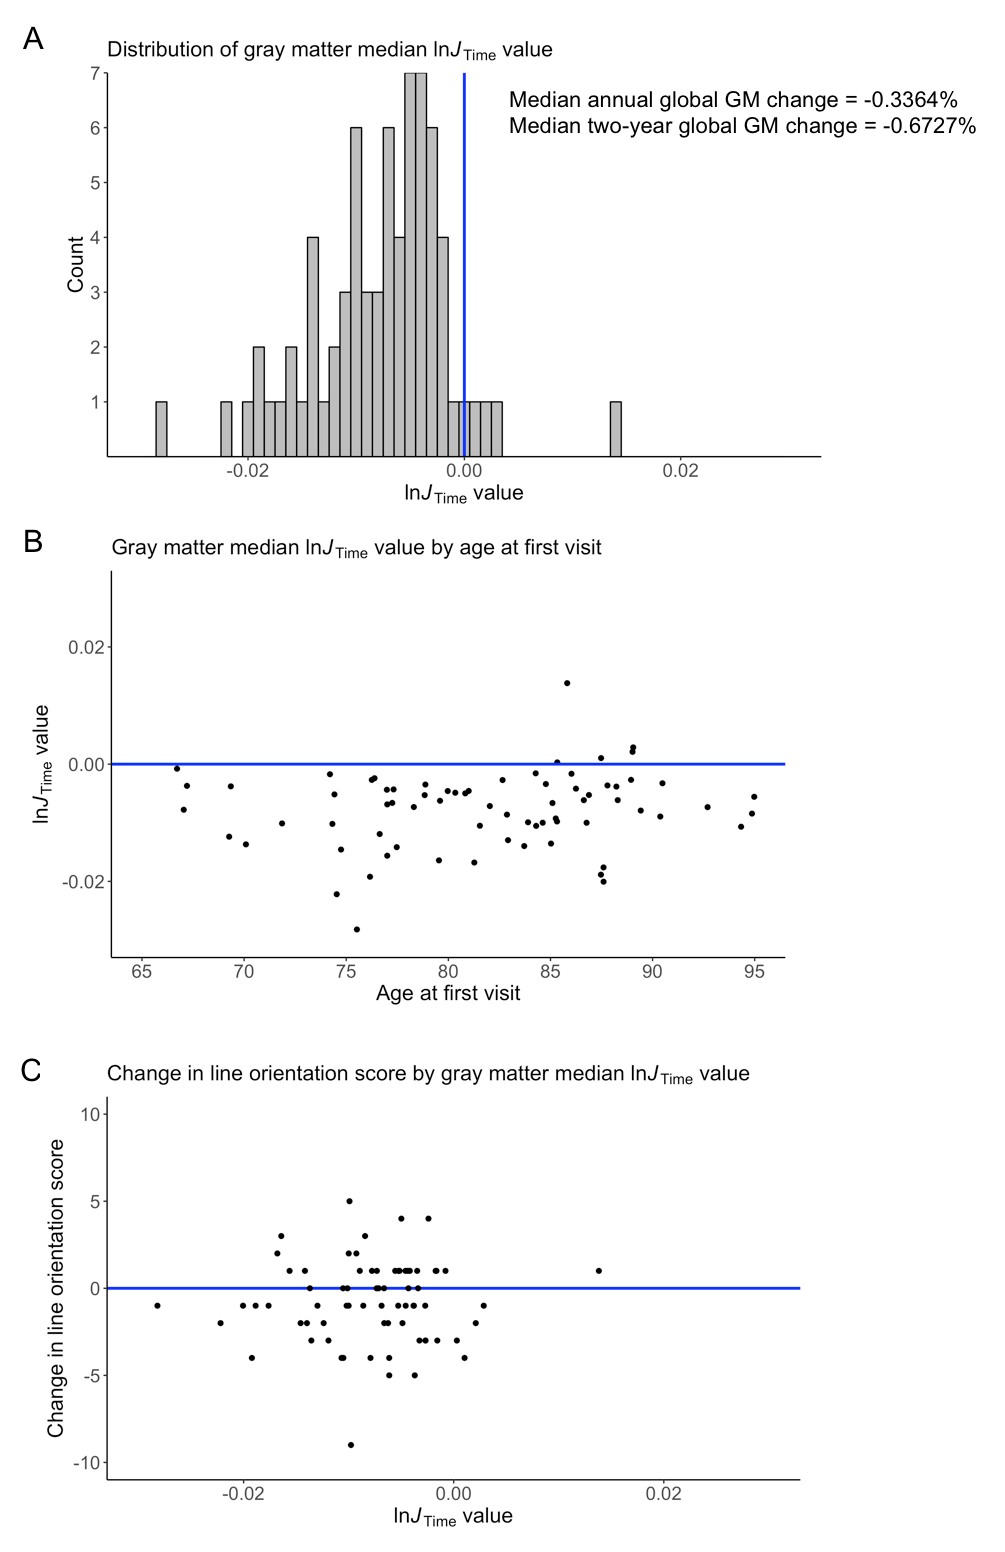
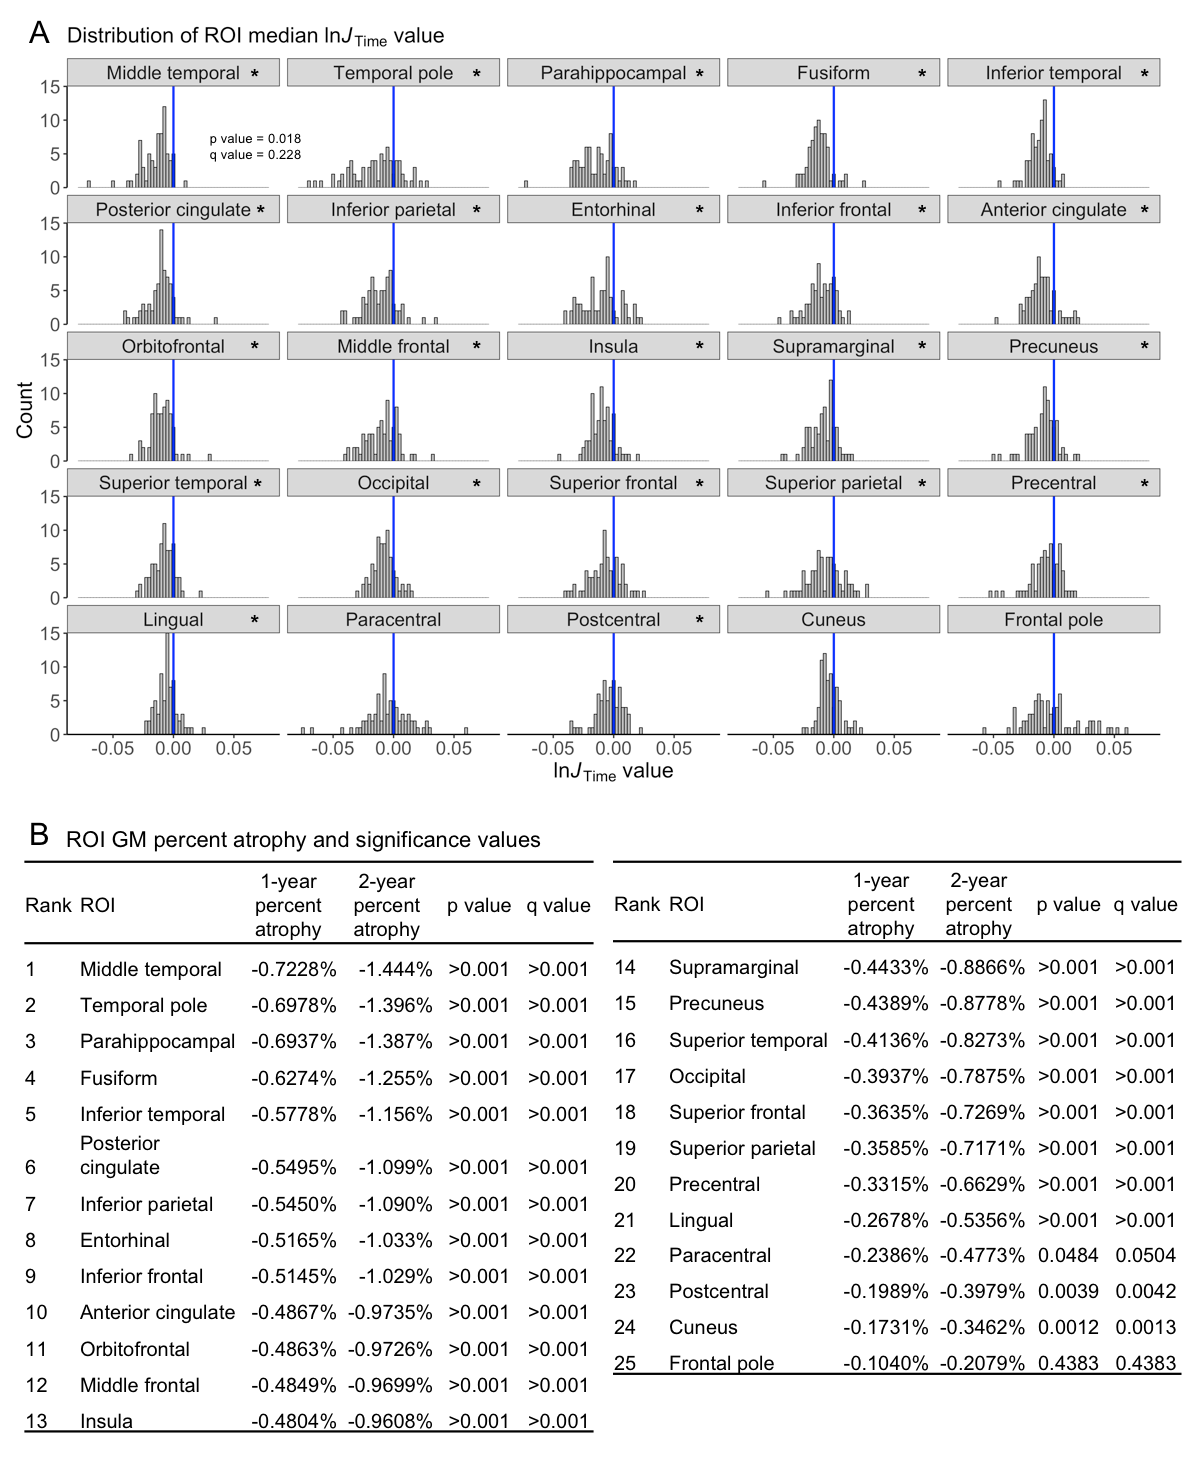
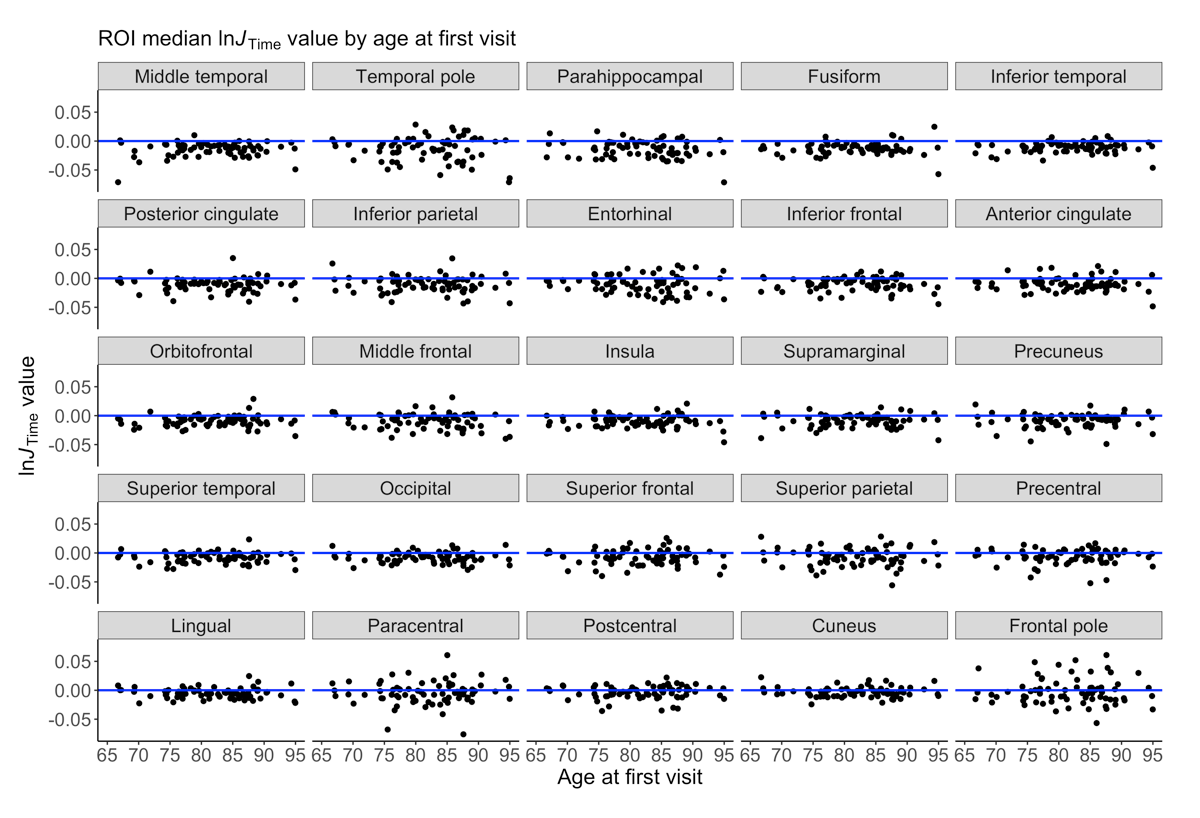
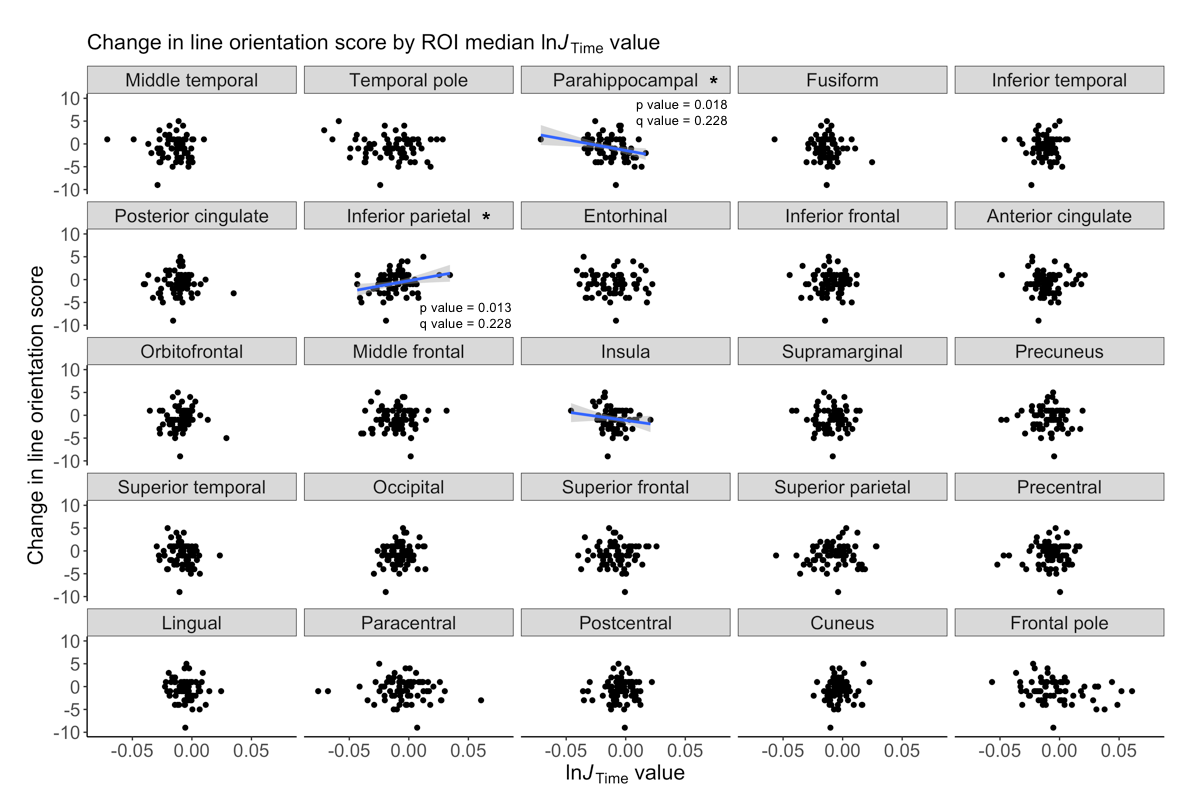
We detected significant global GM atrophy of -0.6727% over two years (Figure 1A). GM atrophy was not significantly related to age or cognitive decline since test scores remained stable over two years (Figures 1B-C,2). The line orientation test showed a significant difference from zero (p<0.01), but this result did not survive multiple comparisons correction (q=0.09; Figure 2), and was not significantly related to GM atrophy (Figure 1C). The ROI analysis showed significant atrophy throughout the cortex (Figure 3A-B), particularly in temporal GM (Figure 3B), but no regional relationship between GM atrophy and age (Figure 4). GM atrophy in inferior parietal and parahippocampal ROIs was significantly associated with line orientation score change (p<0.02), but this did not survive multiple comparisons correction (q=0.228; Figure 5).Discussion
These results support previous findings of detectable GM atrophy over a two-year interval that is most evident in temporal GM. Global GM and ROI atrophy was within the range of 0.5-1% per year shown in prior studies (Figure 3B) even with differences in acquisition, processing, and analytical methods.28 A previous analysis of brain volume change and cognitive trajectories showed that global and temporal GM atrophy was strongly associated with cognitive decline in a sample including both healthy elderly and cognitively impaired individuals.10 The current study did not replicate these findings since we did not detect any age effects or relationship between atrophy and cognition. However, differences in sample composition and analytical model may account for differences in these results.Conclusion
The longitudinal TBM approach from the current study is sensitive to subtle changes in the cortex over a short two-year period and is capable of detecting patterns of GM atrophy that have been identified in previous studies using different samples and methods. In contrast to previous studies, we found that GM atrophy is not related to cognitive change in a healthy elderly population. Future work will further investigate how GM atrophy may be affected by different processing and analytical methods and will examine how these different approaches can affect the relationship between GM atrophy and cognition.Acknowledgements
No acknowledgement found.References
1. Fotenos AF, Snyder AZ, Girton LE et al. Normative estimates of cross-sectional and longitudinal brain volume decline in aging and AD. Neurology. 2005;64(6):1032-1039.
2. Raz N, Lindenberger U, Rogrigue KM et al. Regional brain changes in aging healthy adults: general trends, individual differences, and modifiers. Cereb Cortex. 2005;15(11):1676-1689.
3. Asburner J, Friston KJ. Morphometry. In: Frackowiak RSJ (ed.), Human Brain Function, 2nd edition. 2004;707-724.
4. Fjell AM, Walhovd KB, Fennema-Notestine C et al. One-year brain atrophy evident in healthy aging. J Neurosci. 2009;29(48):15223-15231.
5. Fjell AM, McEvoy L, Holland D et al. Brain changes in older adults at very low risk for Alzheimer's Disease. J Neurosci. 2013;33(19):8237-8242.
6. Leow AD, Yanovsky I, Parikshak N et al. Alzheimer's Disease Neuroimaging Initiative: a one year follow up study using tensor-based morphometry correlating degenerative rates, biomarkers and cognition. NeuroImage. 2009;45(3):645-655.
7. Hua X, Hibar DP, Lee S et al. Sex and age differences in atrophic rates: an ADNI study with n=1368 MRI scans. Neurobiol Aging. 2010;31(8):1463-1480.
8. Hua X, Gutman B, Boyle CP et al. Accurate measurment of brain changes in longitudinal MRI scans using tensor-based morphometry. NeuroImage. 2011;57(1):5-14.
9. Hua X, Hibar DP, Ching CRK et al. Unbiased tensor-based morphometry: improved robustness and sample size estimates for Alzheimer's Disease clinical trials. NeuroImage. 2013;66:648-661.
10. Hua X, Ching, CRK, Mezher A et al. MRI-based atrophy rates in ADNI phase 2: acceleration and enrichment considerations for clinical trials. Neurobiol Aging. 2016;37:26-37.
11. Fletcher E, Gavett B, Harvey D et al. Brain volume change and cognitive trajectories in aging. Neuropsychology. 2018;32(4):436-449.
12. Bennett DA, Schneider JA, Buchman AS et al. Overview and findings from the Rush Memory and Aging Project. Curr Alzheimer Res. 2012;9(6):646-663.
13. Avants BB, Tustison NJ, Song G et al. A reproducible evaluation of ANTs similarity metric performance in brain image registration. NeuroImage. 2011;54(3):2033-2044.
14. Dale AM, Fischl B, Sereno MI. Cortical surface-based analysis. I. Segmentation and surface reconstruction. Neuroimage. 1999;9:179-194.
15. Desikan RS, Segonne F, Fischl B et al. An automated labeling system for subdividing the human cerebral cortex on MRI scans into gyral based regions of interest. Neuroimage. 2006;31:968-980.
16. Fischl B, Liu A, Dale AM. Automated manifold surgery: constructing geometrically accurate and topologically correct models of the human cerebral cortex. IEEE Trans Med Imaging. 2001;20:70-80.
17. Fischl B, Salat DH, Busa E, et al. Whole brain segmentation: automated labeling of neuroanatomical structures in the human brain. Neuron. 2002;33:341-355.
18. Fischl B, Salat DH, van der Kouwe AJ et al. Sequence-independent segmentation of magnetic resonance images. Neuroimage. 2004;23(Suppl 1):S69-84.
19. Fischl B, Sereno MI, Dale AM. Cortical surface-based analysis. II: Inflation, flattening, and a surface-based coordinate system. Neuroimage. 1999;9:195-207.
20. Fischl B, Sereno MI, Tootell RB et al. High-resolution intersubject averaging and a coordinate system for the cortical surface. Hum Brain Mapp. 1999;8:272-284.
21. Fischl B, van der Kouwe A, Destrieux C et al. Automatically parcellating the human cerebral cortex. Cereb Cortex. 2004;14:11-22.
22. Jovicich J, Czanner S, Greve D et al. Reliability in multi-site structural MRI studies: effects of gradient non-linearity correction on phantom and human data. Neuroimage. 2006;30:436-443. 23. Segonne F, Dale AM, Busa E et al. A hybrid approach to the skull stripping problem in MRI. Neuroimage. 2004;22:1060-1075.
24. Segonne F, Pacheco J, Fischl B et al. Geometrically accurate topology-correction of cortical surfaces using nonseparating loops. IEEE Trans Med Imaging. 2007;26:518-529.
25. Sled JG, Zijdenbos AP, Evans AC. A nonparametric method for automatic correction of intensity nonuniformity in MRI data. IEEE Trans Med Imaging. 1998;17:87-97.
26. Avants BB. ANTsR: ANTs in R: Quantification tools for biomedical images. R package version 0.7.1. 2017. 27. R Core Team. R: A language and environment for statistical computing. R Foundation for Statistical Computing. 2016.
28. Fjell AM, Walhovd KB. Structural brain changes in aging: courses, causes, and cognitive consequences. Rev Neurosci. 2010;21(3):187-222.
Figures