2626
Sex differences in structural variability of brain regions in development and young adults1CAMH, Toronto, ON, Canada, 2Psychiatry, University of Toronto, Toronto, ON, Canada
Synopsis
Increased variability of brain metrics is suggested to relate to increased vulnerability for psychiatric disorders.
Here we investigate sex differences in variability of brain structure (global and subcortical volume, regional cortical thickness and surface area) in young adults (n=1,032, 22-35 years, Human Connectome Project [HCP]) and through development (n=1,347, 8-21 years, Philadelphia Neurodevelopmental Cohort [PNC]).
Both volume and surface area were observed to be generally more variable in males compared to females in both development and adulthood. This increased variability may relate to the elevated vulnerability for psychiatric disorders seen in males compared to females.
Introduction
Sex differences in onset, presentation and prevalence of psychiatric disorders are common.1 Elucidating sex differences in the healthy population is an essential first step towards understanding sex differences in disease and potentially protective mechanisms at play. Most neuroimaging research to date has examined differences on average between males and females. However, two recent studies showed higher variability in brain metrics of males compared to females. The first used a large sample of older adults (UK BioBank data, n=5,000, 44-77 years),2 while the second used a large developmental dataset (Pediatric Imaging, Neurocognition, and Genetics [PING] Study, n=1,234, 3-21 years).3 However, brain variability in young adults, where the brain is relatively stable, has yet to be investigated. Here we intend to build on previous findings by investigating sex differences in variability of brain structure in young adults and during development.Methods
Adult sample: Healthy adults aged 22-35 years (n=1,032) were included from the Human Connectome Project (HCP)4 Young Adult S1200 release. FreeSurfer processed data were available for download (n=1,113). A number of subjects (n=81) were excluded based on quality control.
Developmental sample: Individuals aged 8-21 years (n=1,347) were included from the Philadelphia Neurodevelopmental Cohort (PNC)5 following successful processing of the T1-weighted data with FreeSurfer (v6.0;6–9 n=1,479), exclusion based on quality control (n=51) and the presence of a major medical condition (n=81).
Analysis: Global and subcortical volumes, as well as cortical thickness (CT) and cortical surface area (SA) were extracted for regions based on the Desikan-Killiany parcellation.10 Variance associated with age was regressed (linear model) from our measures. To compare variance differences between males and females a variance ratio (VR) was generated with an F test (var.test). To investigate the role of TBV, residuals were generated for measures where TBV (BrainSeg_No_Vent) in addition to age were regressed out. Similar variance tests were then conducted on these residuals. False discovery rate (FDR) correction was implemented within each analysis (q<0.05).
Results
Volume: TBV (adult, similar but non-significant in development), cerebral grey and white matter (adult and development), and cerebellar white matter (adult only) were significantly more variable in males than females (VR=1.22-1.45, q<0.05). Cerebellar grey matter showed a similar but non-significant pattern across both samples (VR=1.07-1.20). Correcting for TBV gave similar results (Figure 1).
In adults, the bilateral thalamus, amygdala and caudate, left hippocampus and right nucleus accumbens (VR=1.24-1.56, q<0.05) were significantly more variable in males compared to females (Figure 2). In development, 2 of these regions also met significance; right thalamus and left caudate (VR=1.26-1.29, q<0.02). Following TBV correction, the left hippocampus and left amygdala (VR=1.32-1.66, q<0.01) still showed a statistically significant sex difference in variance in adults only. In development, correcting for TBV revealed additional regions where males were significantly more variable to females; left thalamus, bilateral pallidum, right putamen and left amygdala (VR=1.21-1.41, q<0.02).
Surface Area: Greater variance of SA was widespread for males compared to females in both adults (57/68 regions, VR 1.20-2.18, q<0.05) and development (52/68 regions, VR 1.17-1.56, q<0.05). Correcting for TBV gave similar results (Figure 3).
Cortical Thickness: In adults, one region showed significantly greater variance in CT for males compared to females; left isthmus cingulate (VR=1.42, q=0.004, similar following TBV correction). All other regions in adults and all regions in development had similar variance in CT for males and females.
Discussion
Both volume and SA are generally more variable in males compared to females. These findings are robust to accounting for TBV and appear in young adults as well as in development. This is in line with two recent reports of increased variability in older adults2 and during development.3 Some variability between findings in adults and development exists, likely due to divergent developmental patterns for males and females during this period. In future, other modalities (e.g. functional and structural connectivity) should be investigated and how these variations relate to behaviour and cognition examined. Finally, using a functionally derived parcellation may give more specific or functionally relevant results.Conclusion
There is higher variability of brain structures in males compared to females which may relate to their increased vulnerability for psychiatric disorders.Acknowledgements
Data collection and sharing for this project was provided by the Human Connectome Project (HCP; Principal Investigators: Bruce Rosen, M.D., Ph.D., Arthur W. Toga, Ph.D., Van J. Weeden, MD). HCP funding was provided by the National Institute of Dental and Craniofacial Research (NIDCR), the National Institute of Mental Health (NIMH), and the National Institute of Neurological Disorders and Stroke (NINDS). HCP data are disseminated by the Laboratory of Neuro Imaging at the University of Southern California.The Philadelphia Neurodevelopmental Cohort (PNC) was funded through NIMH RC2 grants MH089983 (Raquel E Gur) and MH089924 (Hakon Hakonarson).References
1. American Psychiatric Association. Diagnostic and statistical manual of mental disorders. 2013.
2. Ritchie SJ, Cox SR, Shen X, et al. Sex Differences In The Adult Human Brain: Evidence From 5,216 UK Biobank Participants. Cereb. Cortex. 2018;28(8):2959-2975.
3. Wierenga LM, Sexton JA, laake P, et al. A Key Characteristic of Sex Differences in the Developing Brain: Greater Variability in Brain Structure of Boys than Girls. Cereb. Cortex. 2018;28(8):2741–2751.
4. Van Essen DC, Ugurbil K, Auerbach E, et al. The Human Connectome Project: a data acquisition perspective. Neuroimage. 2012:62(4):2222–2231.
5. Satterthwaite TD, Connolly JJ, Ruparel K, et al. The Philadelphia Neurodevelopmental Cohort: A publicly available resource for the study of normal and abnormal brain development in youth. Neuroimage. 2016;124(Pt B):1115–1119.
6. Dale AM, Fischl B & Sereno MI. Cortical surface-based analysis. I. Segmentation and surface reconstruction. Neuroimage. 1999;9(2):179–194.
7. Fischl B, Sereno MI & Dale AM. Cortical surface-based analysis. II: Inflation, flattening, and a surface-based coordinate system. Neuroimage. 1999;9(2):195–207.
8. Fischl B, Sereno MI, Tootell RB, et al. High-resolution intersubject averaging and a coordinate system for the cortical surface. Hum. Brain Mapp. 1999;8(4):272–284.
9. Fischl B & Dale AM. Measuring the thickness of the human cerebral cortex from magnetic resonance images. Proc. Natl. Acad. Sci. U. S. A. 2000;97(20):11050–11055.
10. Desikan RS, Segonne F, Fischl B, et al. An automated labeling system for subdividing the human cerebral cortex on MRI scans into gyral based regions of interest. Neuroimage. 2006;31(3):968–980.
Figures
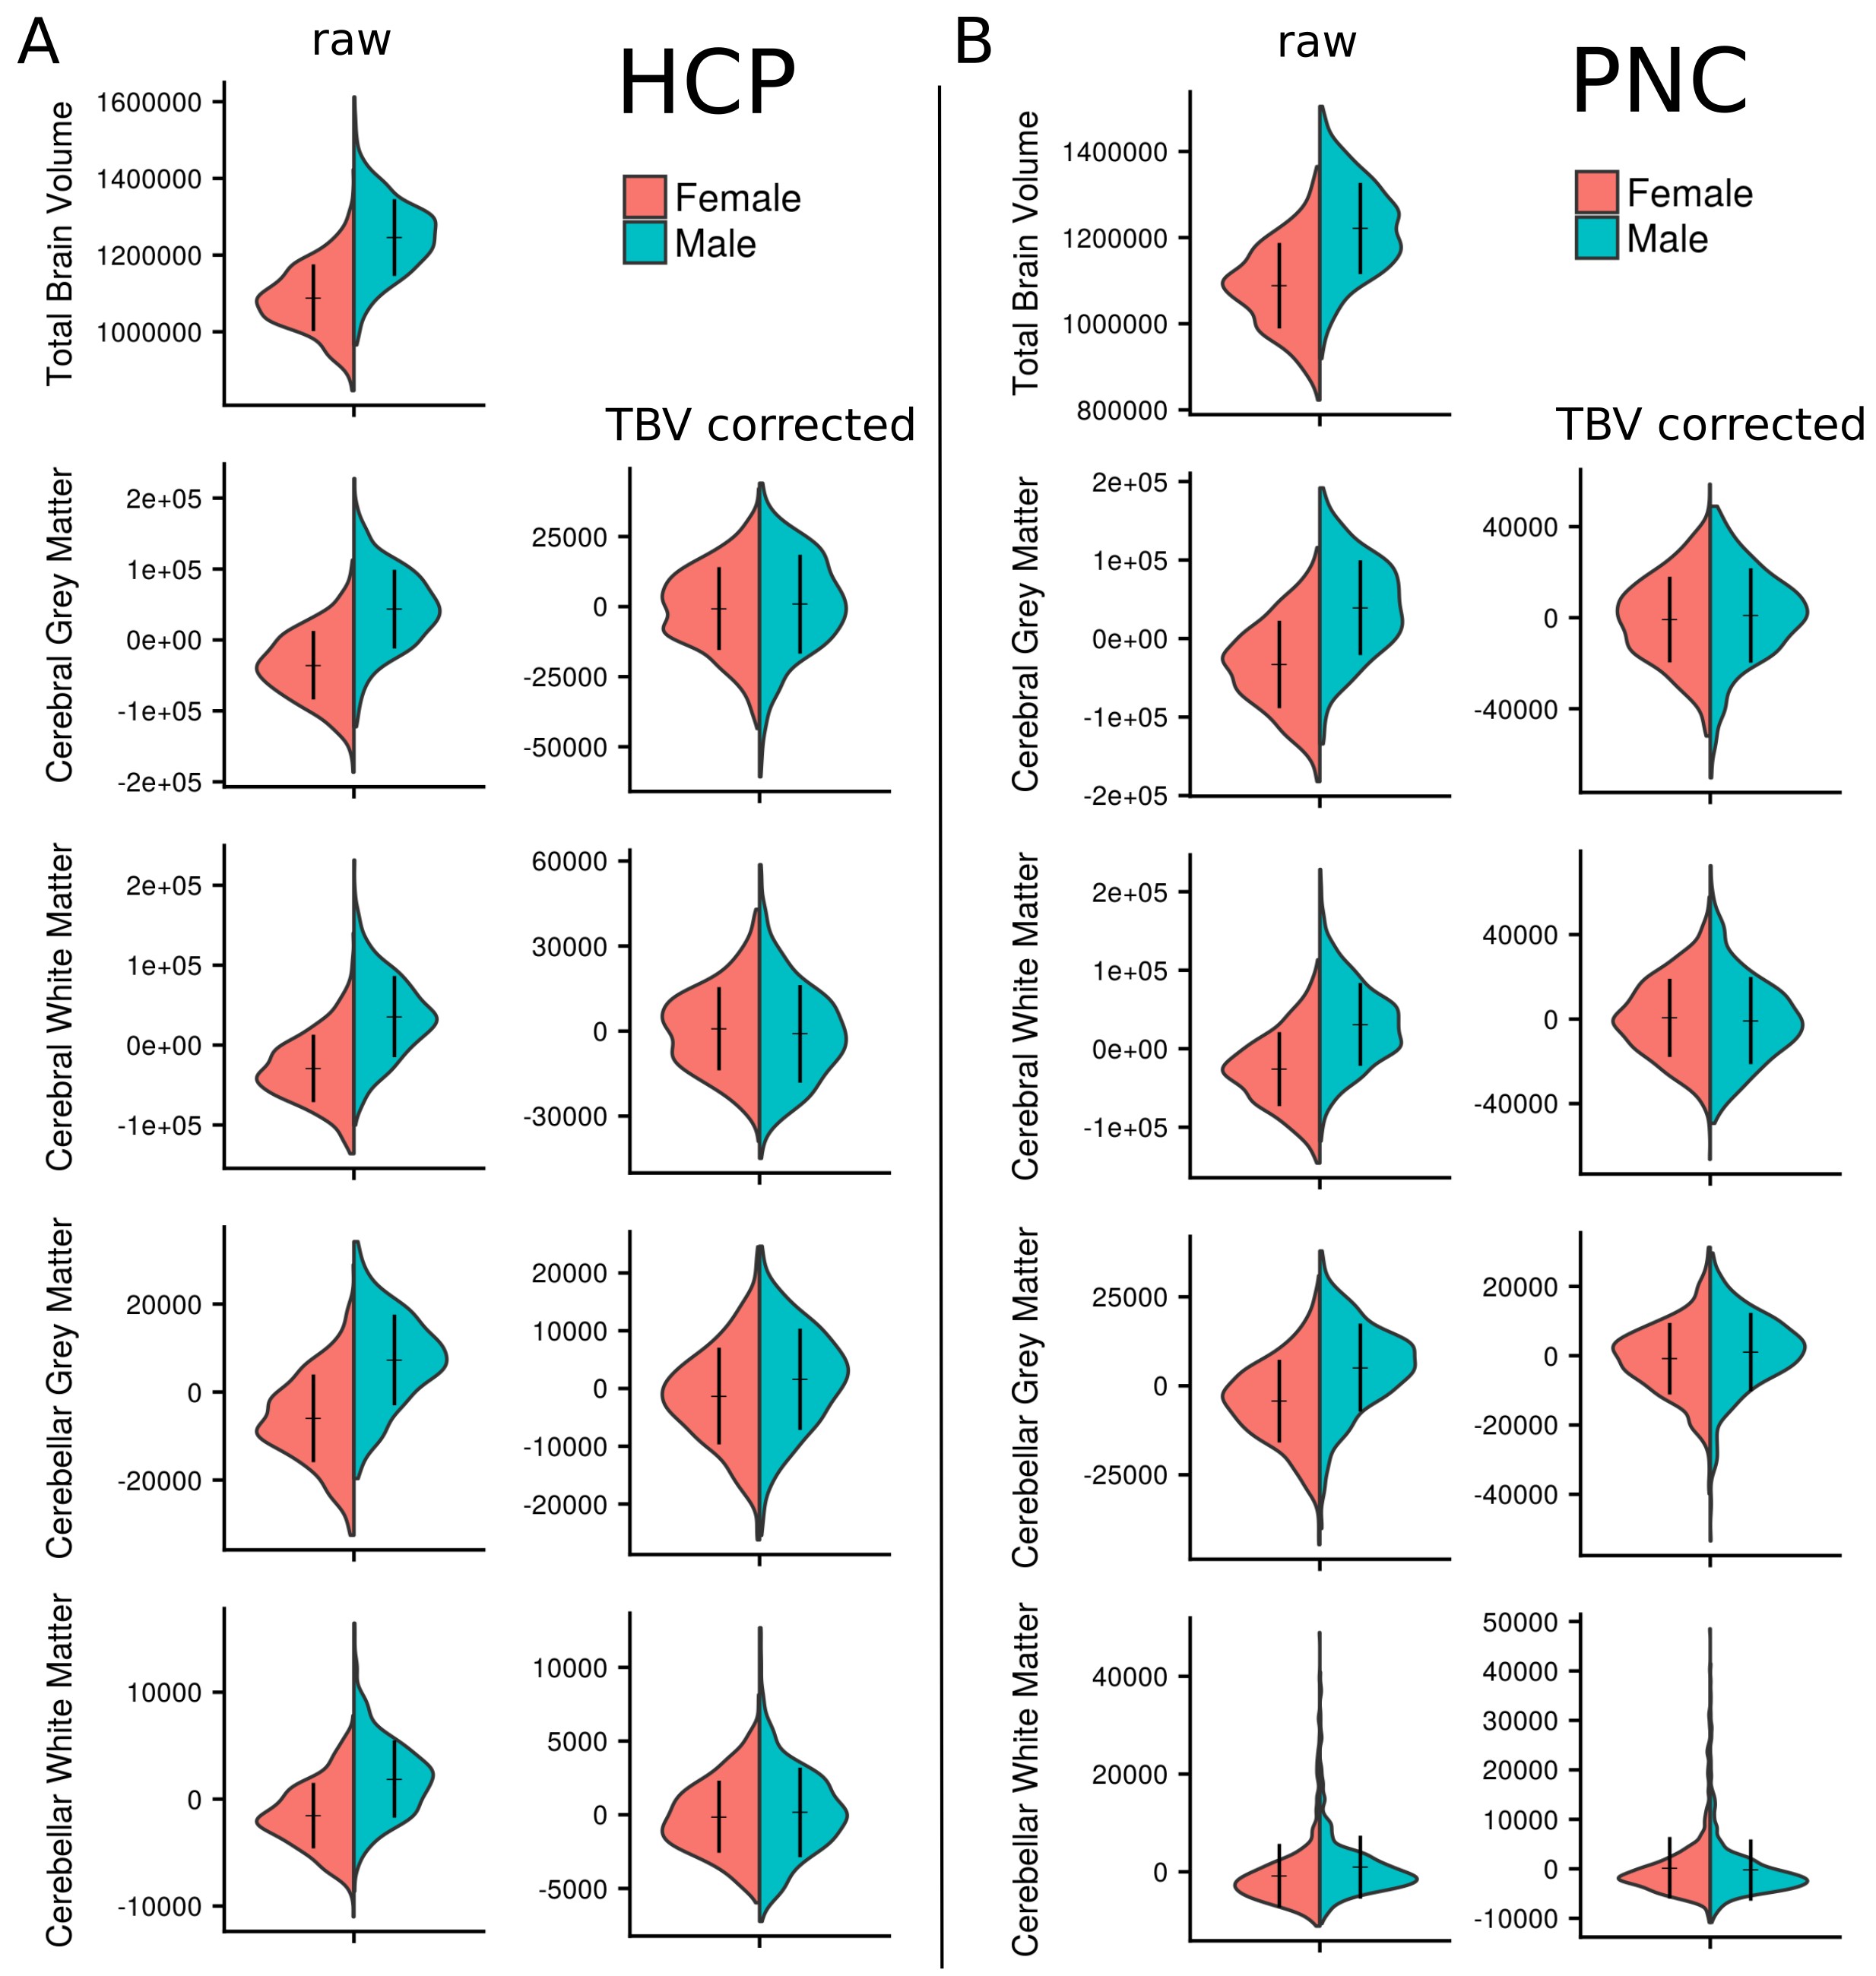
Figure 1 Sex differences on global volume
(A, left panel) shows data from HCP, (B, right panel) shows data from PNC. ‘Raw’ data represent volumes corrected for age (age effects regressed out) for the total brain volume (TBV), cerebral grey and white matter volume and cerebellar grey and white matter volume, respectively. Corresponding ‘TBV corrected’ graphs show the grey and white matter volumes corrected for TBV as well as age. Mean and standard deviation of the data are represented by the horizontal and vertical lines, respectively.
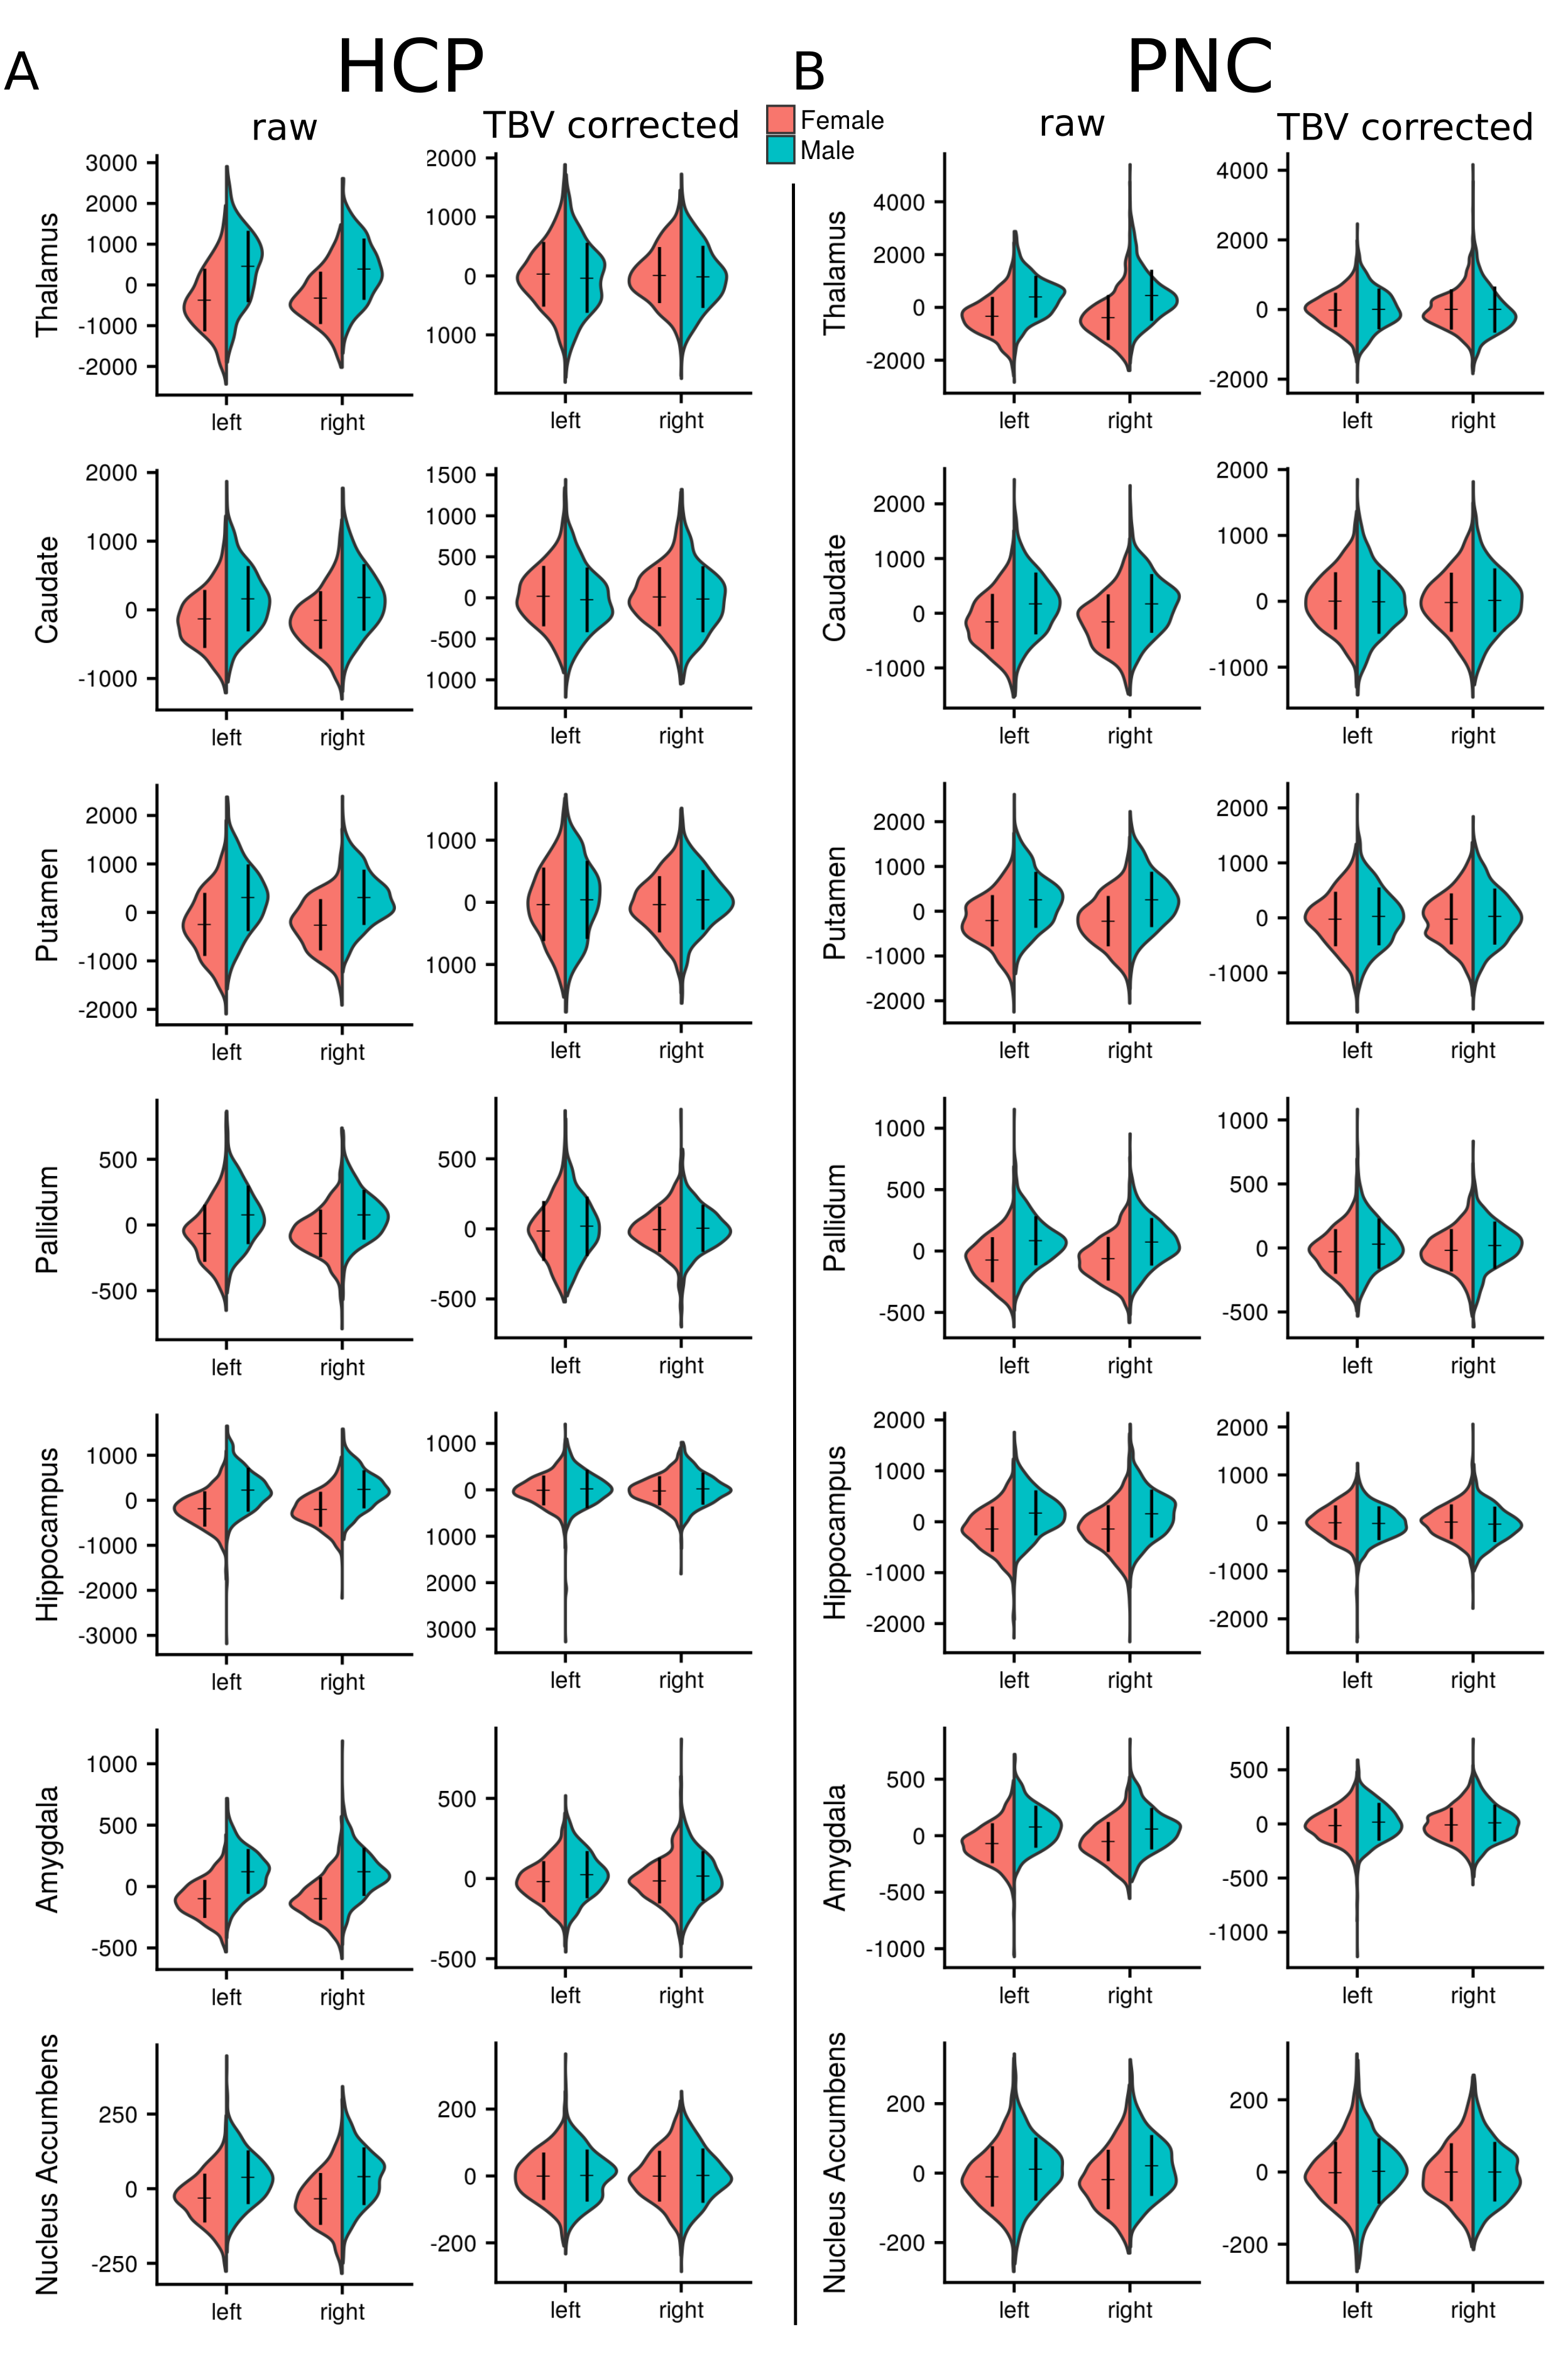
Figure 2 Sex differences on sub-cortical volume
(A, left 2 columns) shows data from HCP, (B, right 2 columns) shows data from PNC. ‘Raw’ data represent volumes corrected for age (age effects regressed out) for each subcortical structure. Corresponding ‘TBV corrected’ graphs show volumes corrected for total brain volume (TBV) as well as age. Mean and standard deviation of the data are represented by the horizontal and vertical lines, respectively.
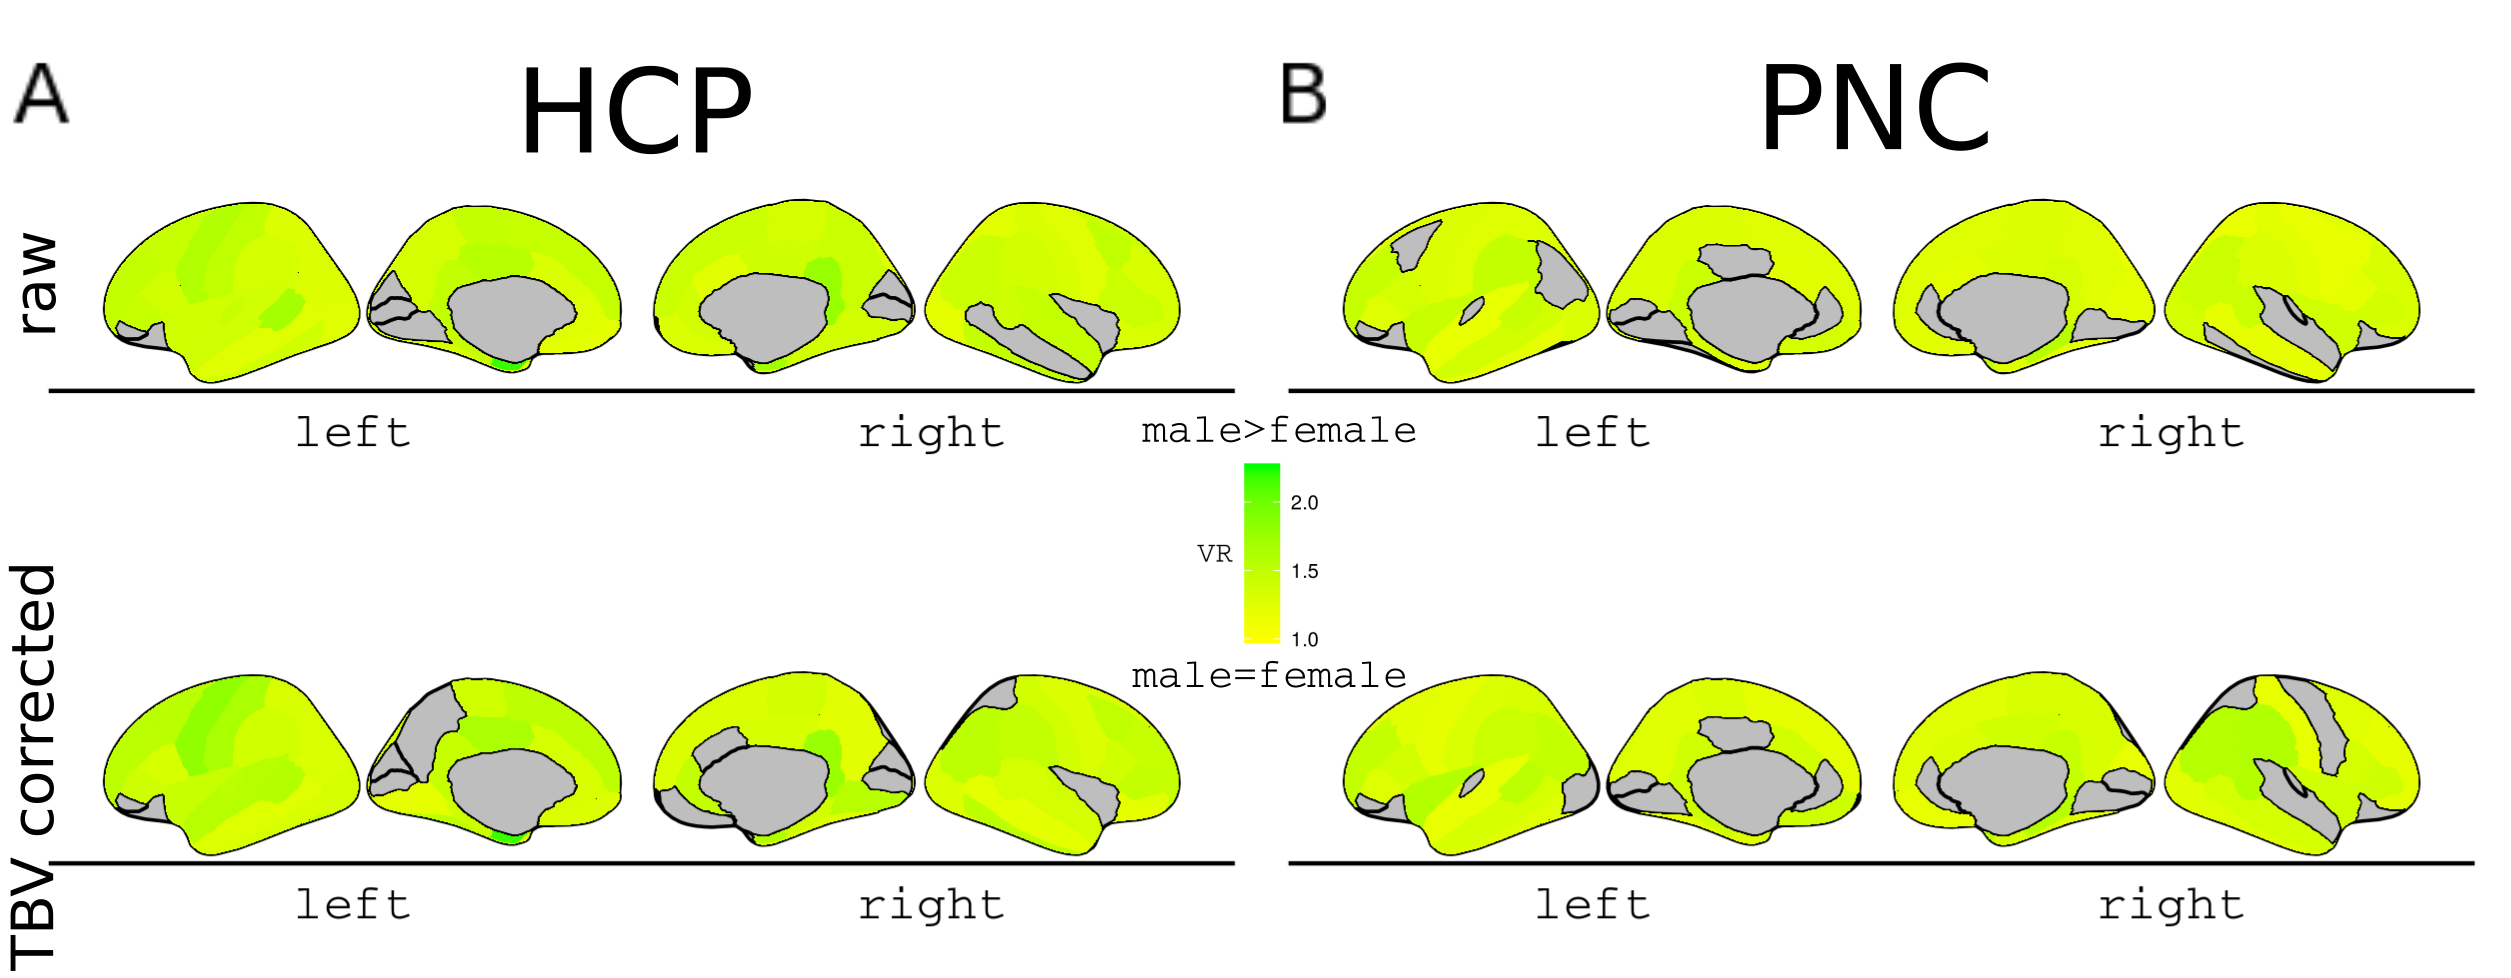
Figure 3 Sex differences on Cortical Surface Area
Statistically significant (q<0.05) variance ratio’s (VR) in the comparison of SA variances between males and females are mapped on the cortical surface. VR>1 indicates males>females, there were no regions where females>males. ‘Raw’ figures (top row) represent metrics derived from data corrected for age (age effects regressed out). Corresponding ‘TBV corrected’ figures displayed below show metrics corrected for total brain volume (TBV) as well as age.